Copyright
©The Author(s) 2025.
World J Gastrointest Oncol. May 15, 2025; 17(5): 103594
Published online May 15, 2025. doi: 10.4251/wjgo.v17.i5.103594
Published online May 15, 2025. doi: 10.4251/wjgo.v17.i5.103594
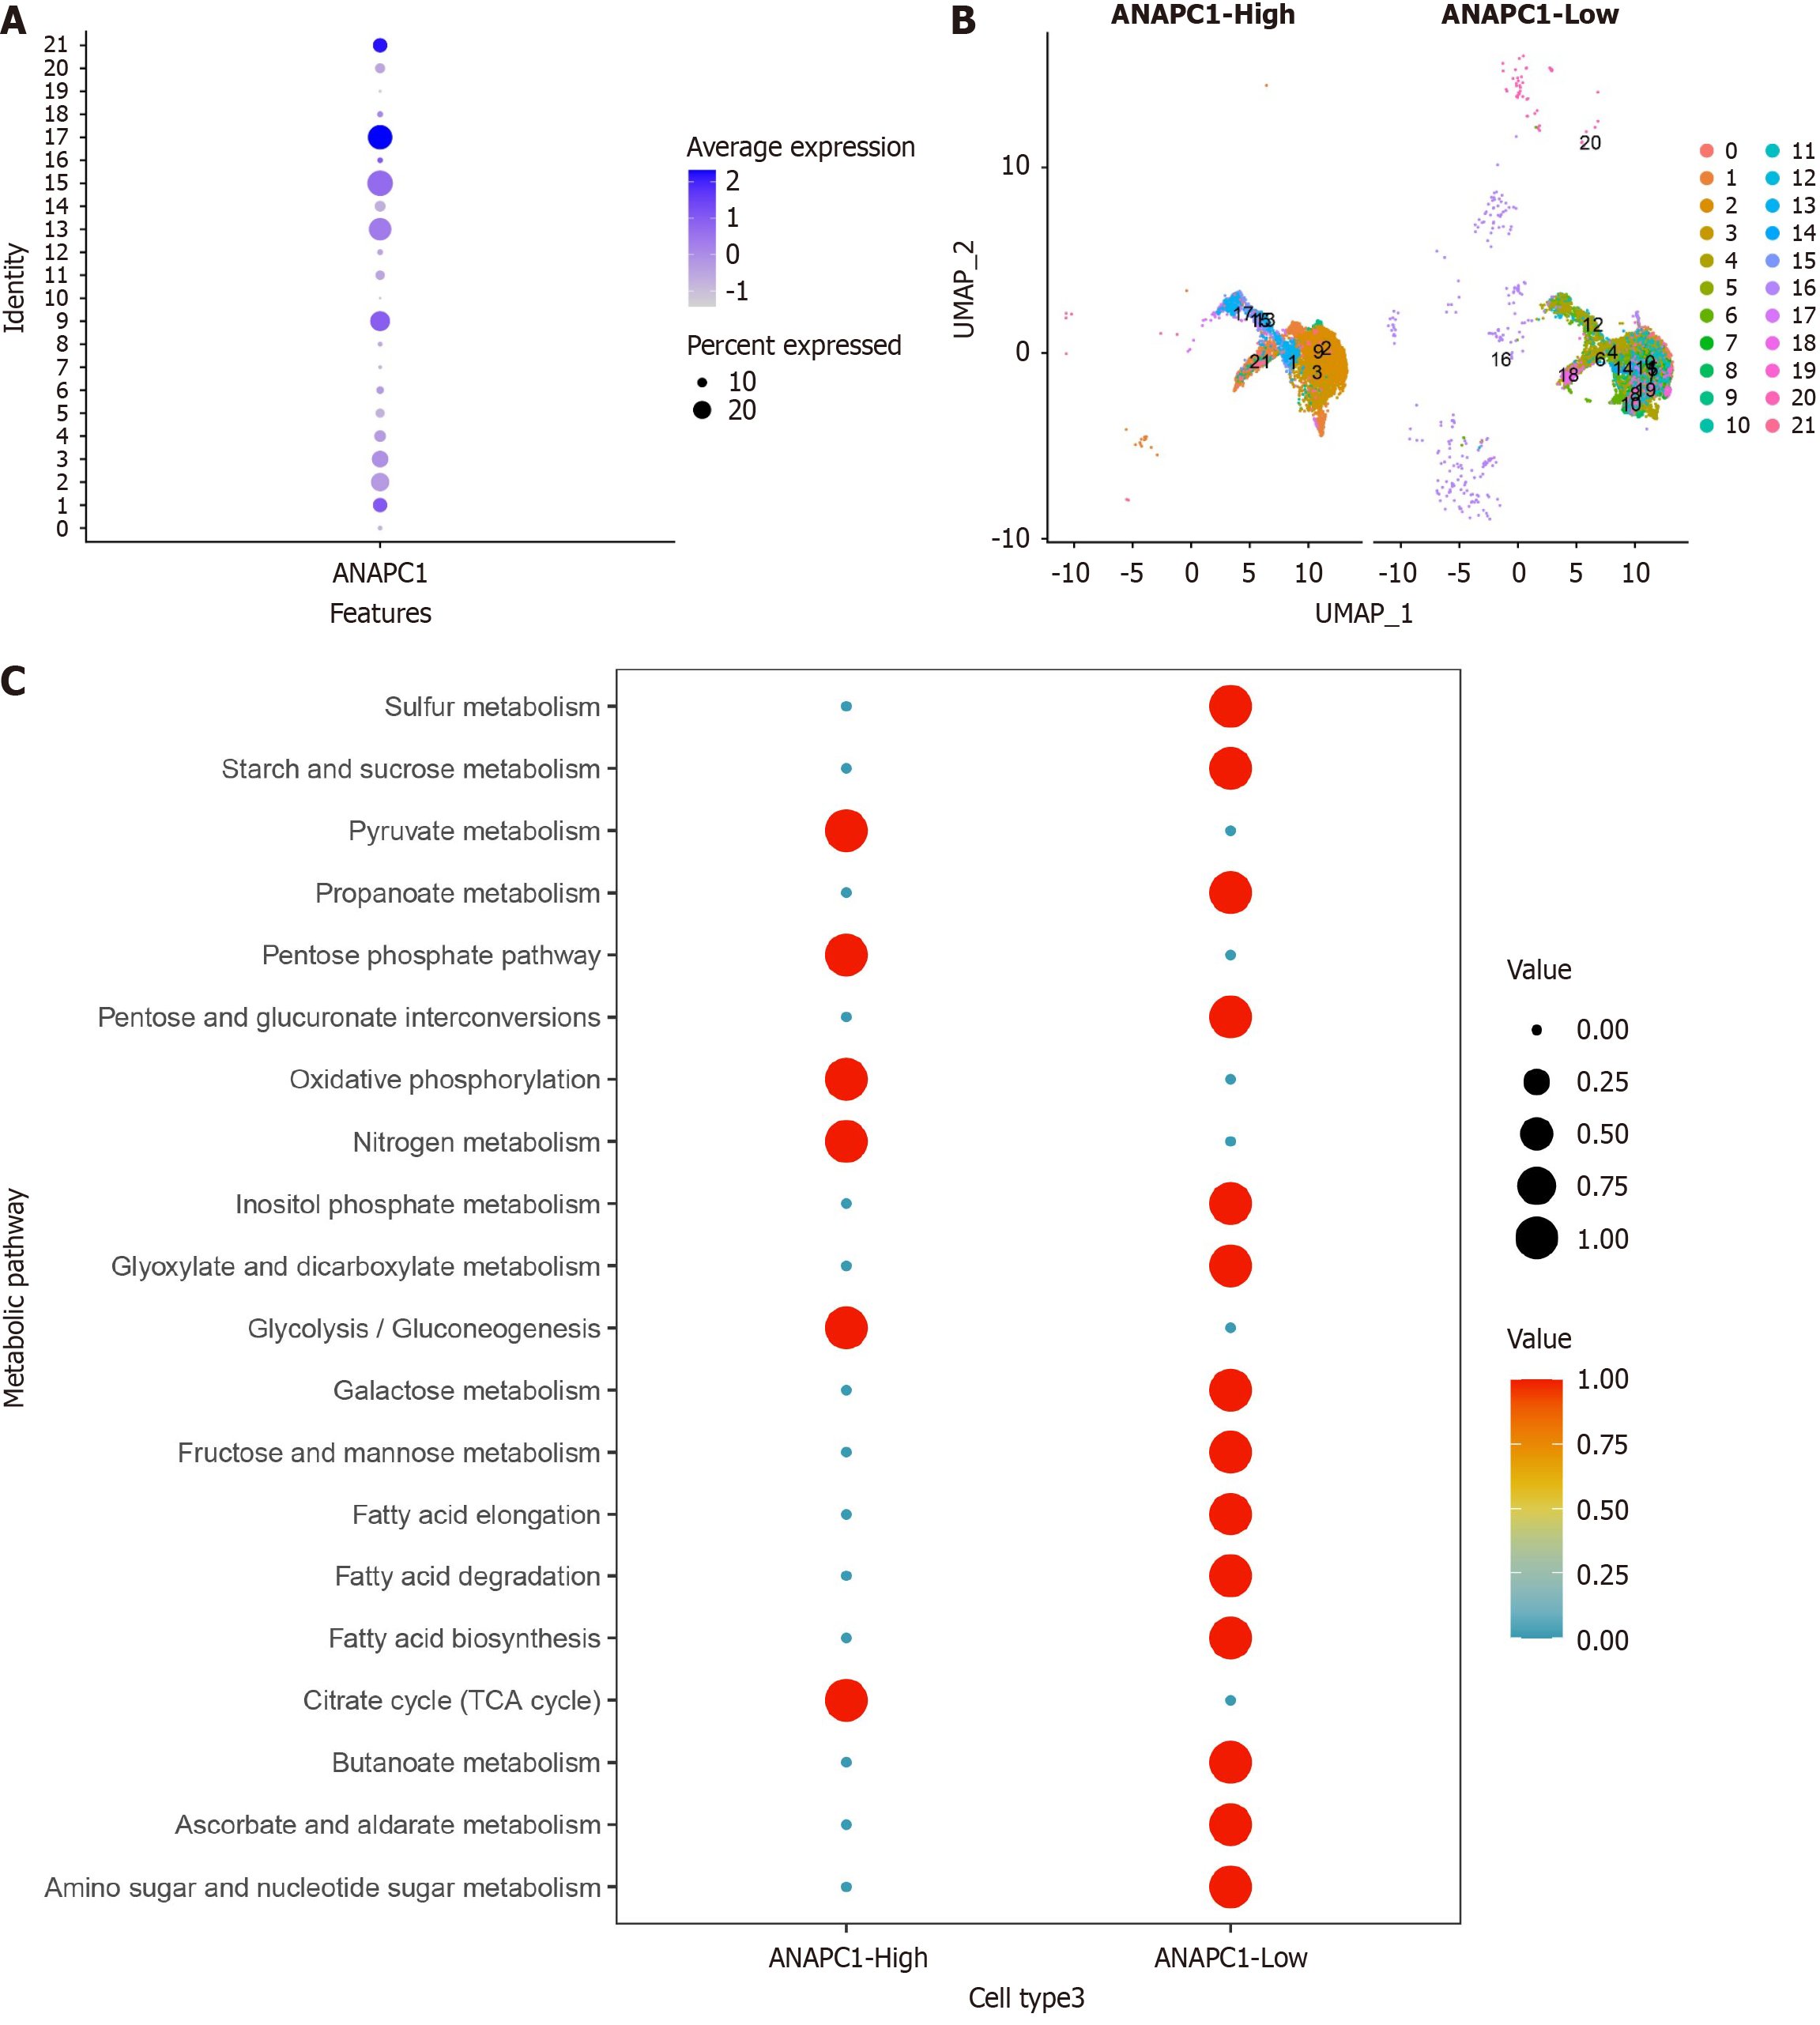
Figure 8 Analysis of ANAPC1 metabolic levels in single-cell RNA sequencing.
A: Expression levels of ANAPC1 in various clusters of malignant hepatocytes; B: Cluster distribution map of high and low ANAPC1 expression groups; C: Metabolic level analysis of high and low ANAPC1 expression groups. UMAP: Uniform manifold approximation and projection; TCA: Tricarboxylic acid cycle.
- Citation: Tang YX, Wu WZ, Zhou SS, Zeng DT, Zheng GC, He RQ, Qin DY, Huang WY, Chen JT, Dang YW, Tang YL, Chi BT, Zhan YT, Chen G. Exploring the potential function of high expression of ANAPC1 in regulating ubiquitination in hepatocellular carcinoma. World J Gastrointest Oncol 2025; 17(5): 103594
- URL: https://www.wjgnet.com/1948-5204/full/v17/i5/103594.htm
- DOI: https://dx.doi.org/10.4251/wjgo.v17.i5.103594


