Copyright
©The Author(s) 2025.
World J Gastrointest Oncol. May 15, 2025; 17(5): 103594
Published online May 15, 2025. doi: 10.4251/wjgo.v17.i5.103594
Published online May 15, 2025. doi: 10.4251/wjgo.v17.i5.103594
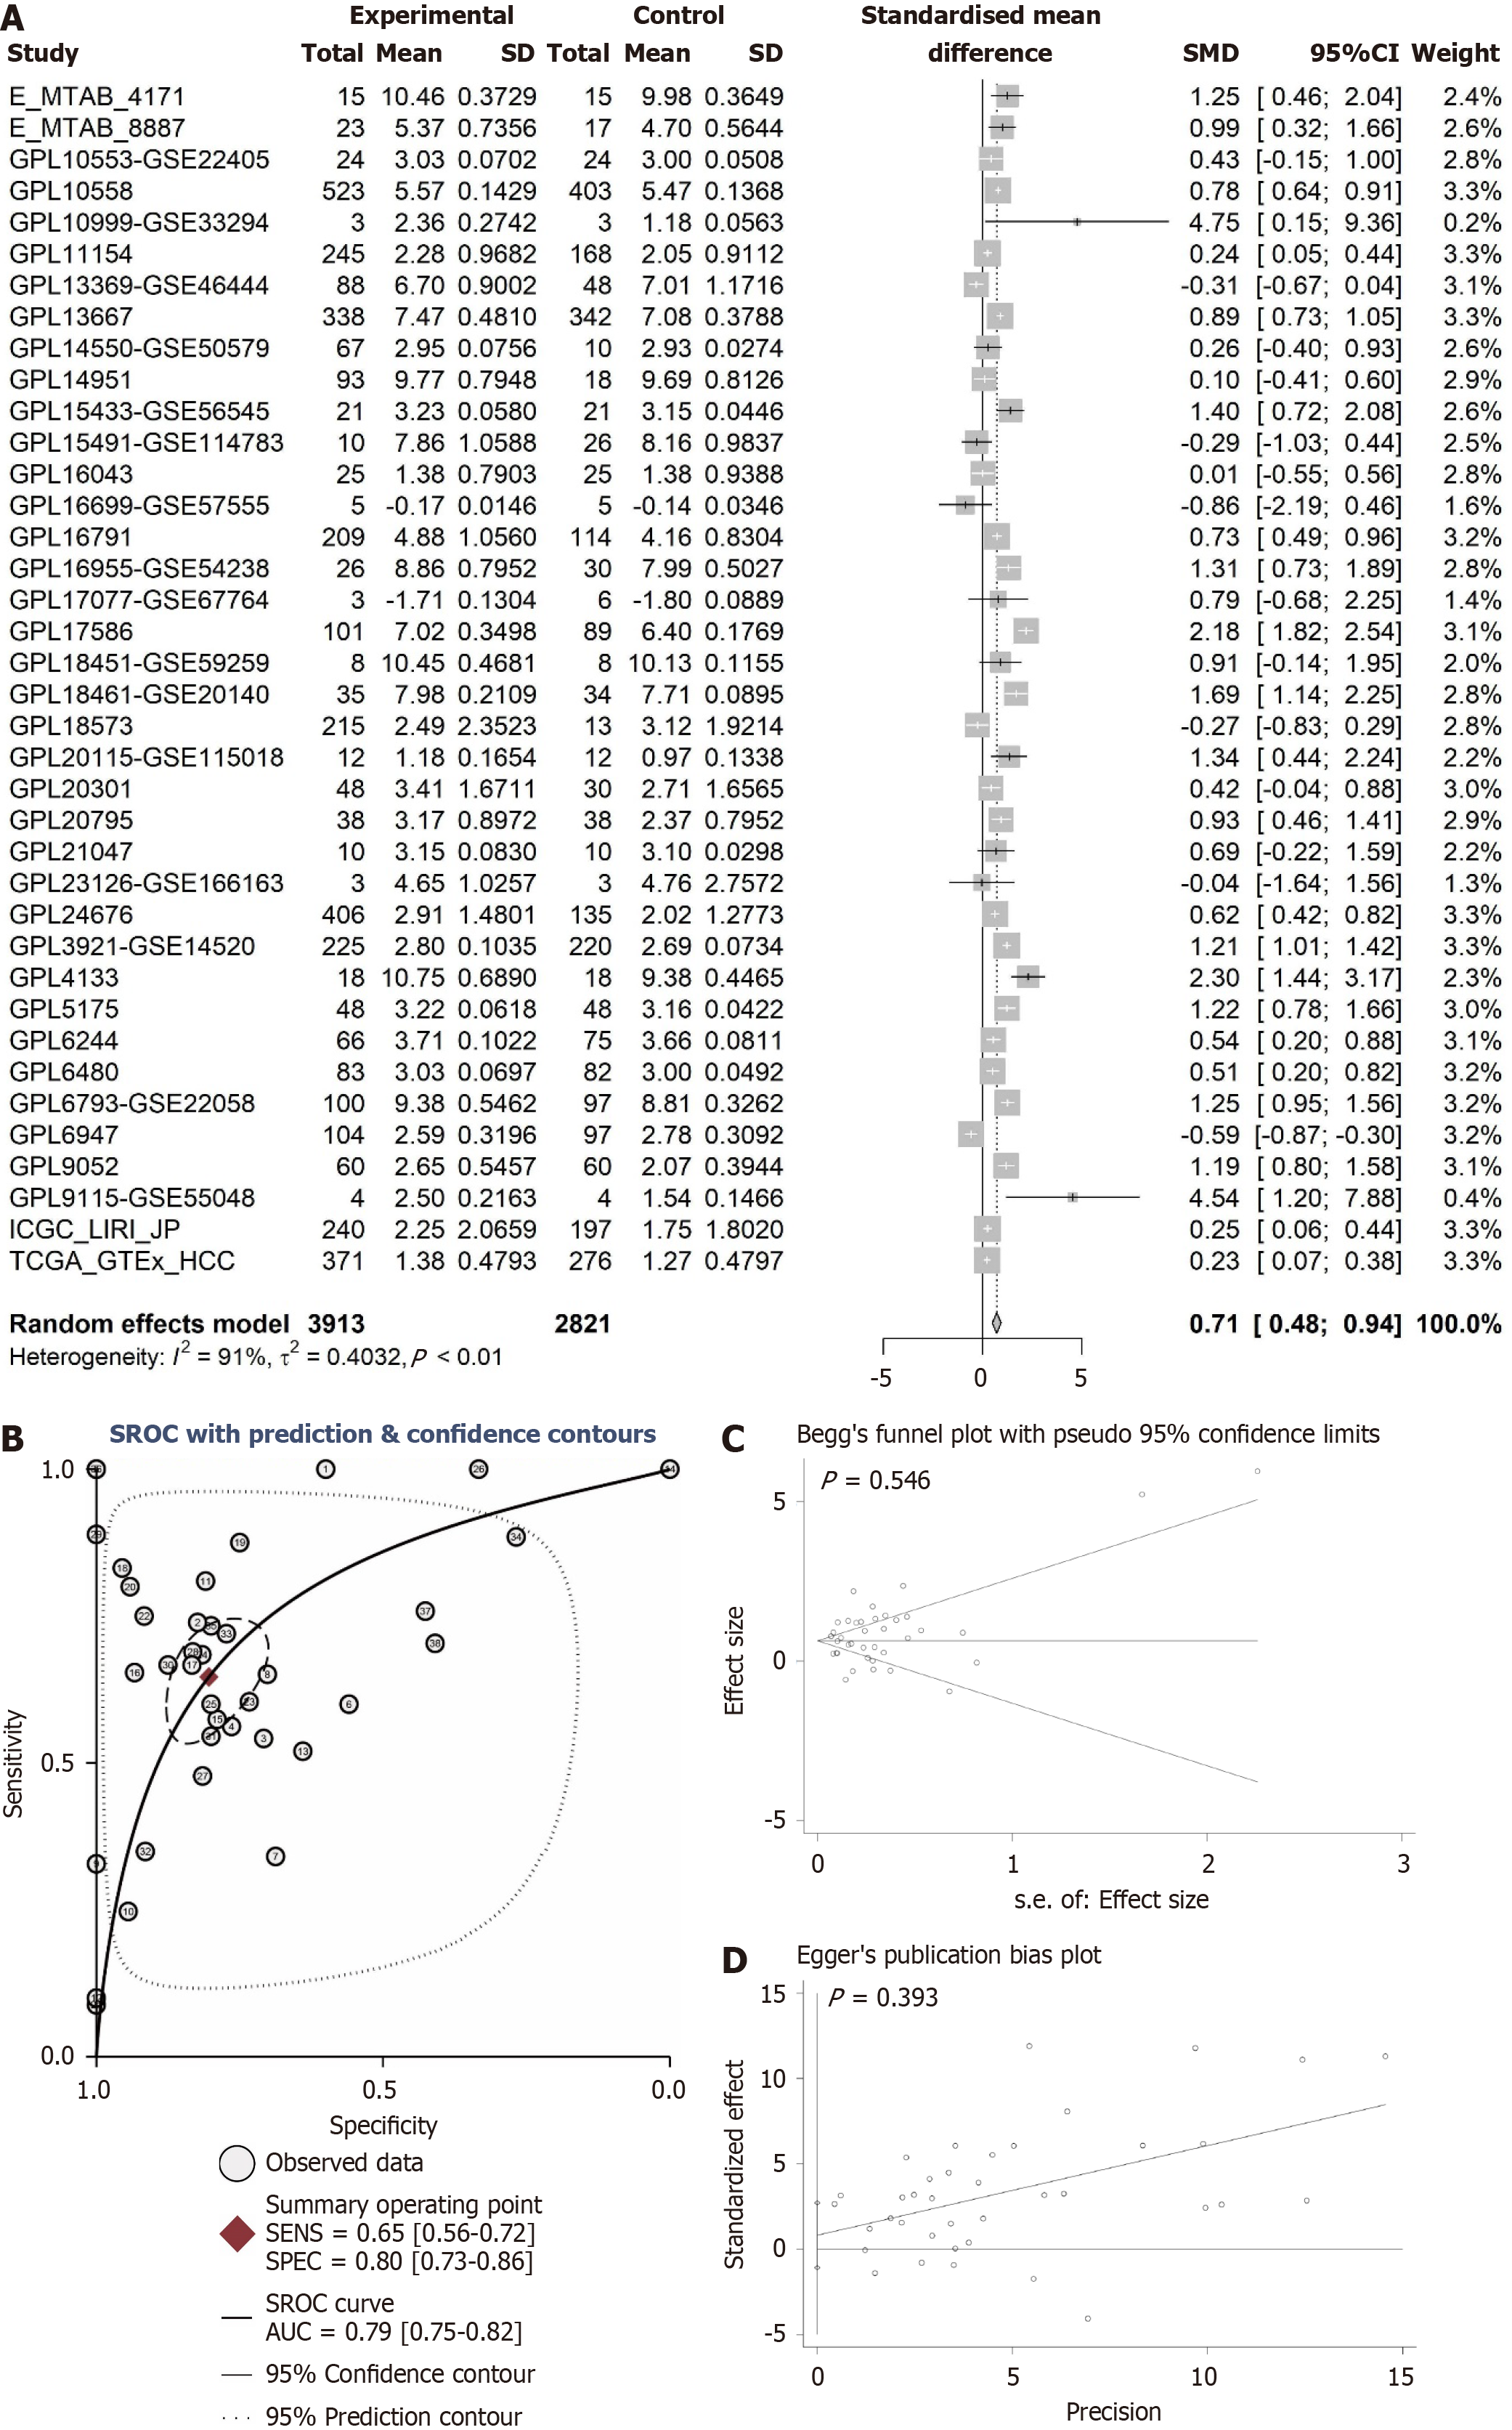
Figure 2 Comprehensive analysis of ANAPC1 messenger RNA expression in hepatocellular carcinoma.
A: Forest plot of integrated ANAPC1 messenger RNA (mRNA) expression from 38 platforms; B: Summary receiver operating characteristic curve; C: Begg’s test; D: Egger’s test. Calculated using the integration method, a higher area under the curve indicates a more pronounced difference in ANAPC1 mRNA expression between non-hepatocellular carcinoma and hepatocellular carcinoma tissues. CI: Confidence interval; MTAB: Matrix table; GPL: Gene platform; ICGC: International cancer genome consortium; TCGA: The cancer genome atlas; HCC: Hepatocellular carcinoma; SENS: Sensitivity; SPEC: Specificity; SROC: Synthetic receiver operating characteristic; AUC: Area under the curve.
- Citation: Tang YX, Wu WZ, Zhou SS, Zeng DT, Zheng GC, He RQ, Qin DY, Huang WY, Chen JT, Dang YW, Tang YL, Chi BT, Zhan YT, Chen G. Exploring the potential function of high expression of ANAPC1 in regulating ubiquitination in hepatocellular carcinoma. World J Gastrointest Oncol 2025; 17(5): 103594
- URL: https://www.wjgnet.com/1948-5204/full/v17/i5/103594.htm
- DOI: https://dx.doi.org/10.4251/wjgo.v17.i5.103594


