Copyright
©The Author(s) 2022.
World J Gastrointest Oncol. Dec 15, 2022; 14(12): 2313-2328
Published online Dec 15, 2022. doi: 10.4251/wjgo.v14.i12.2313
Published online Dec 15, 2022. doi: 10.4251/wjgo.v14.i12.2313
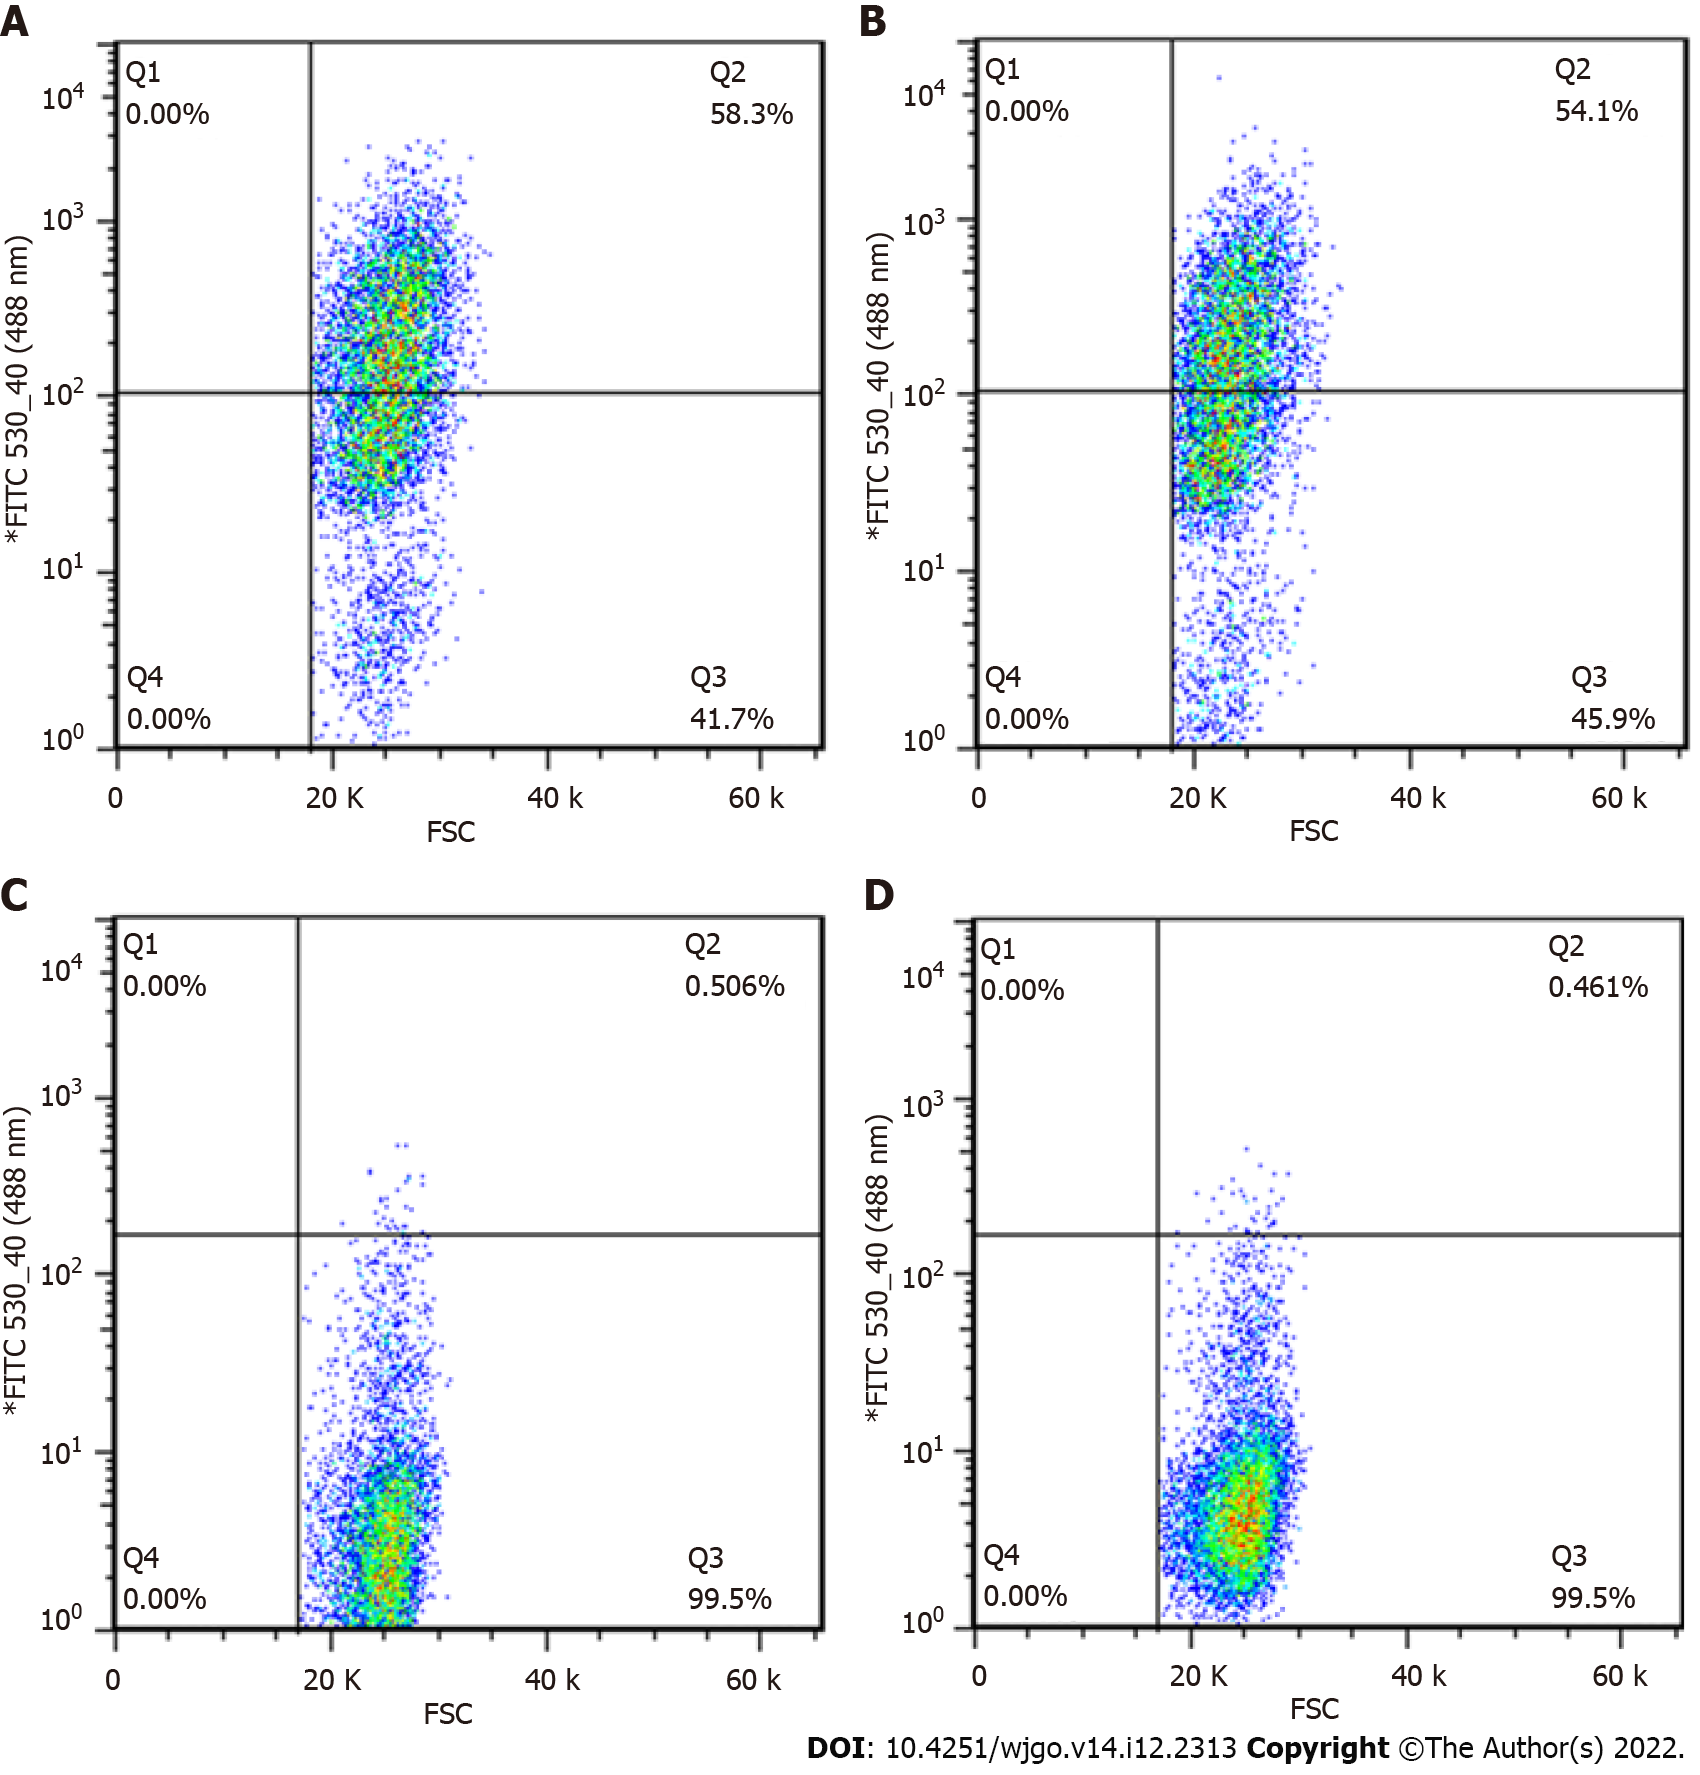
Figure 1 Sorting efficiency of cells.
A: Sorting efficiency of GV358-control cells (58.3%); B: Sorting efficiency of GV358-N-myc downstream regulated gene 1 (NDRG1) cells (54.1%); C: Sorting efficiency of pL-control cells (0.506%); D: Sorting efficiency of pL-NDRG1-knockout cells (0.461%).
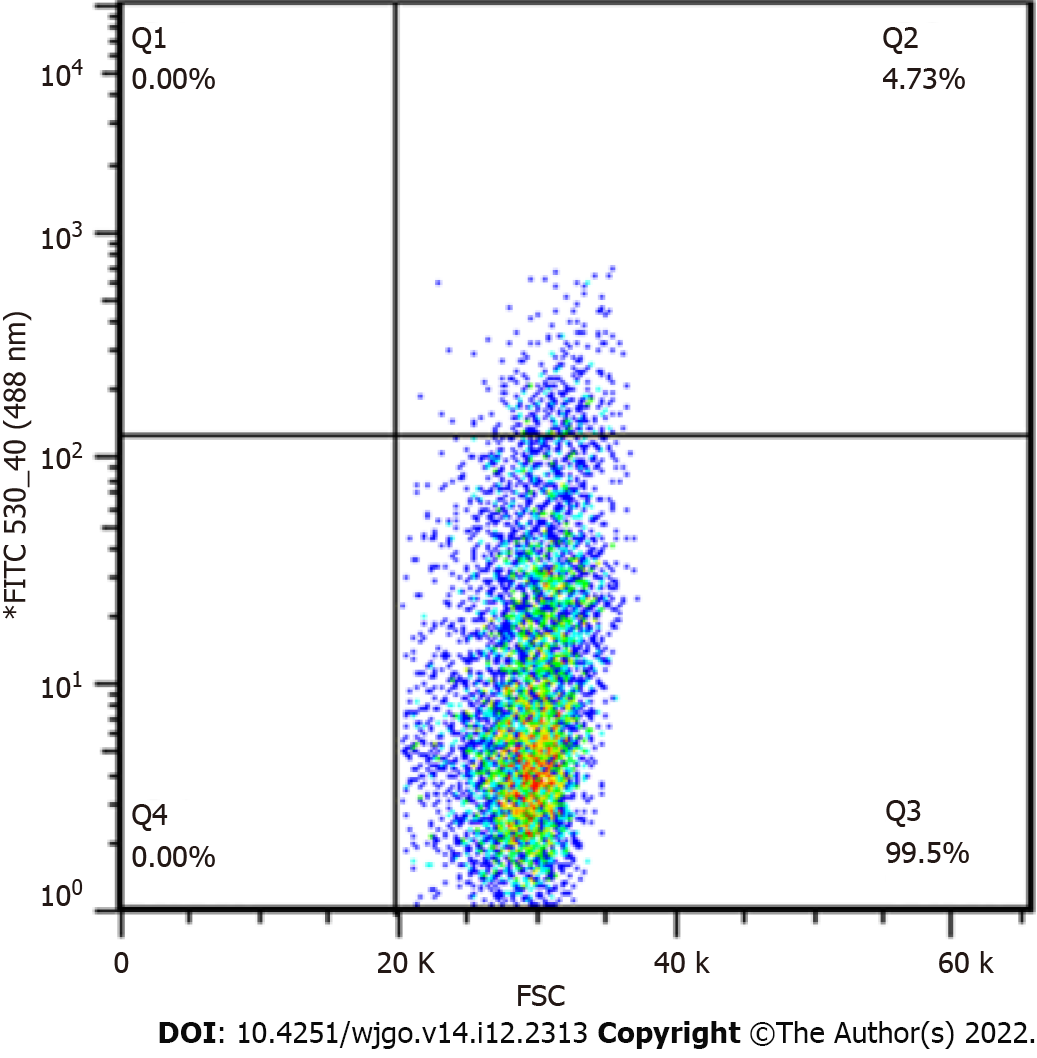
Figure 2 Sorting efficiency of monoclonal cells.
Sorting efficiency of pL-N-myc downstream regulated gene 1-knockout cells for monoclonal cells (4.73%).
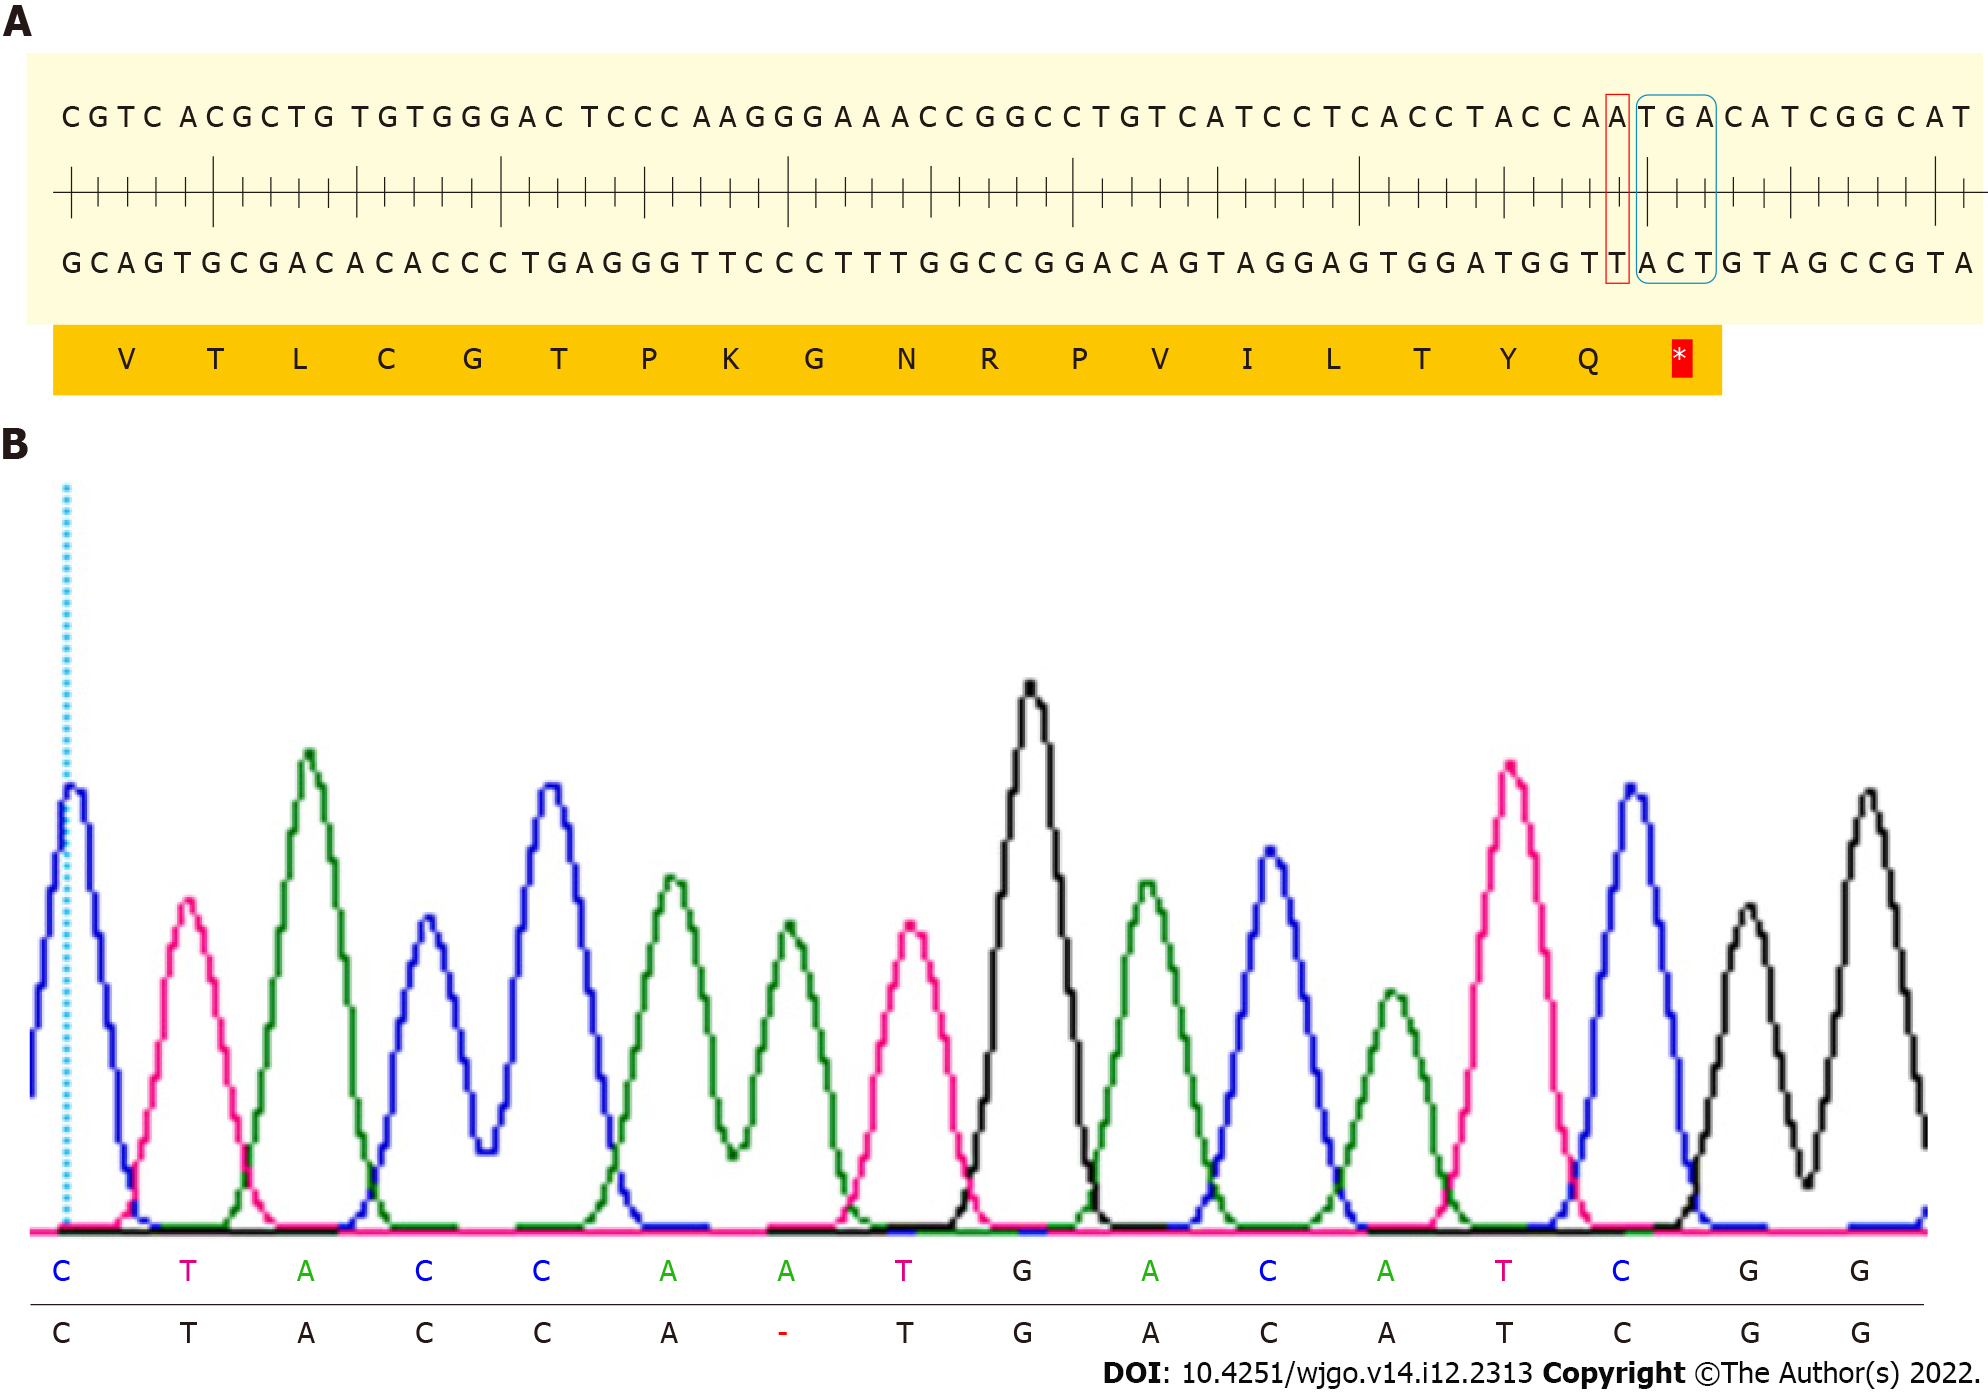
Figure 3 Sequencing results of N-myc downstream regulated gene 1 exon3 T-A clone of N-myc downstream regulated gene 1 knockout cell.
A: DNA strand nick was generated on the third exon of N-myc downstream regulated gene 1 (NDRG1), then an A base was inserted. An analysis of the NDRG1 sequence was performed using SnapGene software; B: Sequencing results of NDRG1 exon 3 of NDRG1 knockout cells.
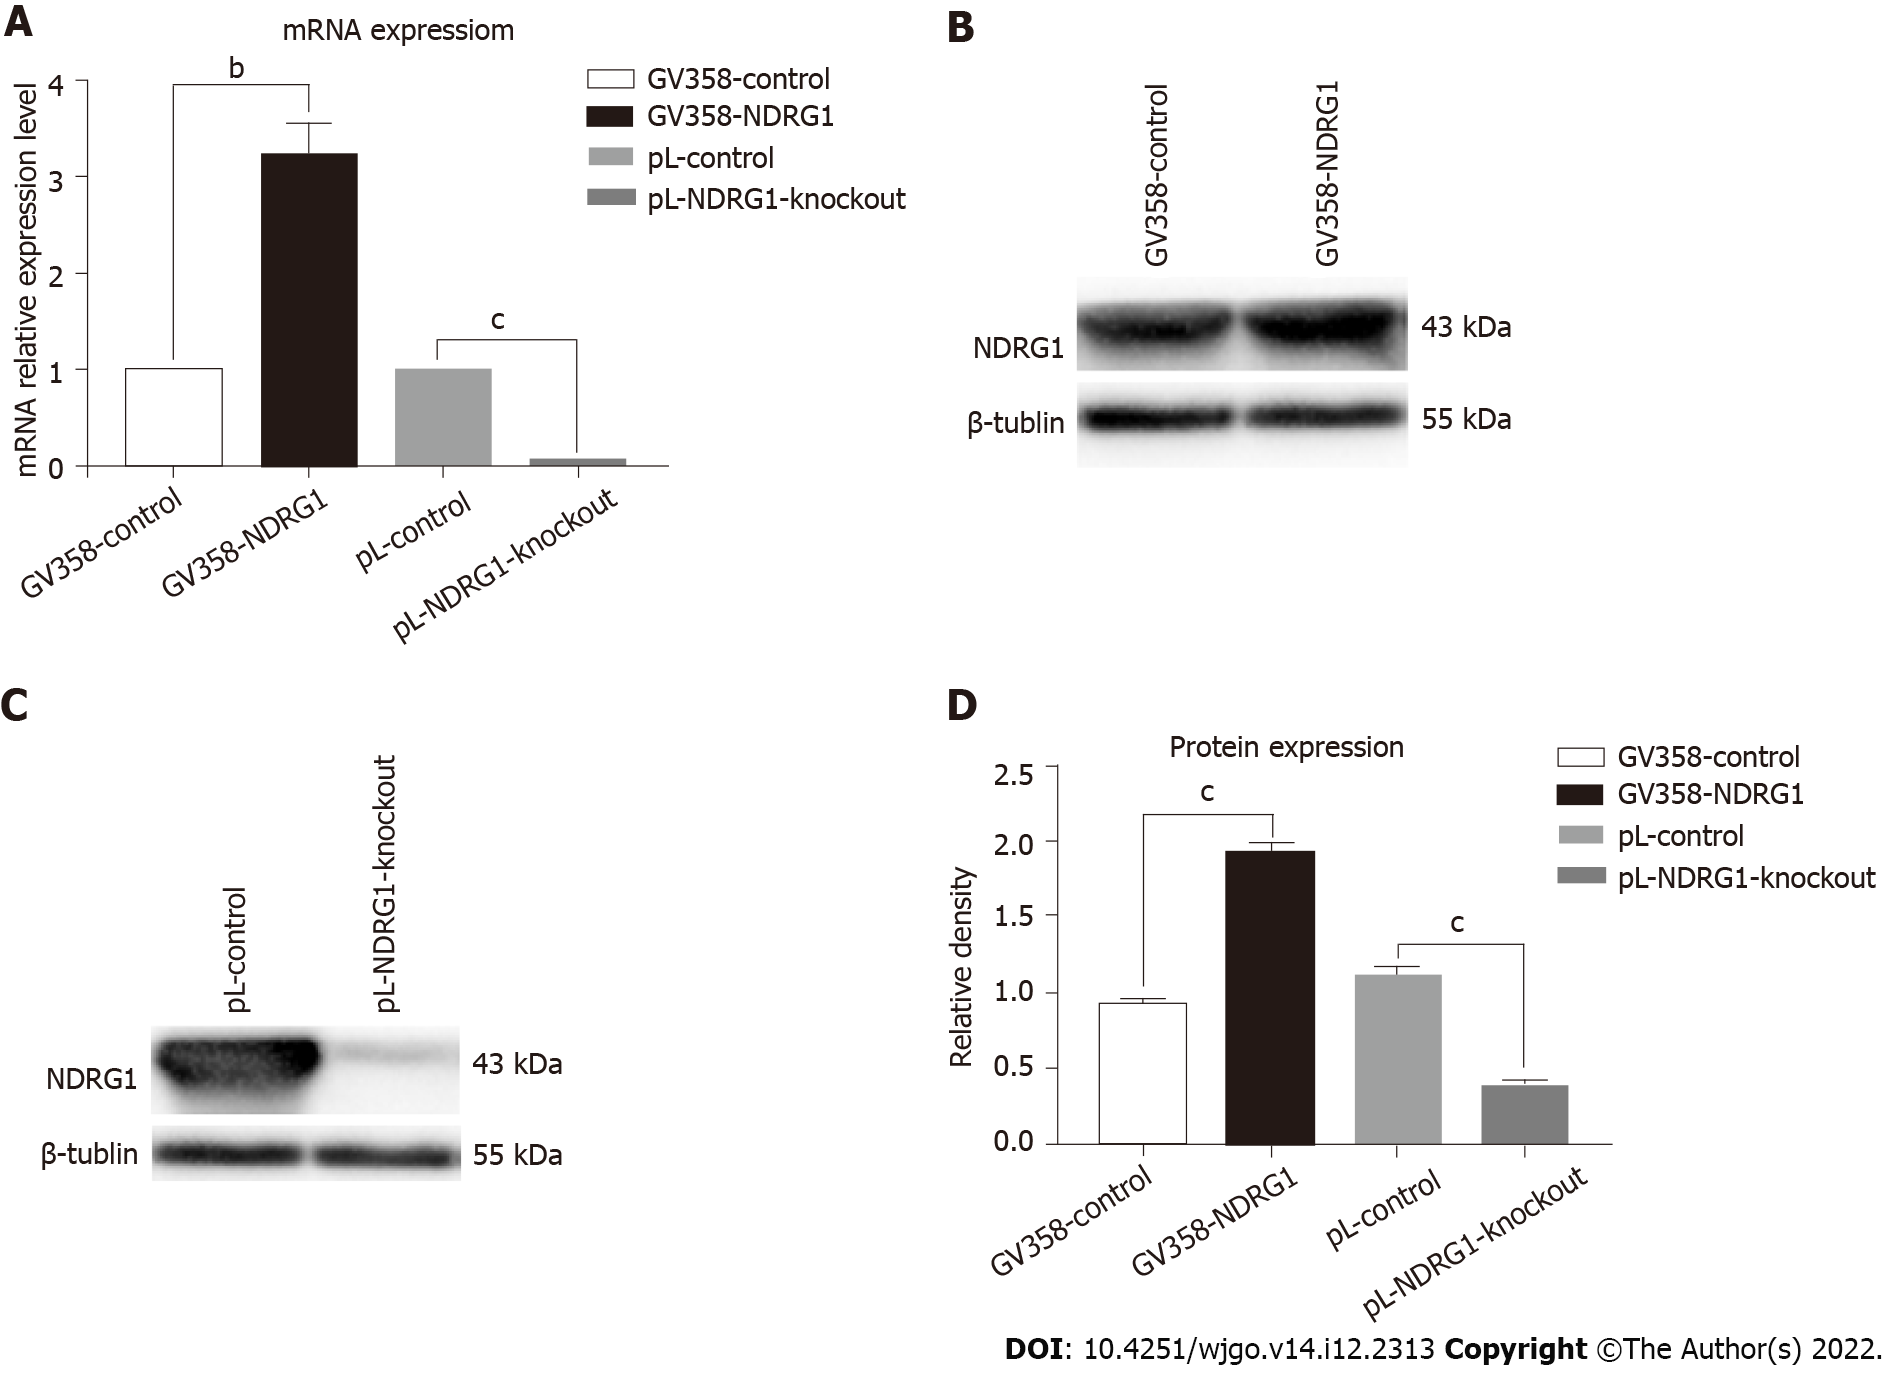
Figure 4 The results of quantitative polymerase chain reaction and western blotting after N-myc downstream regulated gene 1 over-expression and knockout.
A: The mRNA levels of N-myc downstream regulated gene 1 (NDRG1) were detected using real-time polymerase chain reaction. The relative levels of NDRG1 mRNA were calculated using the ΔΔCt method, and normalized to GAPDH expression; B-D: Representative western blot bands and statistical results of NDRG1 protein expression normalized to β-tubulin. aP < 0.05, bP < 0.01, cP < 0.001 vs control cells. Experiments were repeated three times.
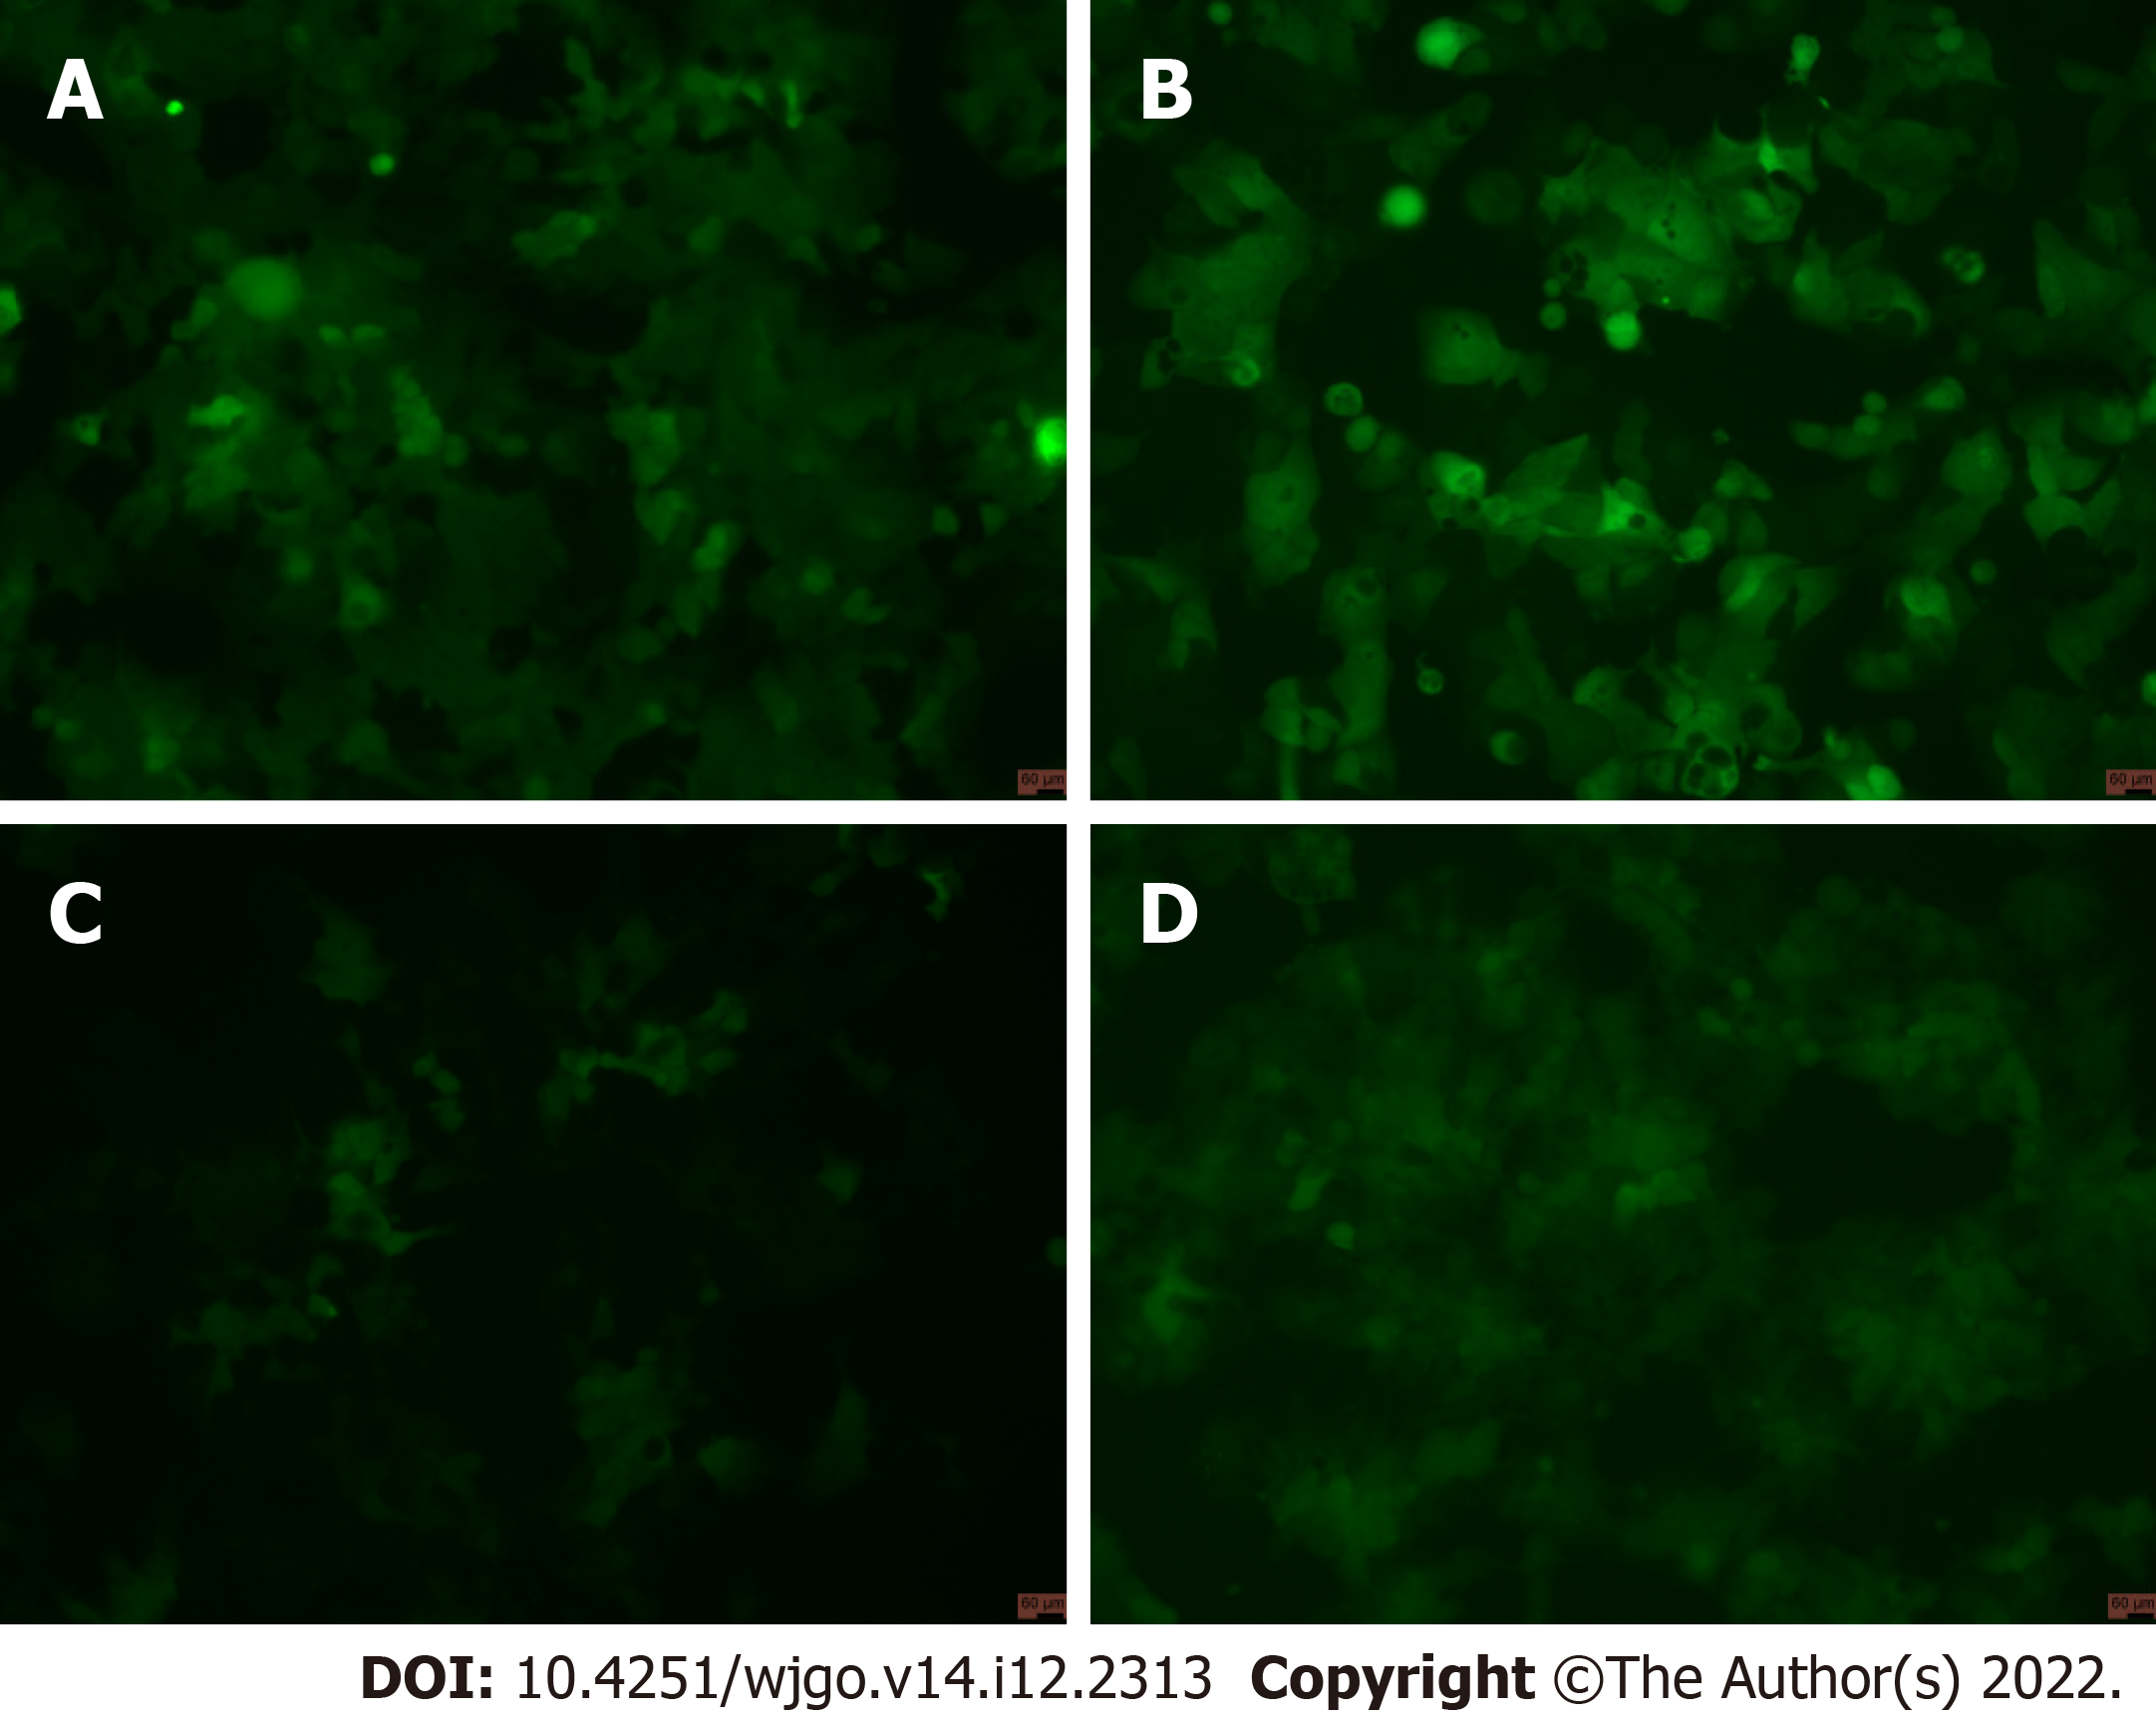
Figure 5 Cells under a fluorescence microscope.
A: GV358-Control cells (Scale bar: 60 μm); B: GV358-N-myc downstream regulated gene 1 (NDRG1) cells (Scale bar: 60 μm); C: pL-control cells (Scale bar: 60 μm); D: pL-NDRG1-knockout cells (Scale bar: 60 μm).
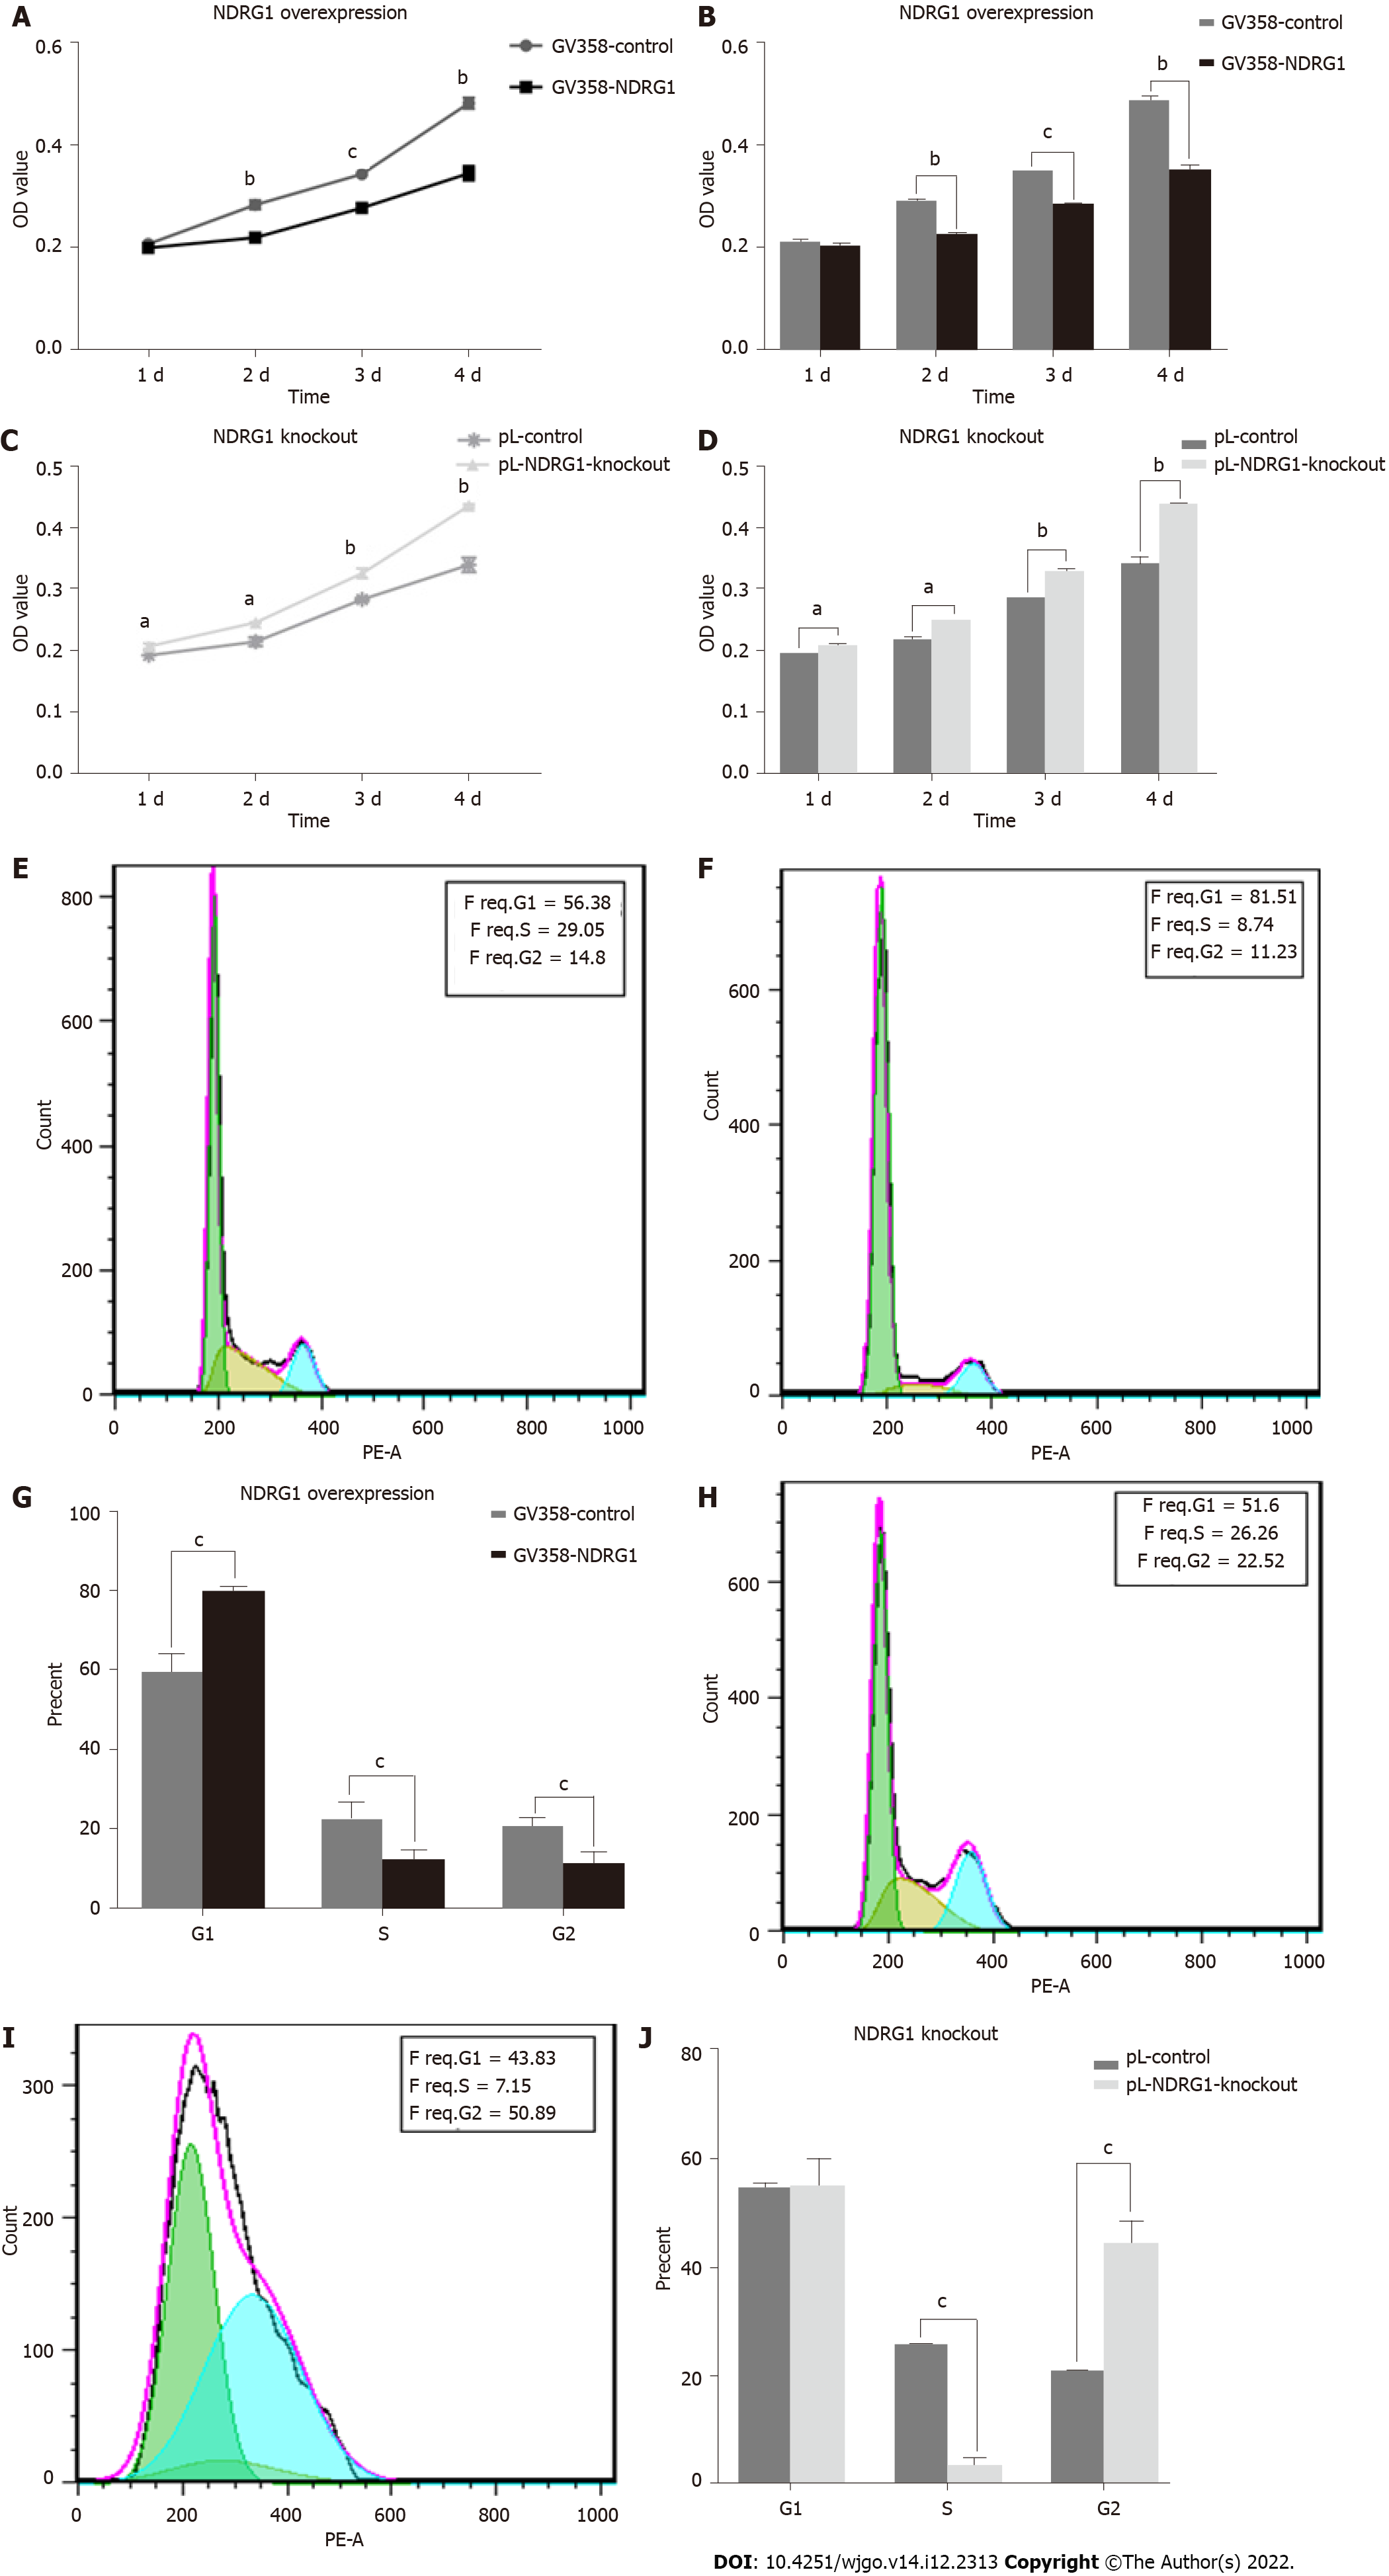
Figure 6 N-myc downstream regulated gene 1 inhibits the proliferation of Caco2 cells.
Cell viability was measured using the cell counting kit-8 assay. The cell cycle was measured using flow cytometry. A: Proliferation curves of Caco2 cells at 24 h, 48 h, 72 h and 96 h after N-myc downstream regulated gene 1 (NDRG1) over-expression; B: Statistical histogram of proliferation activity of Caco2 cells at 24 h, 48 h, 72 h and 96 h after NDRG1 over-expression; C: Proliferation curves of Caco2 cells at 24 h, 48 h, 72 h and 96 h after NDRG1 knockout; D: Statistical histogram of proliferation activity of Caco2 cells at 24 h, 48 h, 72 h and 96 h after NDRG1 knockout; E: Cell cycle diagram of GV358-control group; F: Cell cycle diagram of GV358-NDRG1-over-expression group; G: Statistical histogram of proportions of G1, S, and G2 cells after NDRG1 over-expression; H: Cell cycle diagram of pL-control group; I: Cell cycle diagram of pL-NDRG1-knockout group; J: Statistical histogram of proportions of G1, S, and G2 cells after NDRG1 knockout. aP < 0.05, bP < 0.01, cP < 0.001 vs control. Experiments were repeated three times.
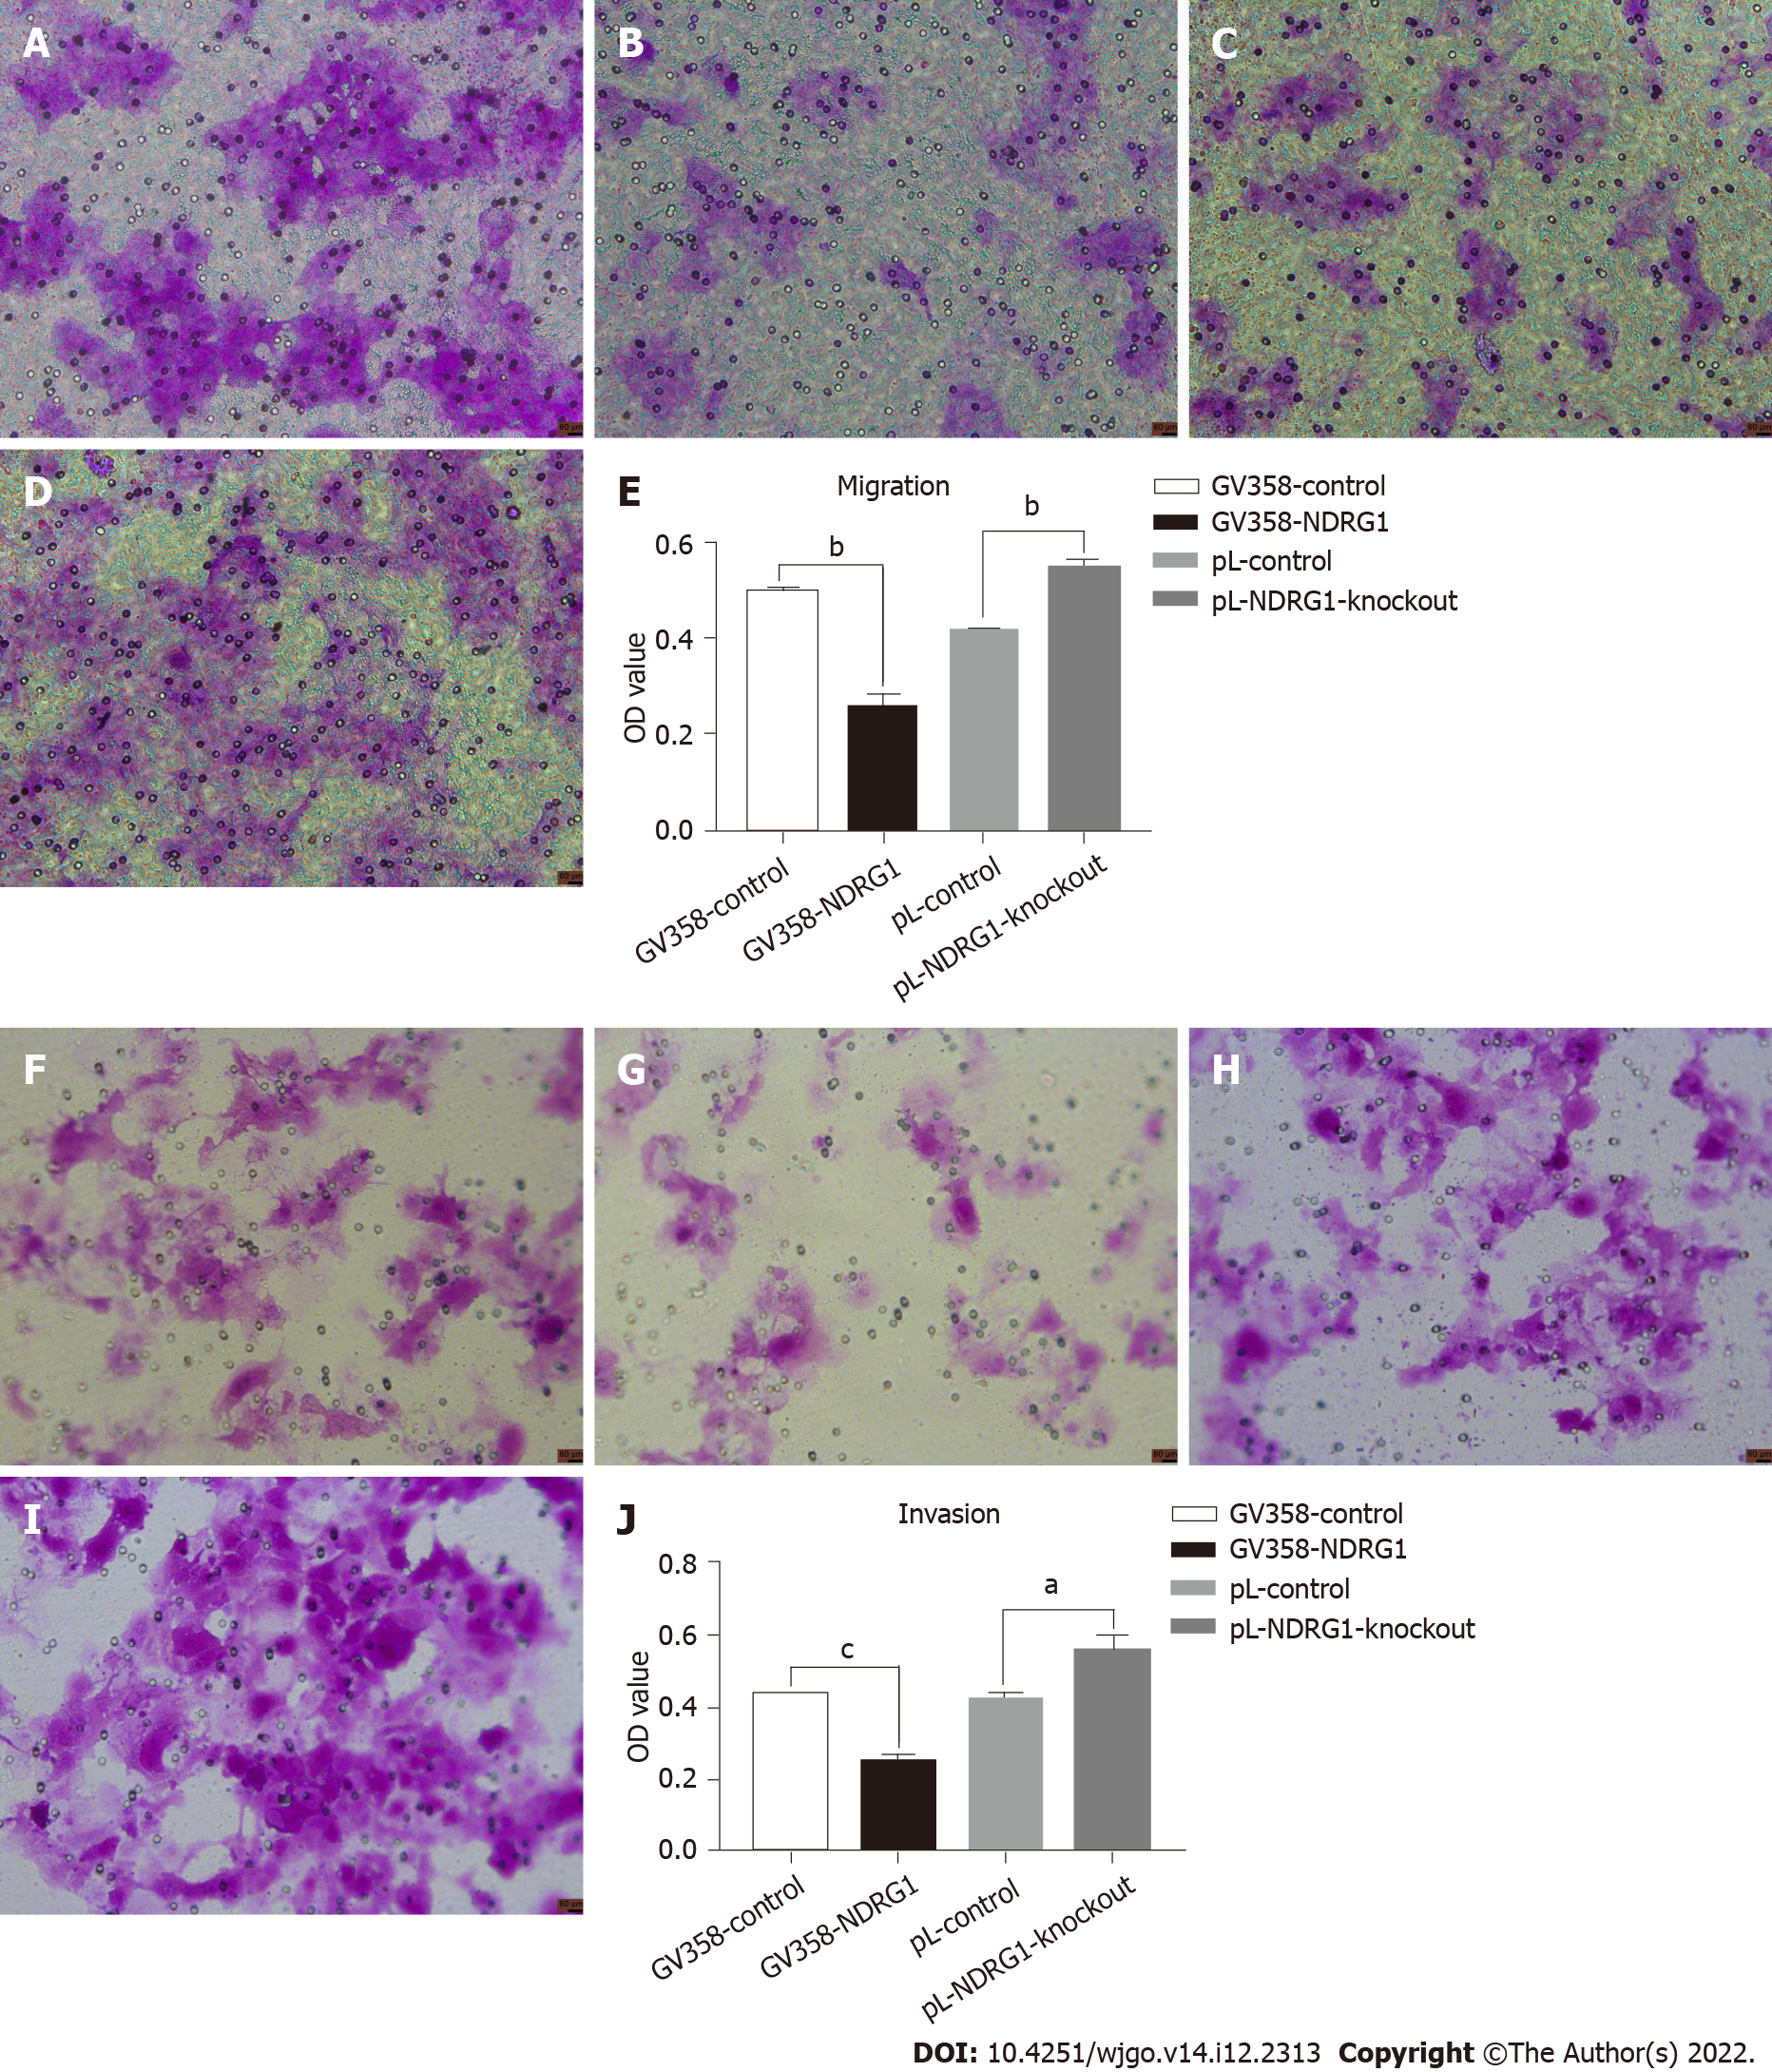
Figure 7 N-myc downstream regulated gene 1 inhibited migration and invasion of Caco2 cells.
24-well transwell chambers were used to detect migration and invasion. Cells were stained with crystal violet, eluted with 33% acetic acid, and the absorbance of the eluate was measured at 570 nm. The number of cells passing through the chamber at 48 h of the migration experiment (A-E). The number of cells passing through the chamber at 48 h of the invasion experiment (F-J). A: Number of cells passing through the chamber at 48 h of migration assay in GV358-control group (Scale bar: 60 μm); B: Number of cells passing through the chamber at 48 h of migration assay in GV358-N-myc downstream regulated gene 1 (NDRG1)-over-expression group (Scale bar: 60 μm); C: Number of cells passing through the chamber at 48 h of migration assay in pL-control group (Scale bar: 60 μm); D: Number of cells passing through the chamber at 48 h of migration assay in pL-NDRG1-knockout group (Scale bar: 60 μm); E: Statistical histograms of OD values eluted by crystal violet after NDRG1 over-expression and knockdown at 48h of migration assay; F: Number of cells passing through the chamber at 48 h of invasion assay in GV358-control group (Scale bar: 60 μm); G: Number of cells passing through the chamber at 48 h of invasion assay in GV358-NDRG1-over-expression group (Scale bar: 60 μm); H: Number of cells passing through the chamber at 48 h of invasion assay in pL-control group (Scale bar: 60 μm); I: Number of cells passing through the chamber at 48 h of invasion assay in pL-NDRG1-knockout group (Scale bar: 60 μm); J: Statistical histograms of OD values eluted by crystal violet after NDRG1 over-expression and knockdown at 48h of invasion assay. aP < 0.05, bP < 0.01, cP < 0.001 vs control. Experiments were repeated three times.
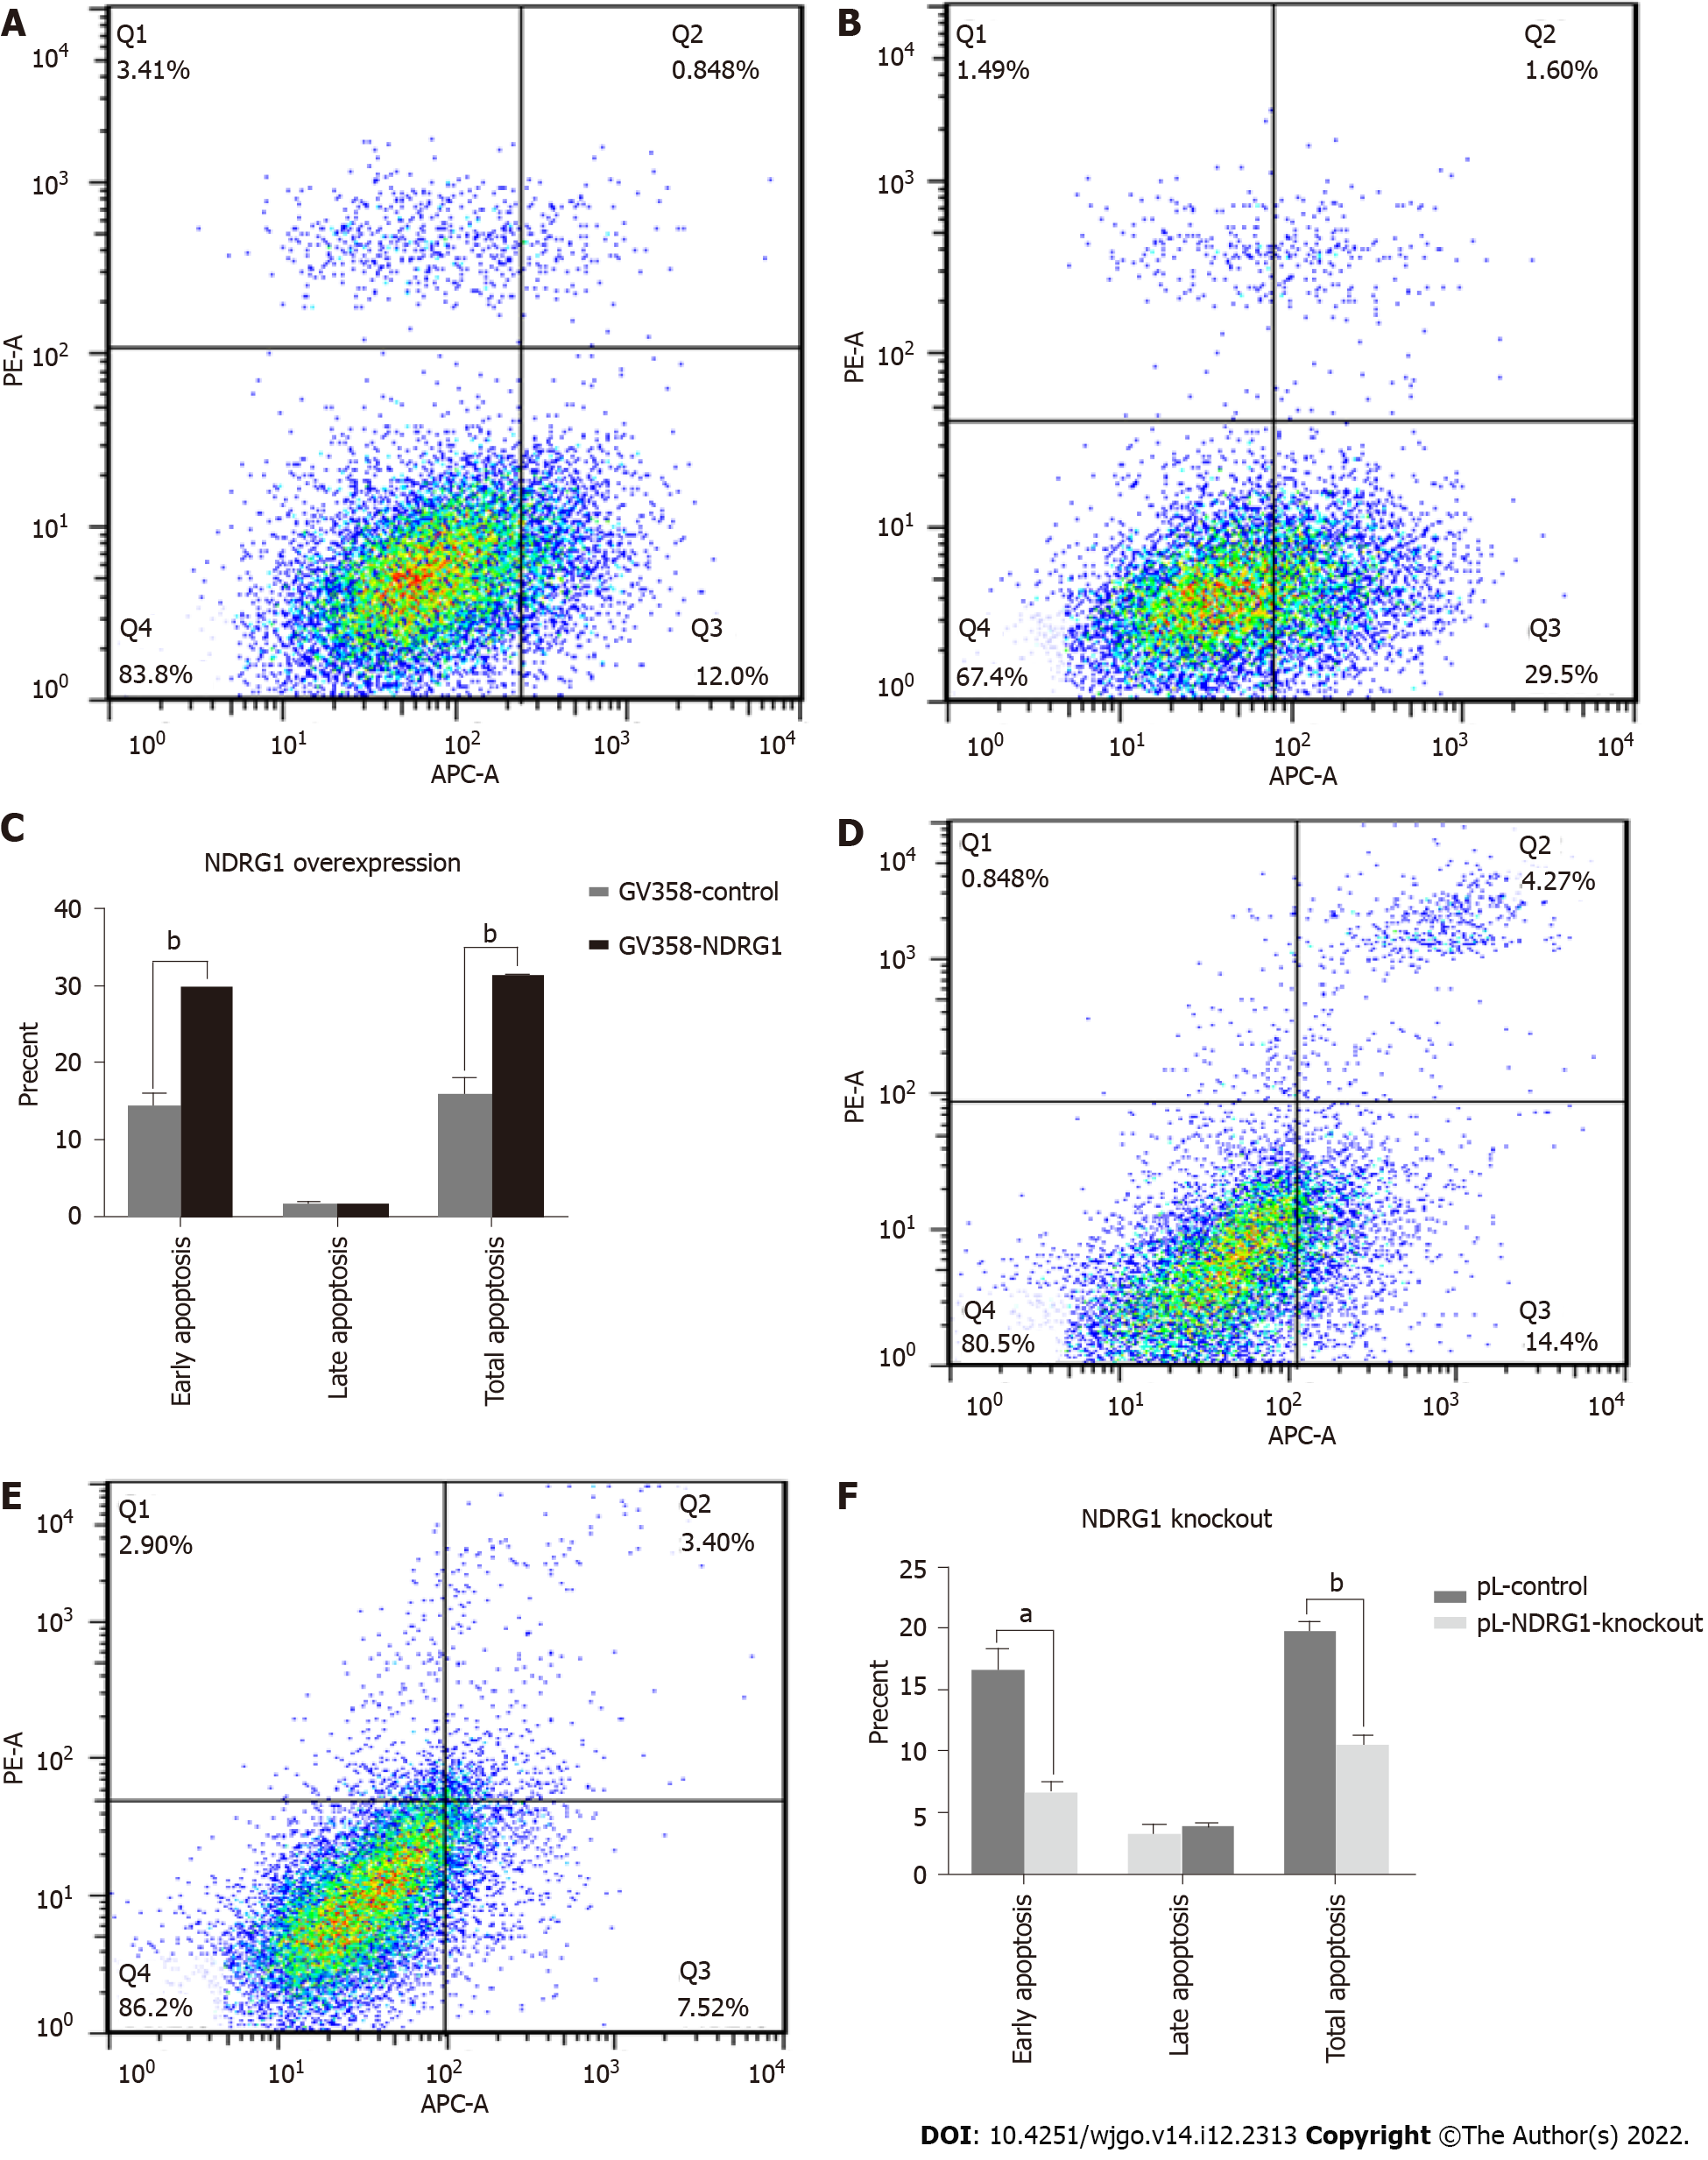
Figure 8 N-myc downstream regulated gene 1 promoted early apoptosis of Caco2 cells.
Annexin V-APC/propidium iodide (PI) staining by flow cytometry was performed to detect the apoptosis of cells. Early apoptosis (Annexin V-APC+/PI-), late apoptosis (Annexin V-APC+/PI+), and necrosis (Annexin V-APC-/PI+). A: Apoptosis rate of Caco2 cells in GV358-control group; B: Apoptosis rate of Caco2 cells in GV358-N-myc downstream regulated gene 1 (NDRG1)-over-expression group; C: Statistical histogram of apoptosis rate of Caco2 cells after NDRG1 over-expression; D: Apoptosis rate of Caco2 cells in pL-control group; E: Apoptosis rate of Caco2 cells in pL-NDRG1-knockout group; F: Statistical histogram of apoptosis rate of Caco2 cells after NDRG1 knockout. aP < 0.05, bP < 0.01, cP < 0.001 vs control. Experiments were repeated three times.
- Citation: He YX, Shen H, Ji YZ, Hua HR, Zhu Y, Zeng XF, Wang F, Wang KX. N-myc downstream regulated gene 1 inhibition of tumor progression in Caco2 cells. World J Gastrointest Oncol 2022; 14(12): 2313-2328
- URL: https://www.wjgnet.com/1948-5204/full/v14/i12/2313.htm
- DOI: https://dx.doi.org/10.4251/wjgo.v14.i12.2313


