Copyright
©The Author(s) 2022.
World J Gastrointest Oncol. Dec 15, 2022; 14(12): 2313-2328
Published online Dec 15, 2022. doi: 10.4251/wjgo.v14.i12.2313
Published online Dec 15, 2022. doi: 10.4251/wjgo.v14.i12.2313
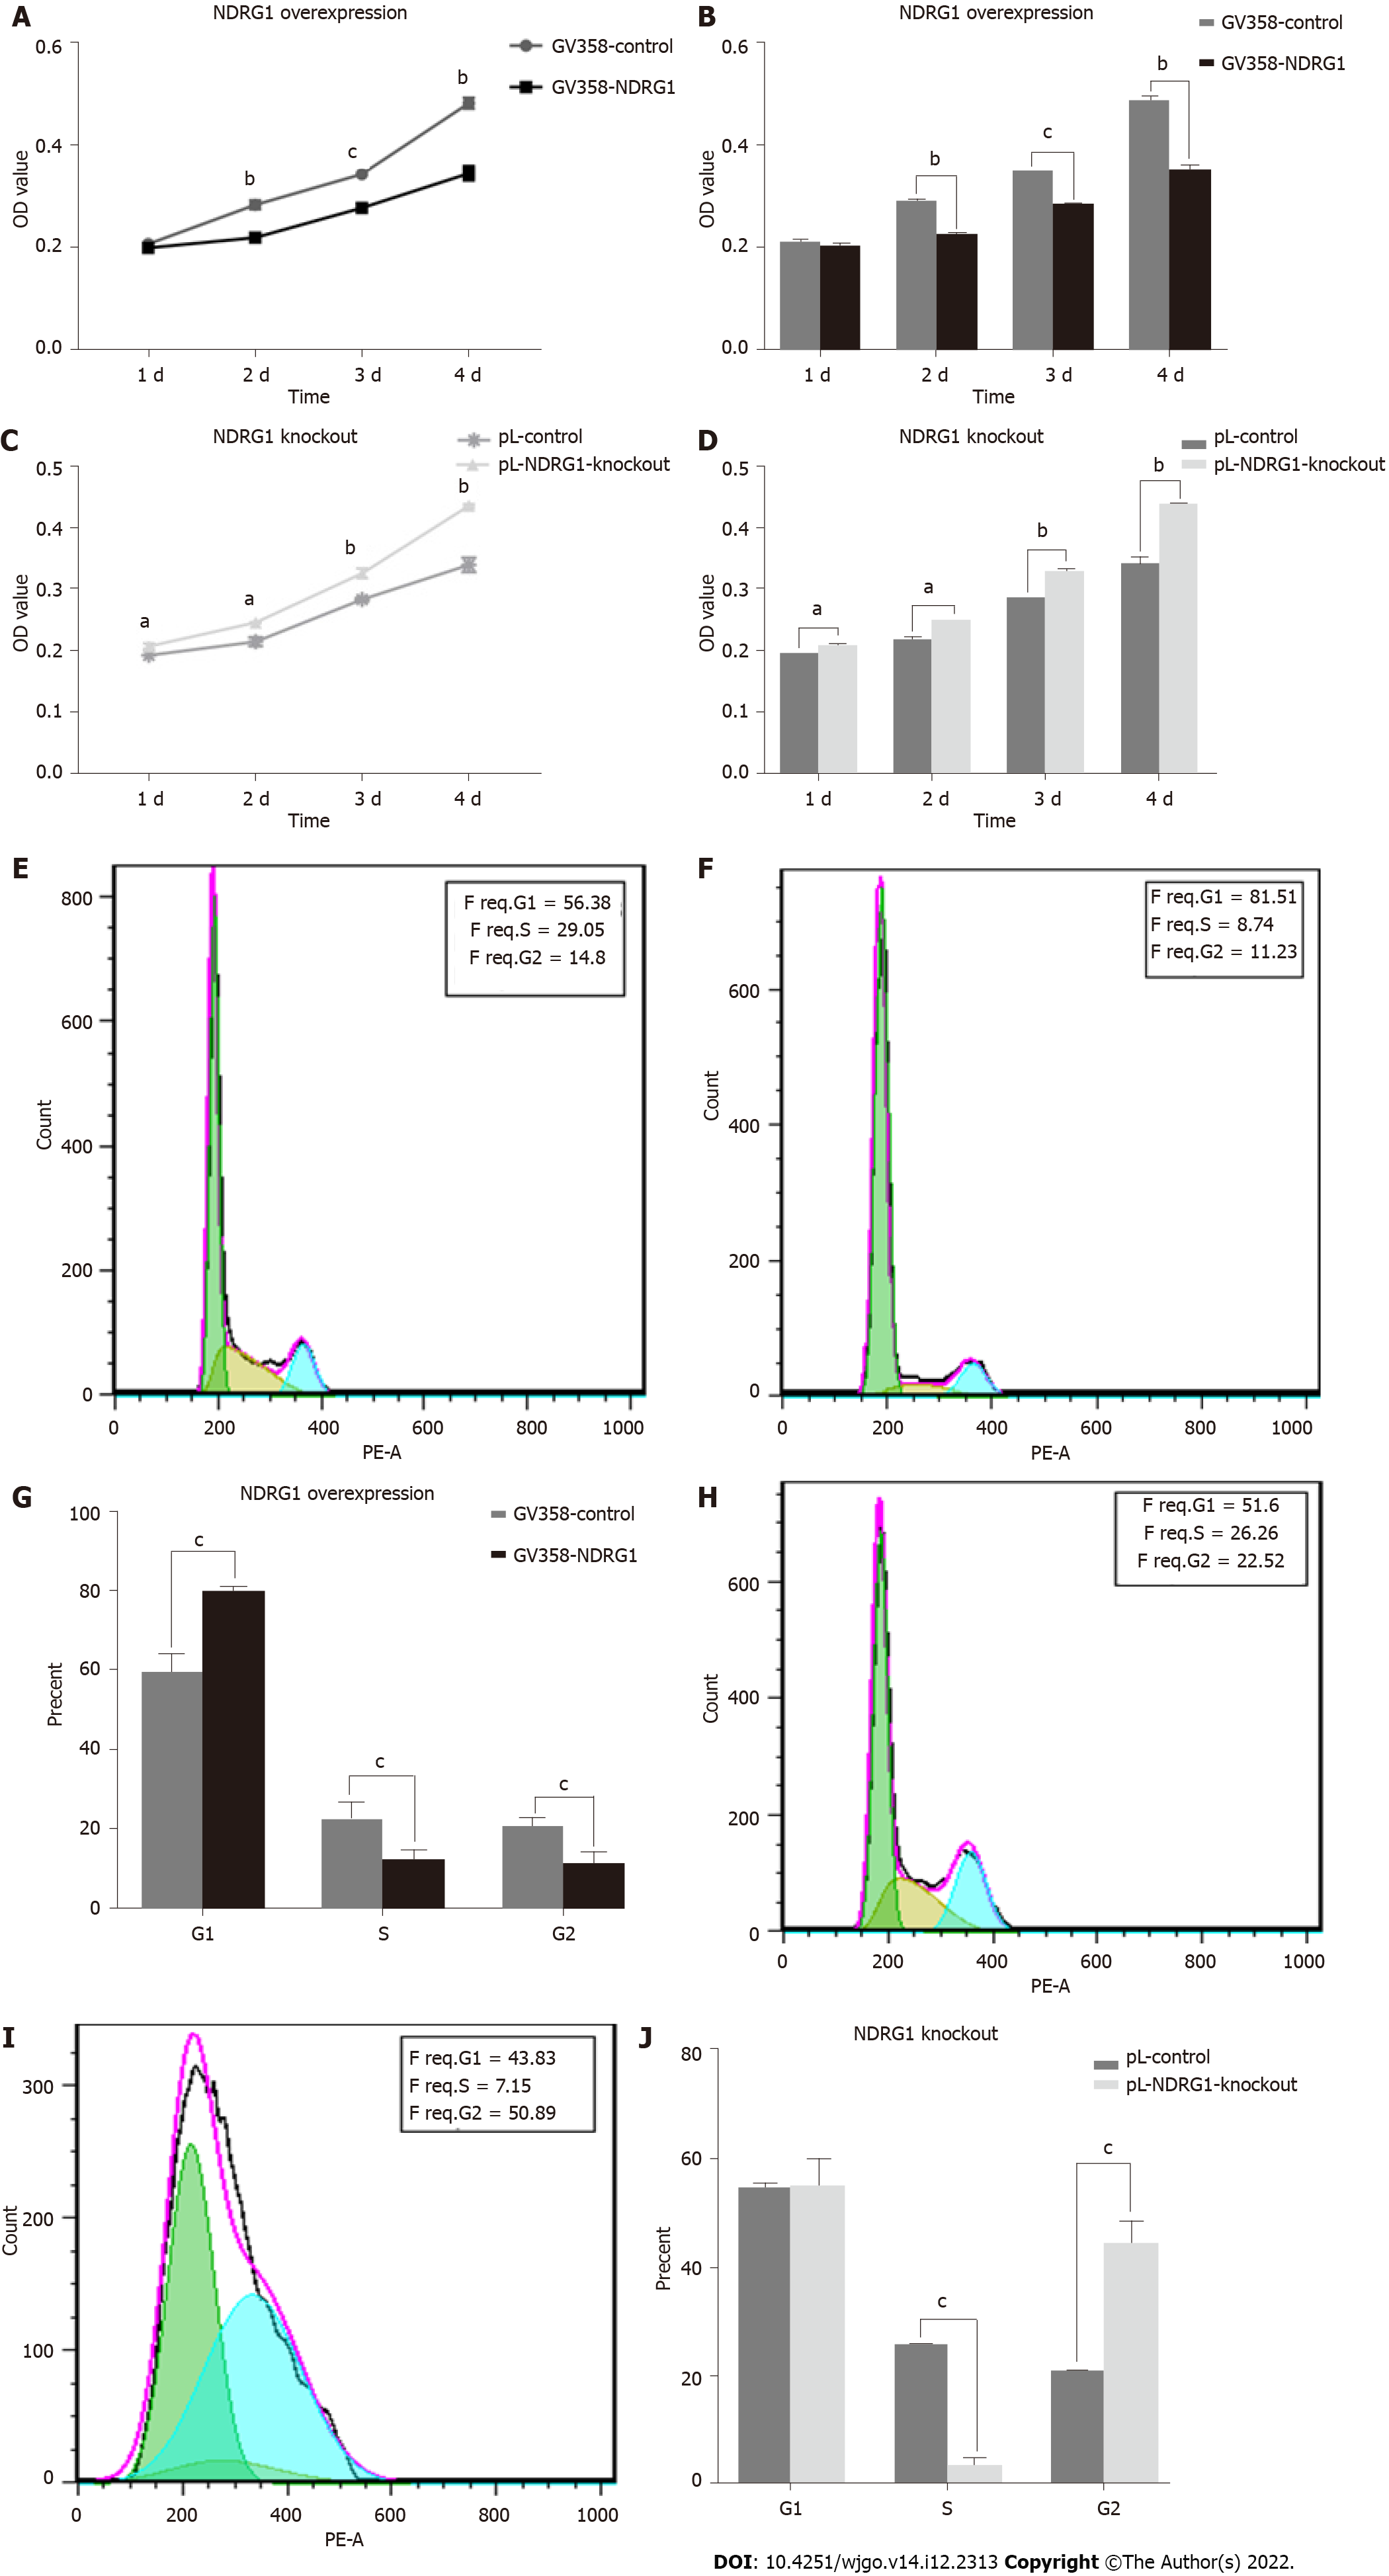
Figure 6 N-myc downstream regulated gene 1 inhibits the proliferation of Caco2 cells.
Cell viability was measured using the cell counting kit-8 assay. The cell cycle was measured using flow cytometry. A: Proliferation curves of Caco2 cells at 24 h, 48 h, 72 h and 96 h after N-myc downstream regulated gene 1 (NDRG1) over-expression; B: Statistical histogram of proliferation activity of Caco2 cells at 24 h, 48 h, 72 h and 96 h after NDRG1 over-expression; C: Proliferation curves of Caco2 cells at 24 h, 48 h, 72 h and 96 h after NDRG1 knockout; D: Statistical histogram of proliferation activity of Caco2 cells at 24 h, 48 h, 72 h and 96 h after NDRG1 knockout; E: Cell cycle diagram of GV358-control group; F: Cell cycle diagram of GV358-NDRG1-over-expression group; G: Statistical histogram of proportions of G1, S, and G2 cells after NDRG1 over-expression; H: Cell cycle diagram of pL-control group; I: Cell cycle diagram of pL-NDRG1-knockout group; J: Statistical histogram of proportions of G1, S, and G2 cells after NDRG1 knockout. aP < 0.05, bP < 0.01, cP < 0.001 vs control. Experiments were repeated three times.
- Citation: He YX, Shen H, Ji YZ, Hua HR, Zhu Y, Zeng XF, Wang F, Wang KX. N-myc downstream regulated gene 1 inhibition of tumor progression in Caco2 cells. World J Gastrointest Oncol 2022; 14(12): 2313-2328
- URL: https://www.wjgnet.com/1948-5204/full/v14/i12/2313.htm
- DOI: https://dx.doi.org/10.4251/wjgo.v14.i12.2313


