Copyright
©The Author(s) 2019.
World J Hepatol. Aug 27, 2019; 11(8): 619-637
Published online Aug 27, 2019. doi: 10.4254/wjh.v11.i8.619
Published online Aug 27, 2019. doi: 10.4254/wjh.v11.i8.619
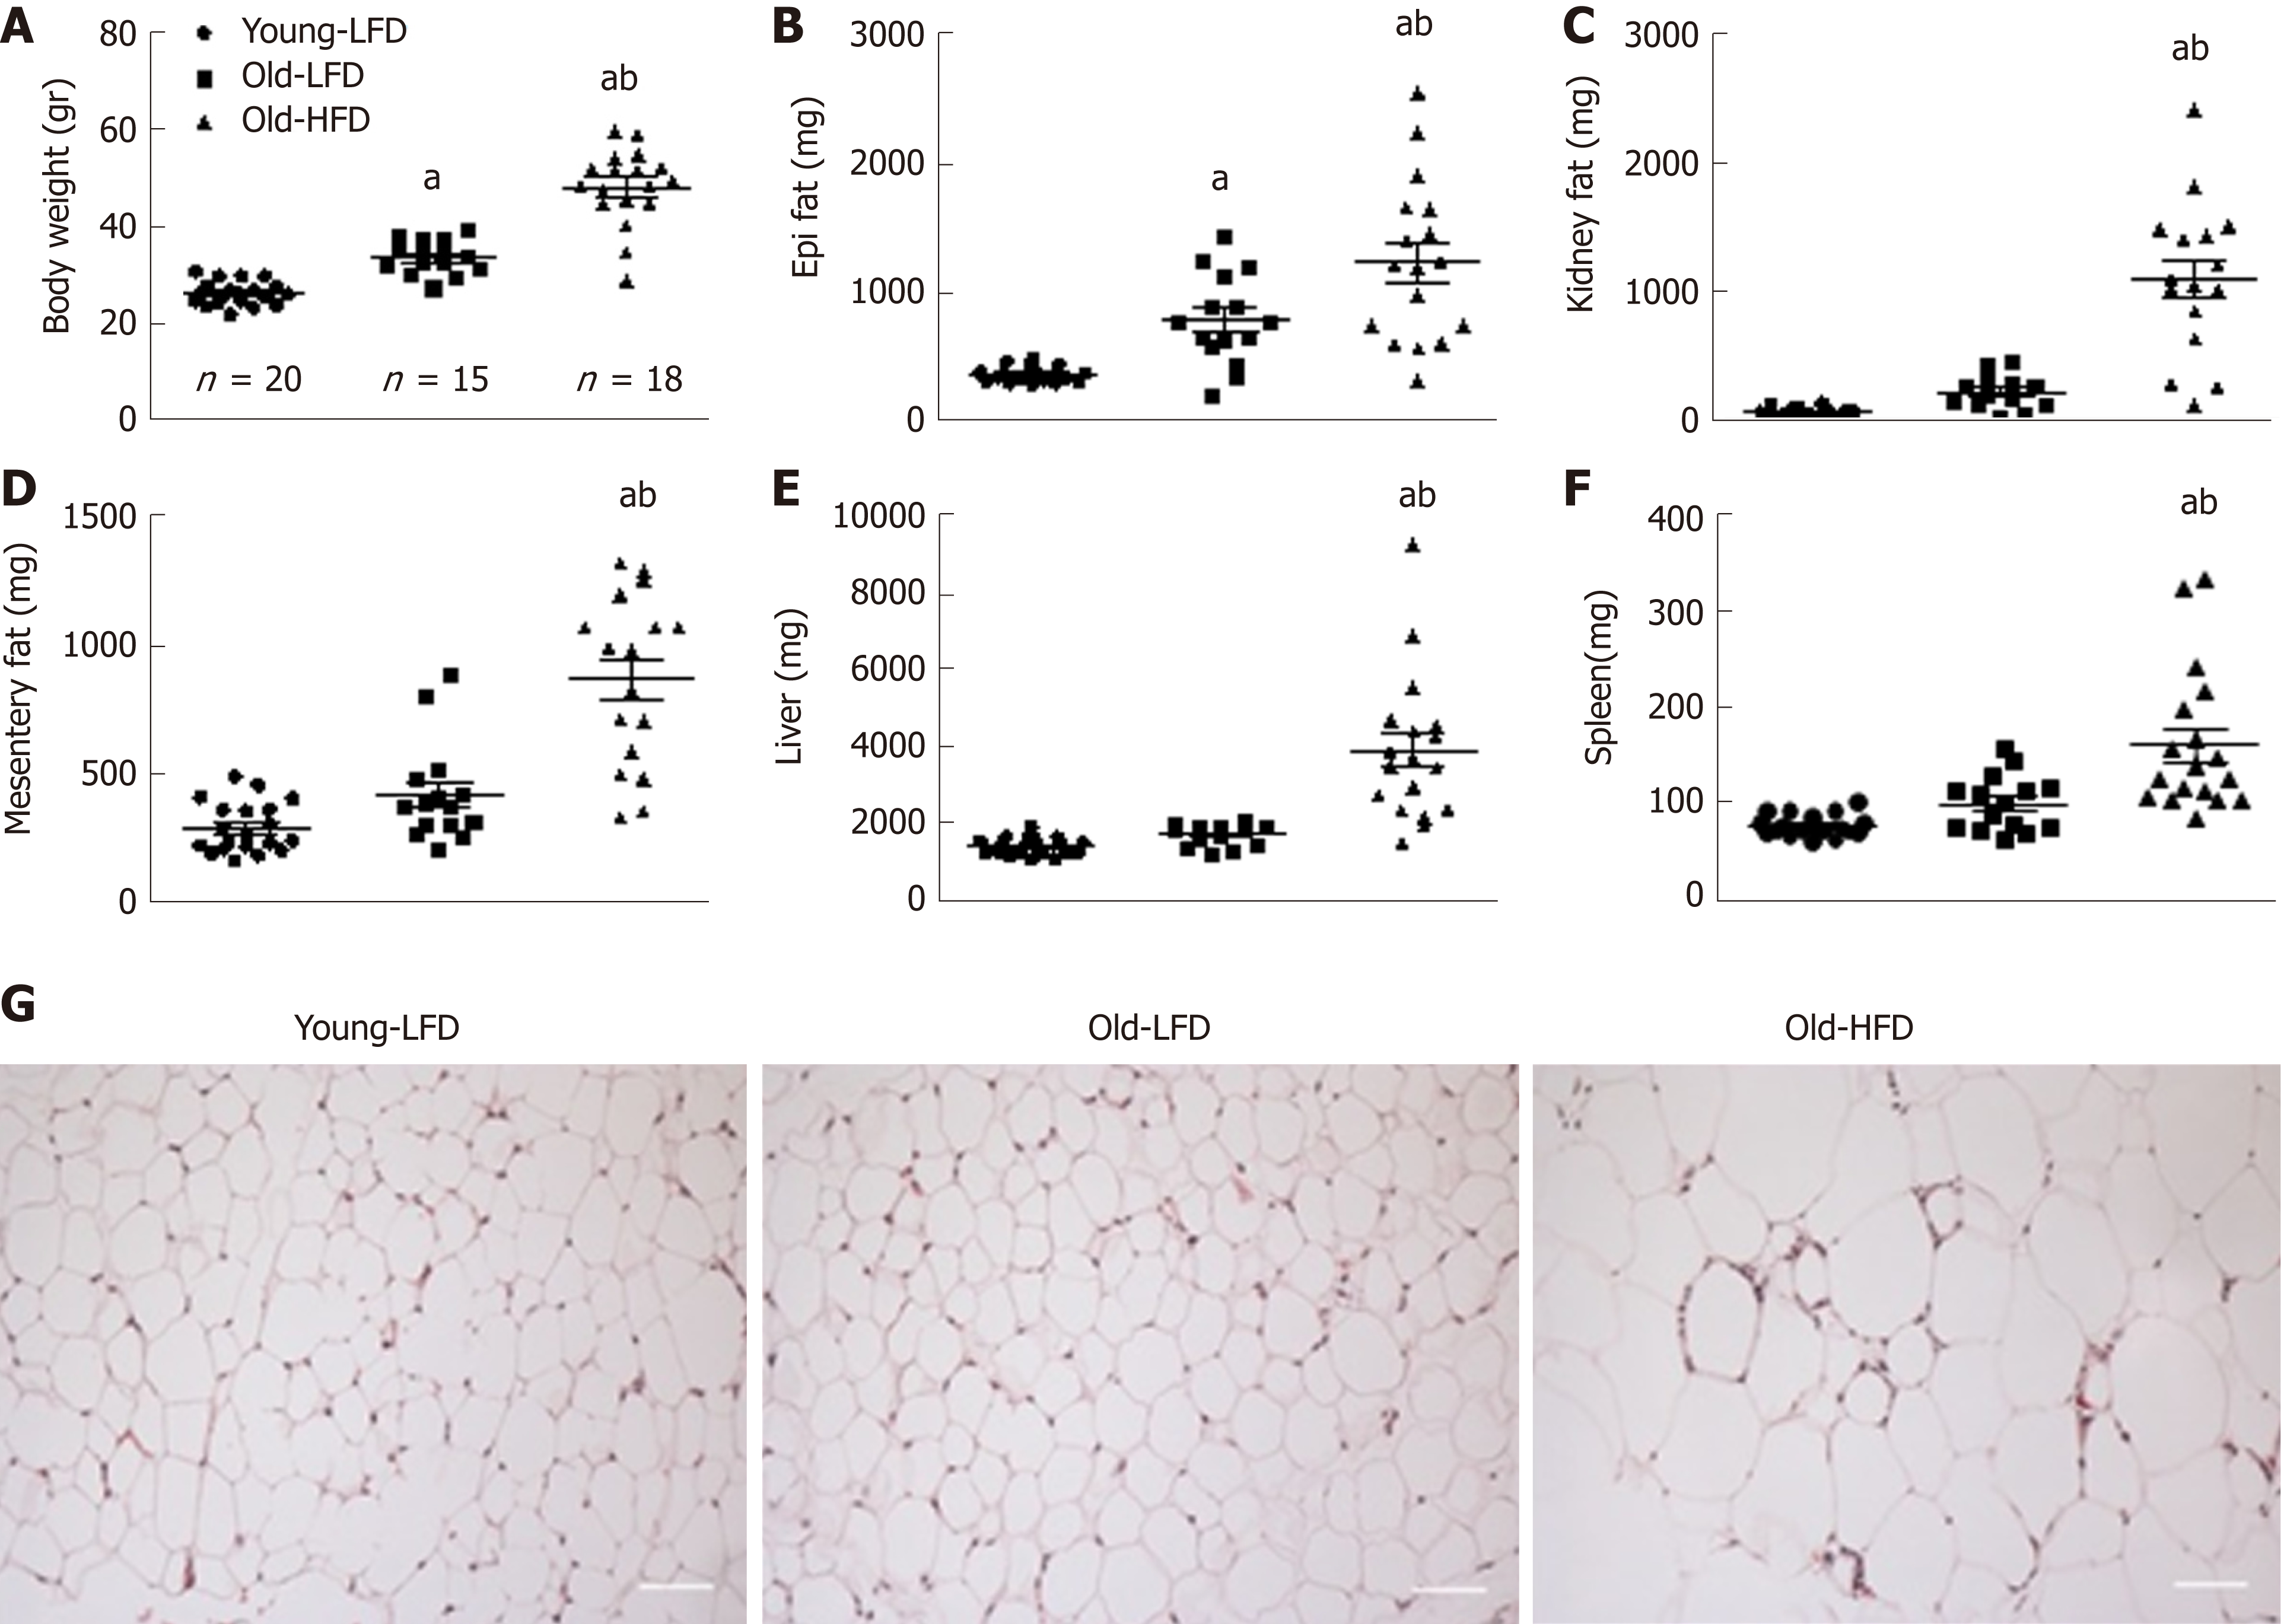
Figure 1 Morphometric characterization of mice subjected to prolonged high-fat diet-feeding.
A: Average body weight; B: Average mass of epididymal fat pad; C: Kidney fat pad; D: Mesenteric fat pad; E: Liver tissue; F: Spleen tissue. G: Representative hematoxylin and eosin images of epididymal adipose tissue (200 X). Data are expressed as mean ± SE. n = 15-20 mice per group. aSignificantly different from Young-LFD (P < 0.05). b Significantly different from Old-LFD
(P < 0.05). HFD: High-fat diet-feeding; LFD: Low-fat diet.
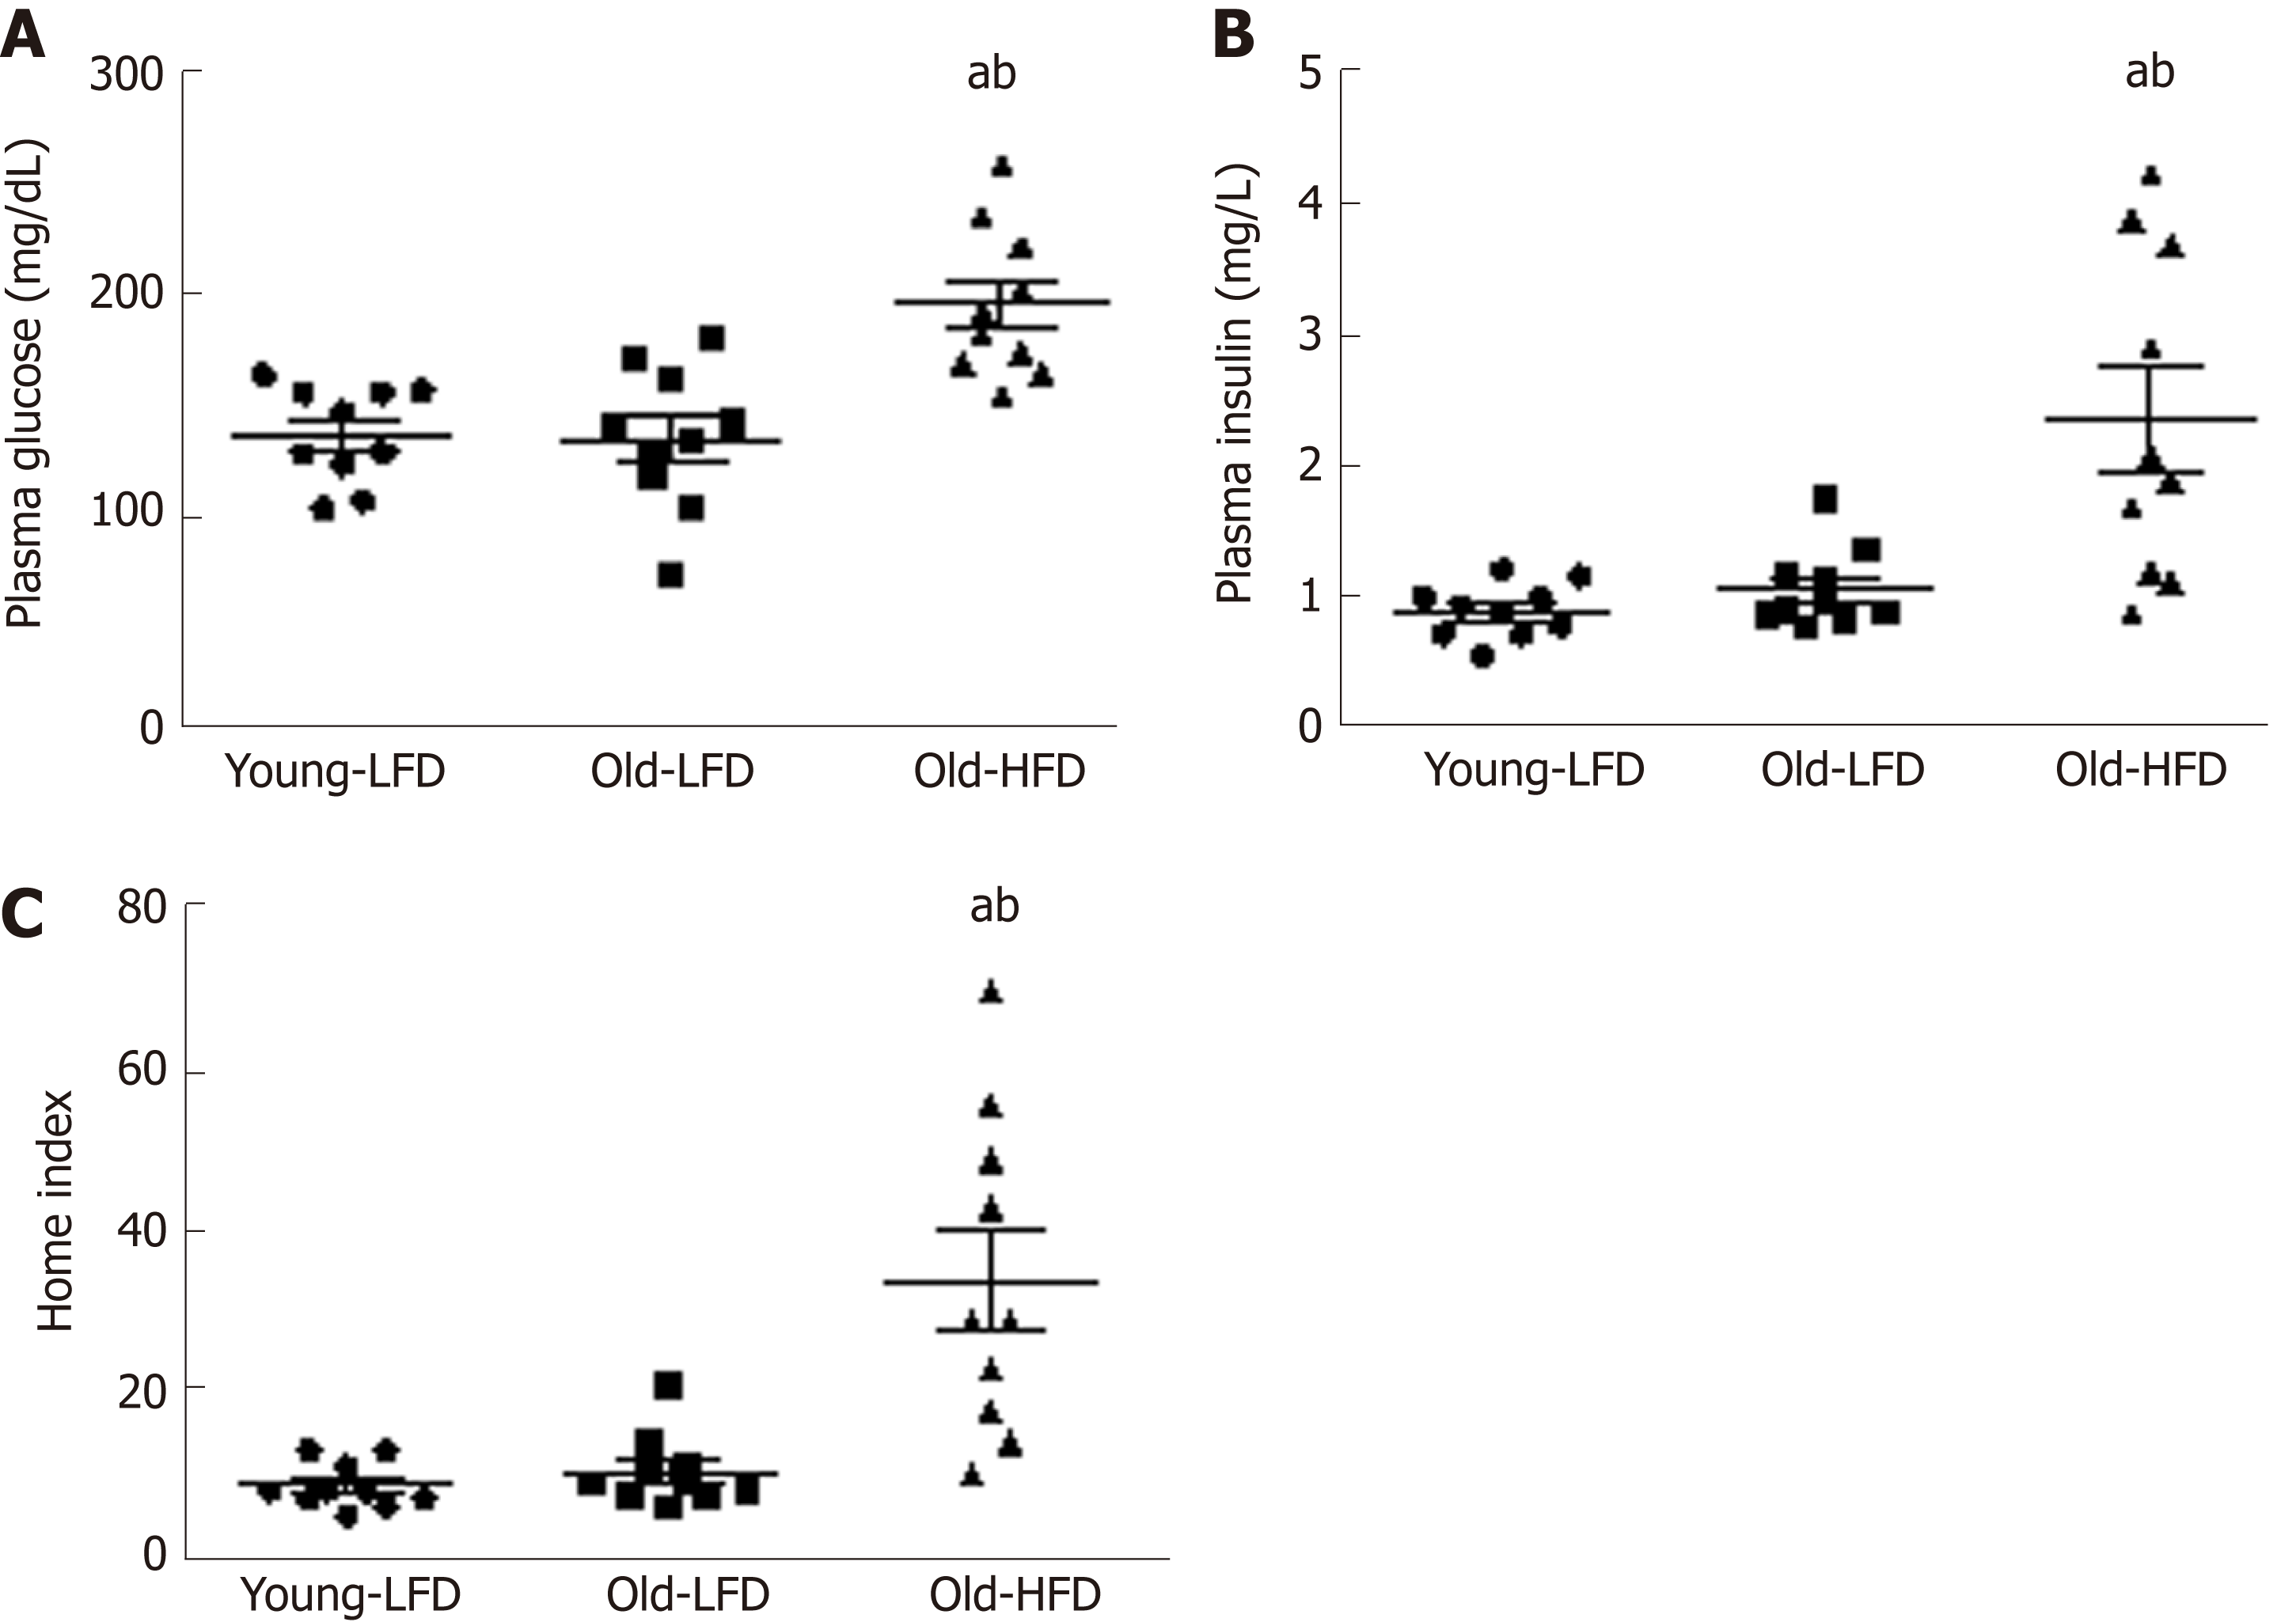
Figure 2 Metabolic characterization of mice subjected to prolonged high-fat diet-feeding.
A: Five hours fasting blood glucose; B: Five hours fasting plasma insulin; C: Homeostasis model of assessment-insulin resistance index. Data are expressed as mean ± SE. n = 10 mice per group. aSignificantly different from Young-LFD (P < 0.05). bSignificantly different from Old-LFD (P < 0.05). HOMA-IR: Homeostasis model of assessment-insulin resistance; LFD: Low-fat diet.
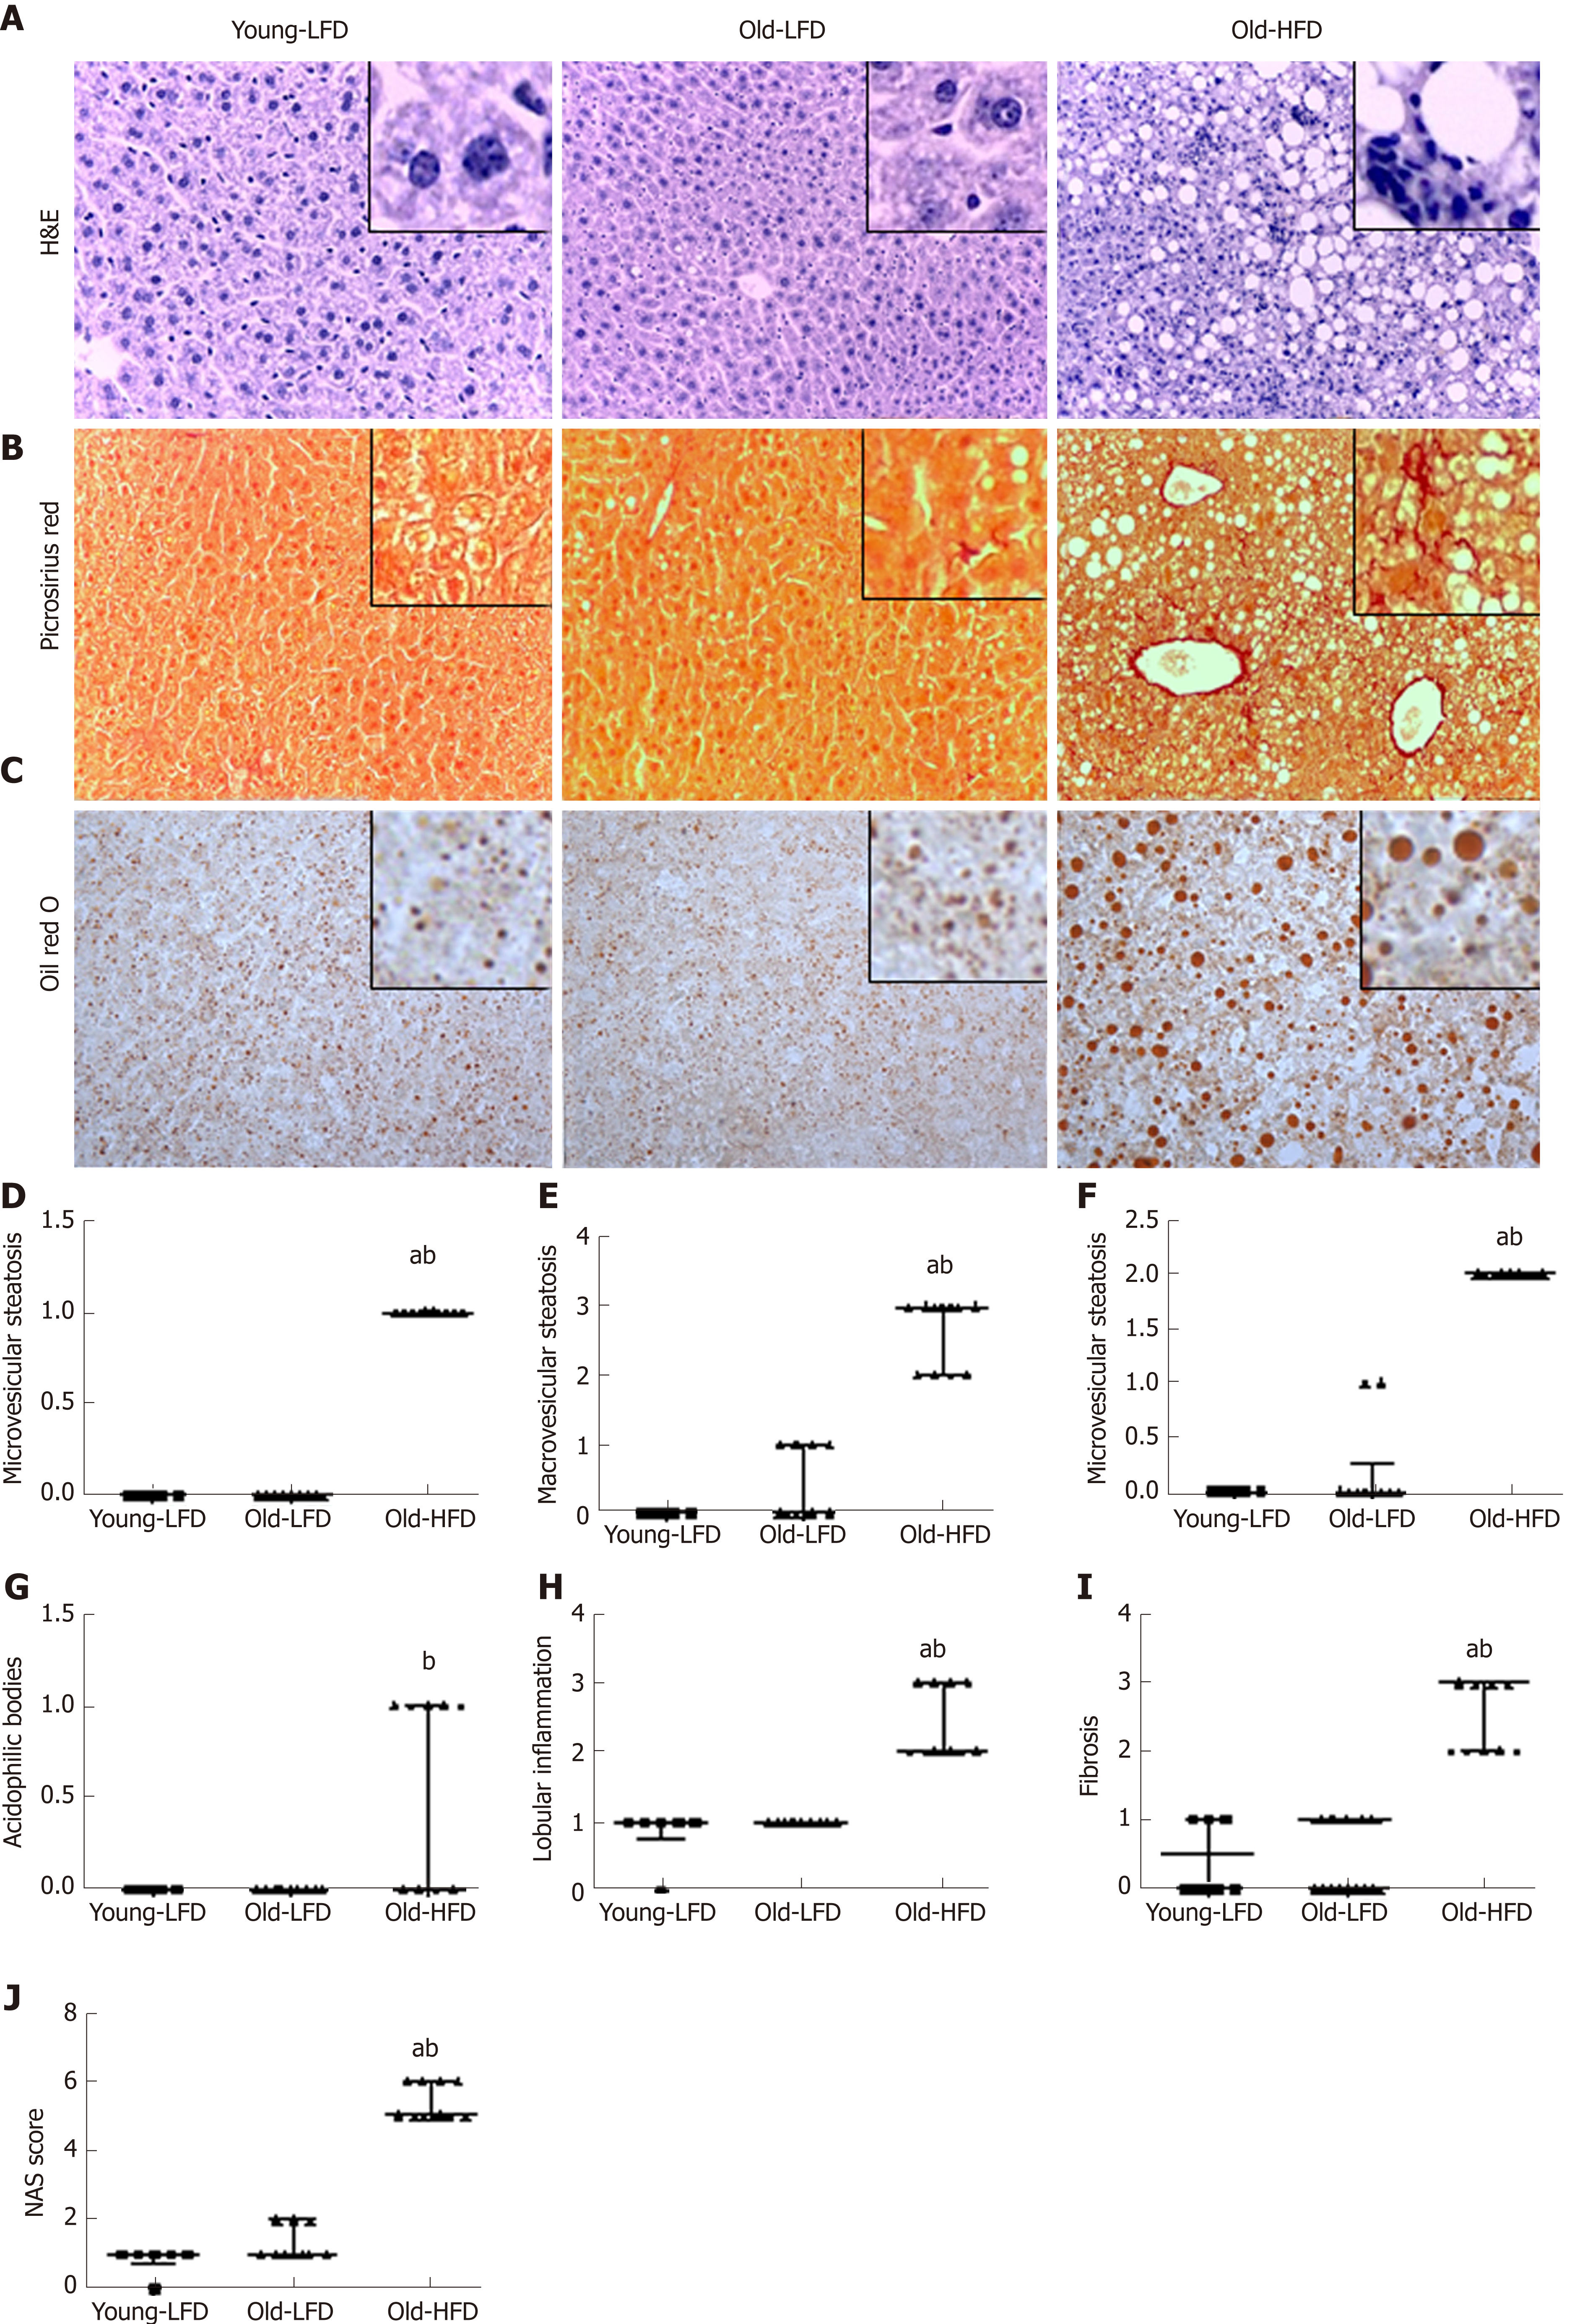
Figure 3 Histological assessment of the liver tissue in mice subjected to prolonged high-fat diet-feeding.
A: Hematoxylin and eosin; B: Picrossirious red; C: Oil red O images of liver tissue (200 X); D: Histological score of microvesicular steatosis; E: Microvesicular steatosis; F: Ballooing degeneration of hepatocytes; G: Acidophilic bodies; H: Lobular inflammation; I: Fibrosis; J: Non-alcoholic steatohepatitis score. Data are expressed as median with interquartile range. n = 6-11 mice per group. aSignificantly different from Young-LFD (P < 0.05), bSignificantly different from Old-LFD (P < 0.05). LFD: Low-fat diet.
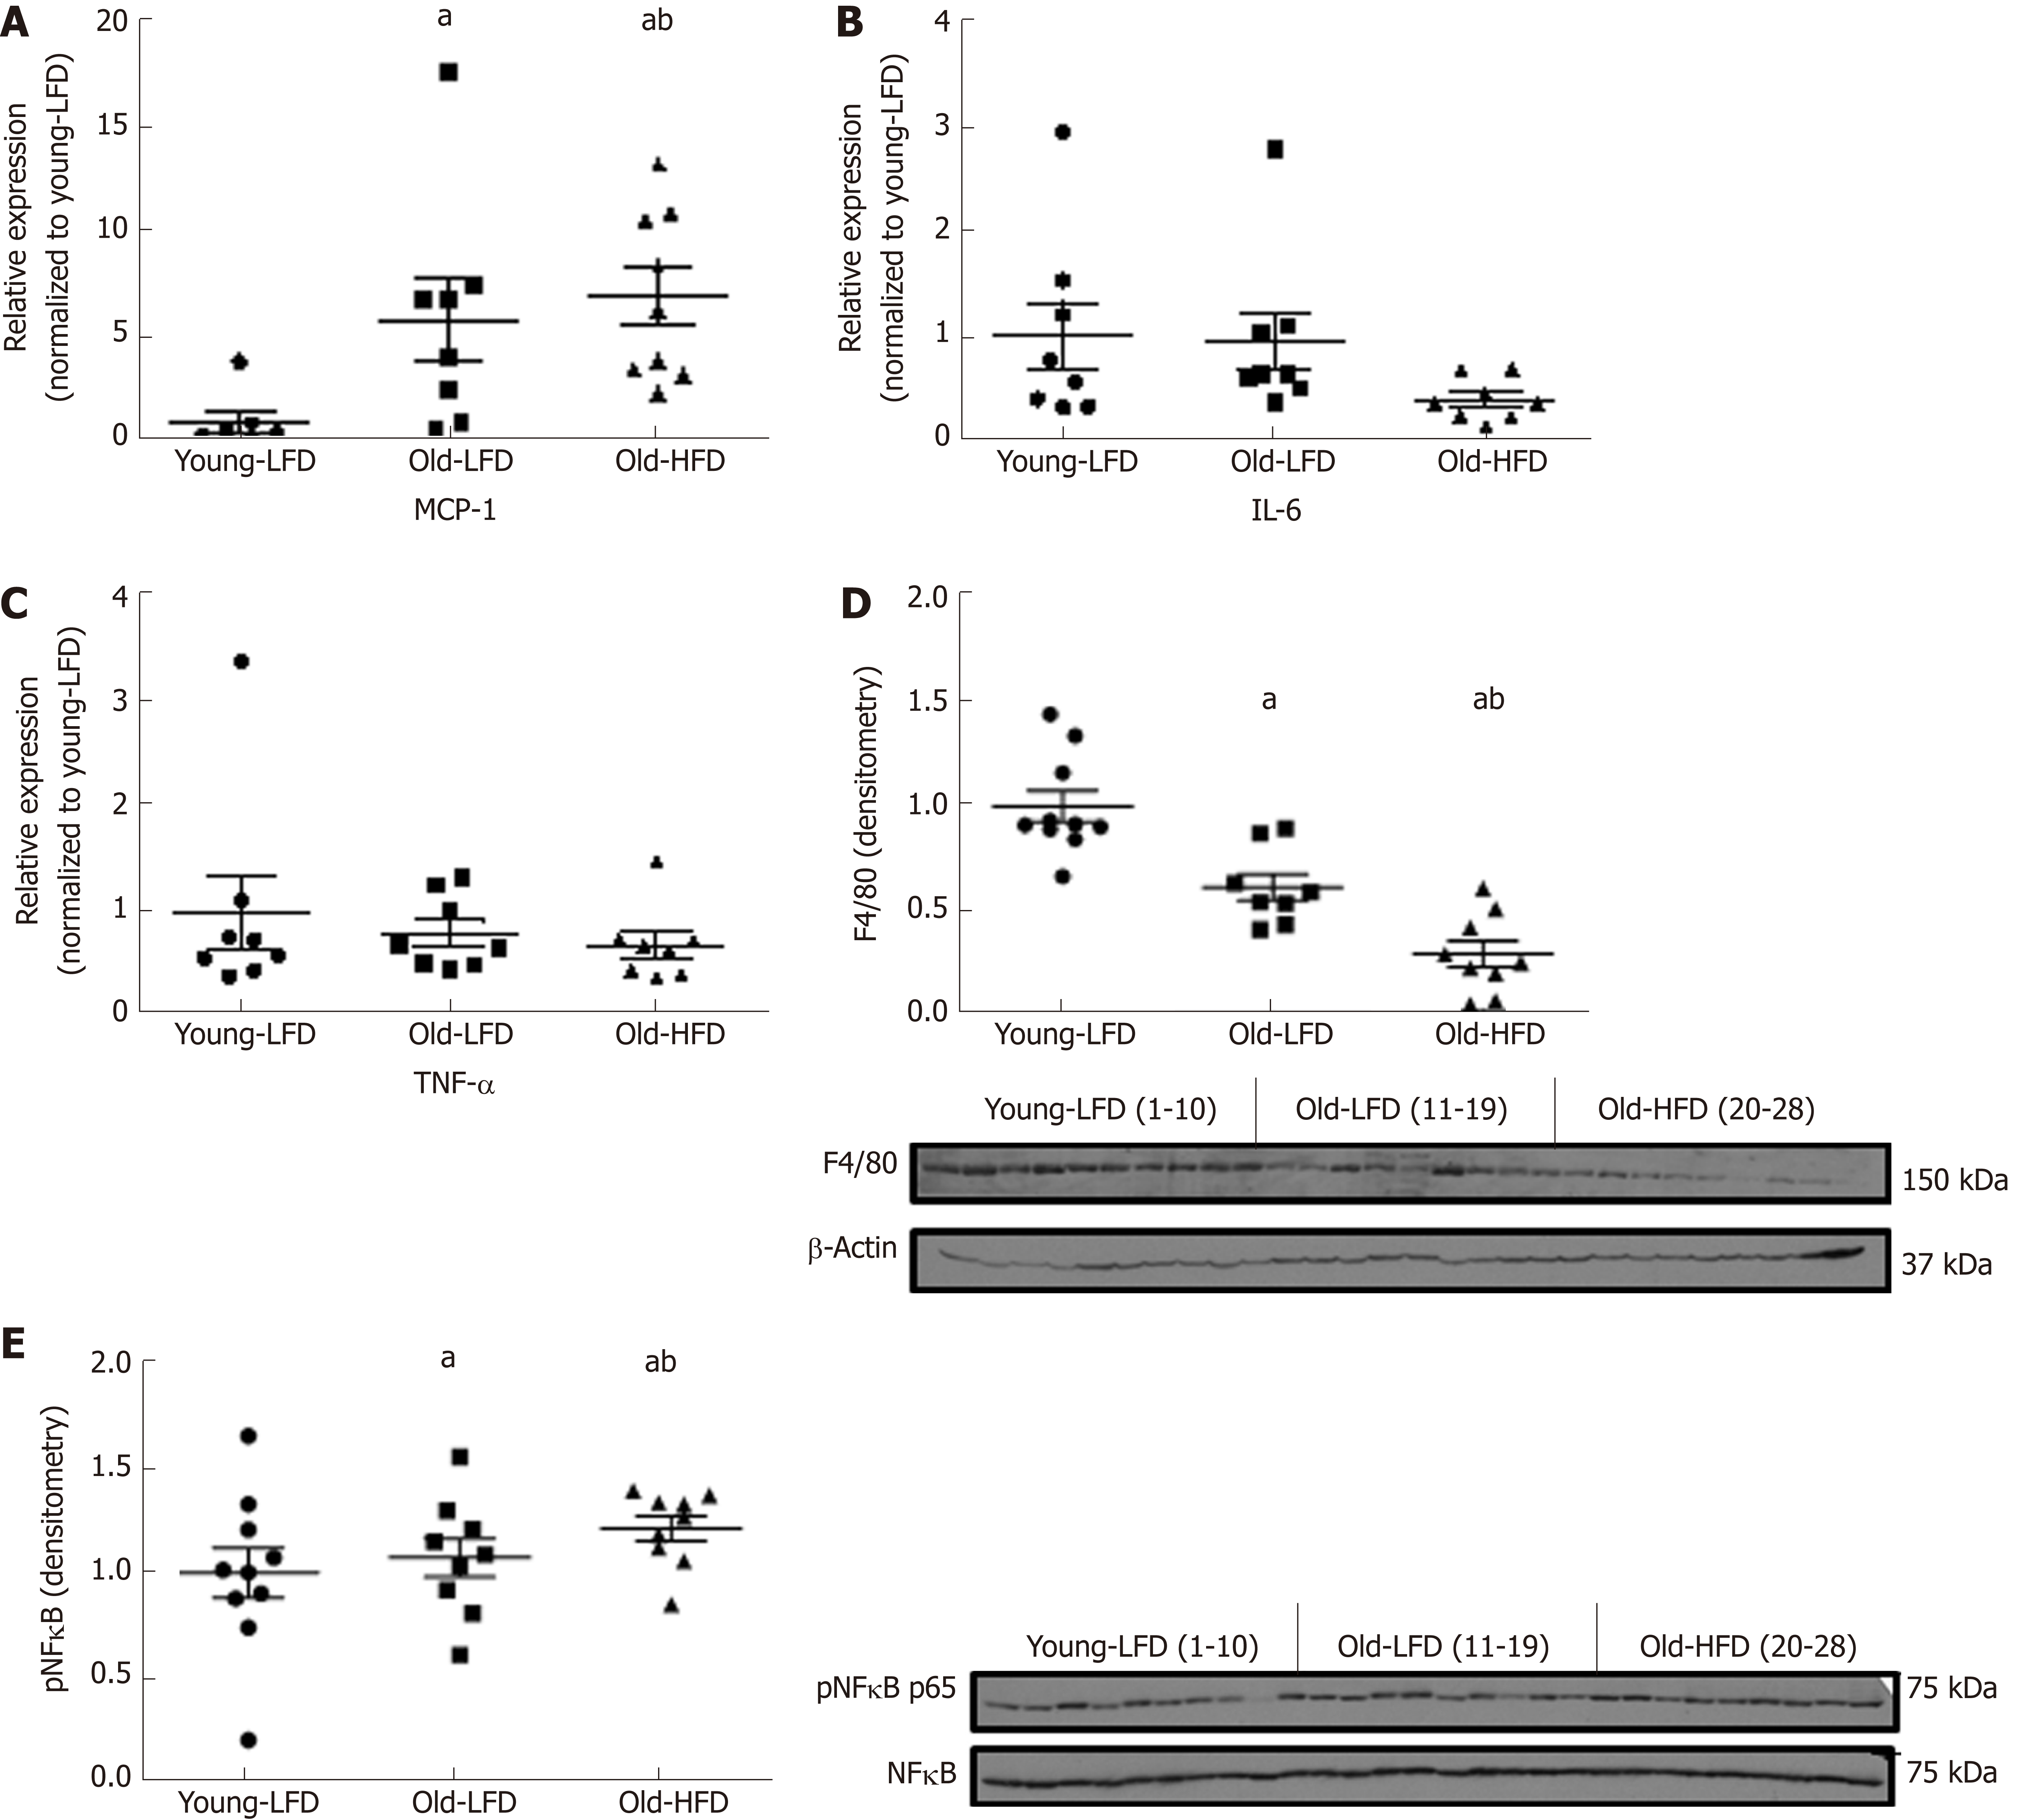
Figure 4 Inflammatory signaling in the liver tissue of mice subjected to prolonged high-fat diet-feeding.
A: Gene expression of monocyte chemoattractant protein-1; B: Gene expression of interleukin; C: Gene expression of tumor necrosis factor alpha; D: Protein concentration of epidermal-gowth factor like-like module-containing mucin-like hormone receptor-like 1 also known as F4/80; E: Phosphorylated and total nuclear factor kappa-light-chain-enhancer of activated B cells. Data are expressed as mean ± SEM. n = 8-10 mice per group. a Significantly different from Young-LFD (P < 0.05). b Significantly different from Old-LFD (P < 0.05). MCP-1: Monocyte chemoattractant protein-1; IL-6: Interleukin 6; TNFα: Tumor necrosis factor alpha; NFκB: Nuclear factor kappa-light-chain-enhancer of activated B cells; LFD: Low-fat diet.
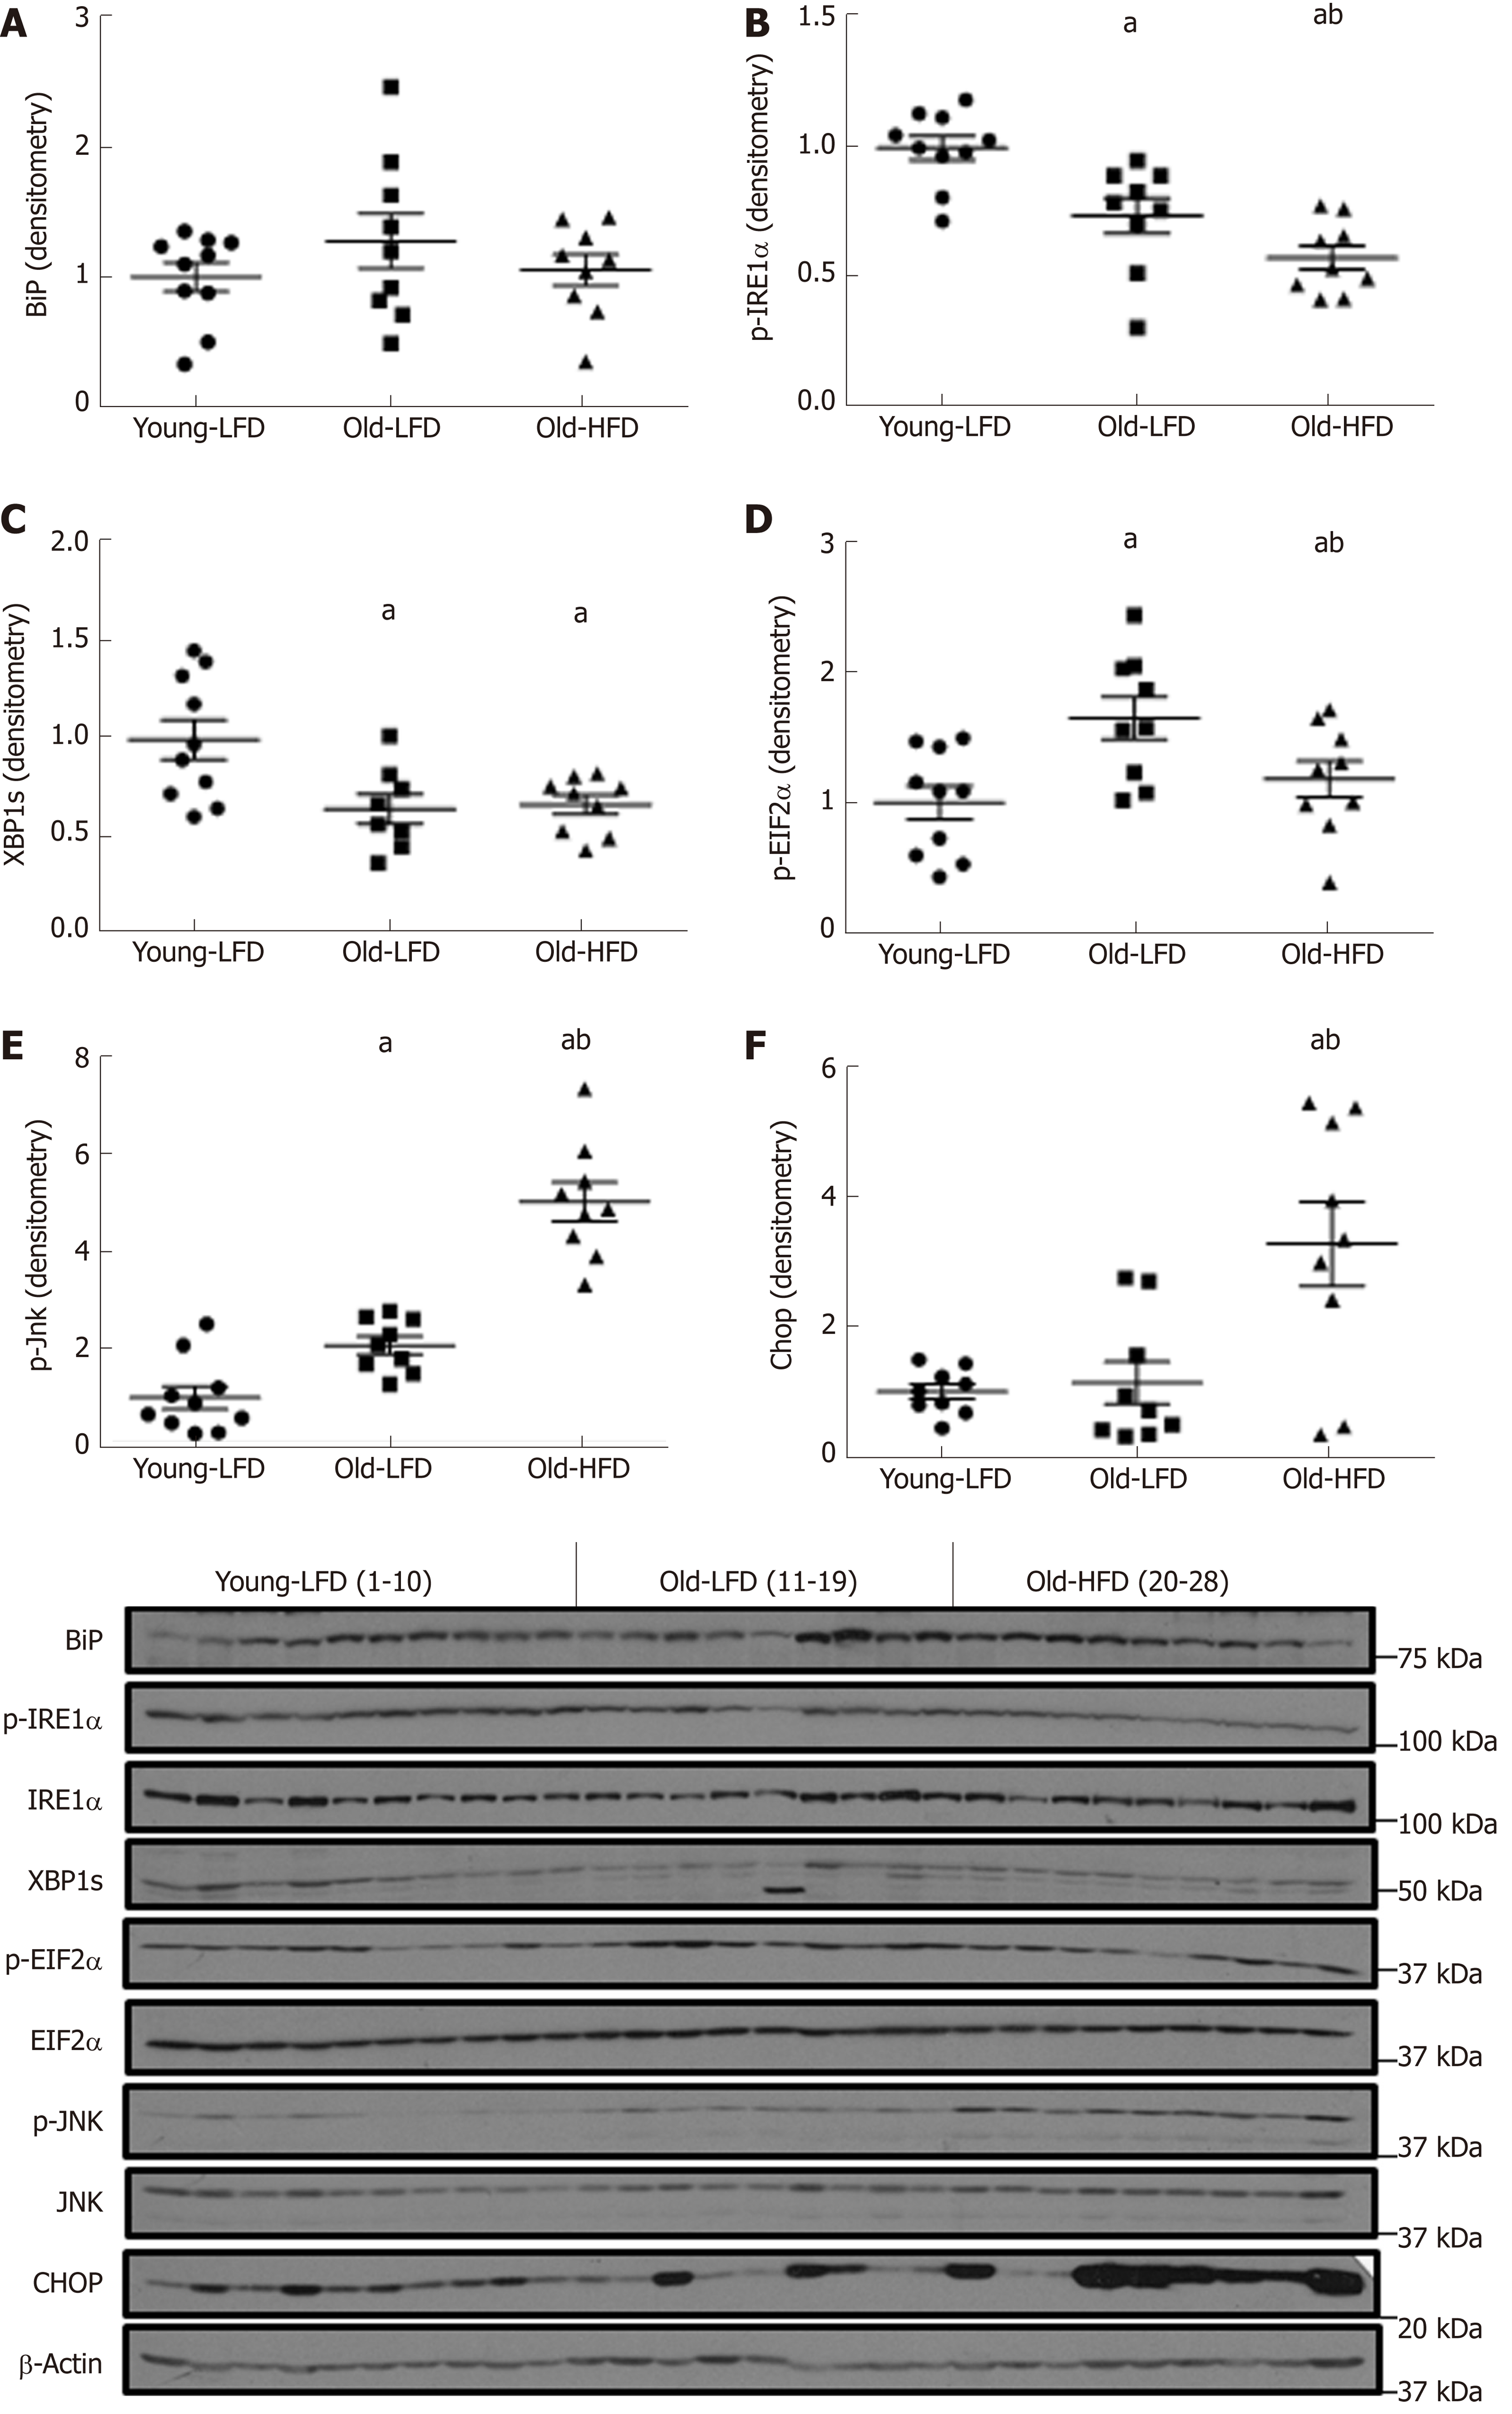
Figure 5 Endoplasmic reticulum stress signaling in the liver tissue of mice subjected to prolonged high-fat diet-feeding.
A: Western blot densitometry analysis of binding immunoglobulin; B: Western blot densitometry analysis of phosphorylated inositol-requiring enzyme-1; C: Western blot densitometry analysis of X-box-binding protein-1; D: Western blot densitometry analysis of phosphorylated eukaryotic translation initiation factor 2α; E: Western blot densitometry analysis of phosphorylated c-Jun-N-terminal kinase; F: Western blot densitometry analysis of C/EBP-homologous protein. Data are expressed as mean ± SE. n = 9-10 mice per group. aSignificantly different from Young-LFD (P < 0.05). bSignificantly different from Old-LFD (P < 0.05). Bip: Binding immunoglobulin; IRE1α: Inositol-requiring enzyme-1; XBP1s: X-box-binding protein-1; EIF2α: Eukaryotic translation initiation factor 2α; Jnk: Jun-N-terminal kinas; CHOP: C/EBP-homologous protein; LFD: Low-fat diet.
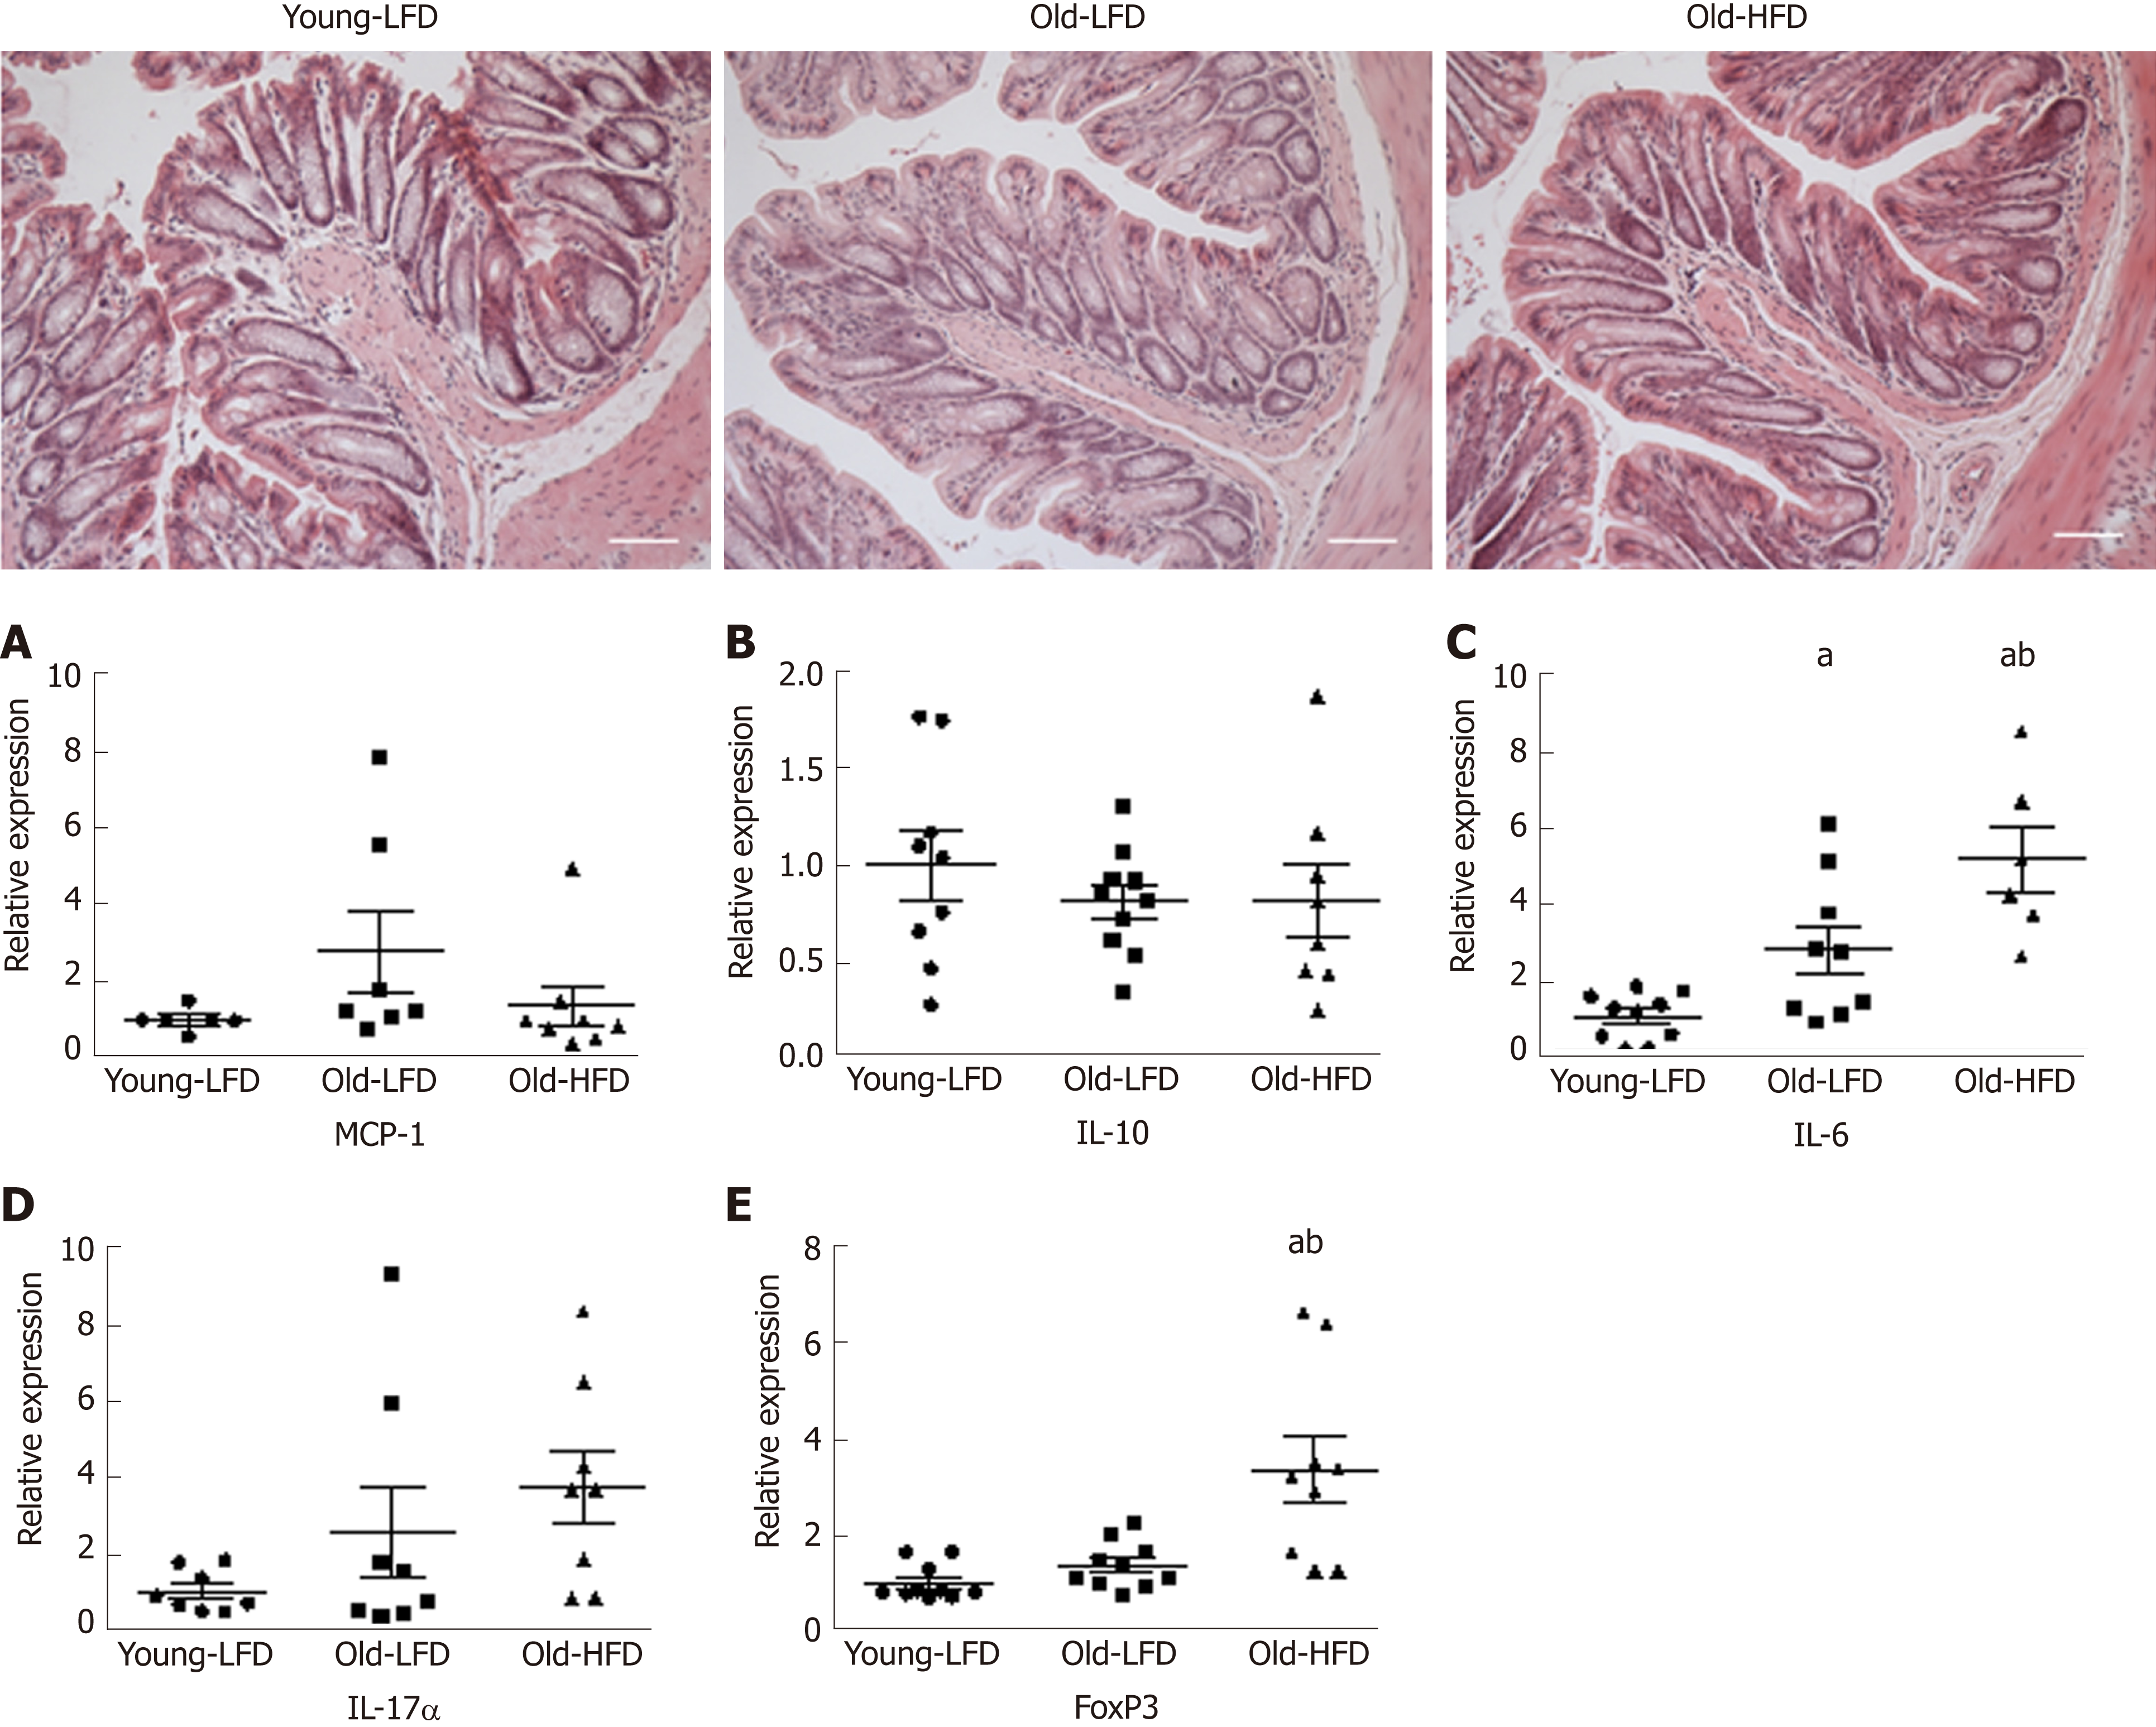
Figure 6 Inflammatory signaling in the colon tissue of mice subjected to prolonged high-fat diet-feeding.
Representative histology images of colonic tissue (200 X) from Young-low-fat diet (LFD), Old-LFD, and Old-HFD mice. A: Gene expression of Monocyte chemoattractant protein-1 (MCP-1); B: Interleukin 10 (IL-10); C: Interleukin 6 (IL-6); D: Interleukin 17 (IL-17); E: Forkhead box P3 (FoxP3). Data are expressed as mean ± SE. n = 10 mice per group. a Significantly different from Young-LFD (P < 0.05). b Significantly different from Old-LFD (P < 0.05). HFD: High-fat diet-feeding; LFD: Low-fat diet.
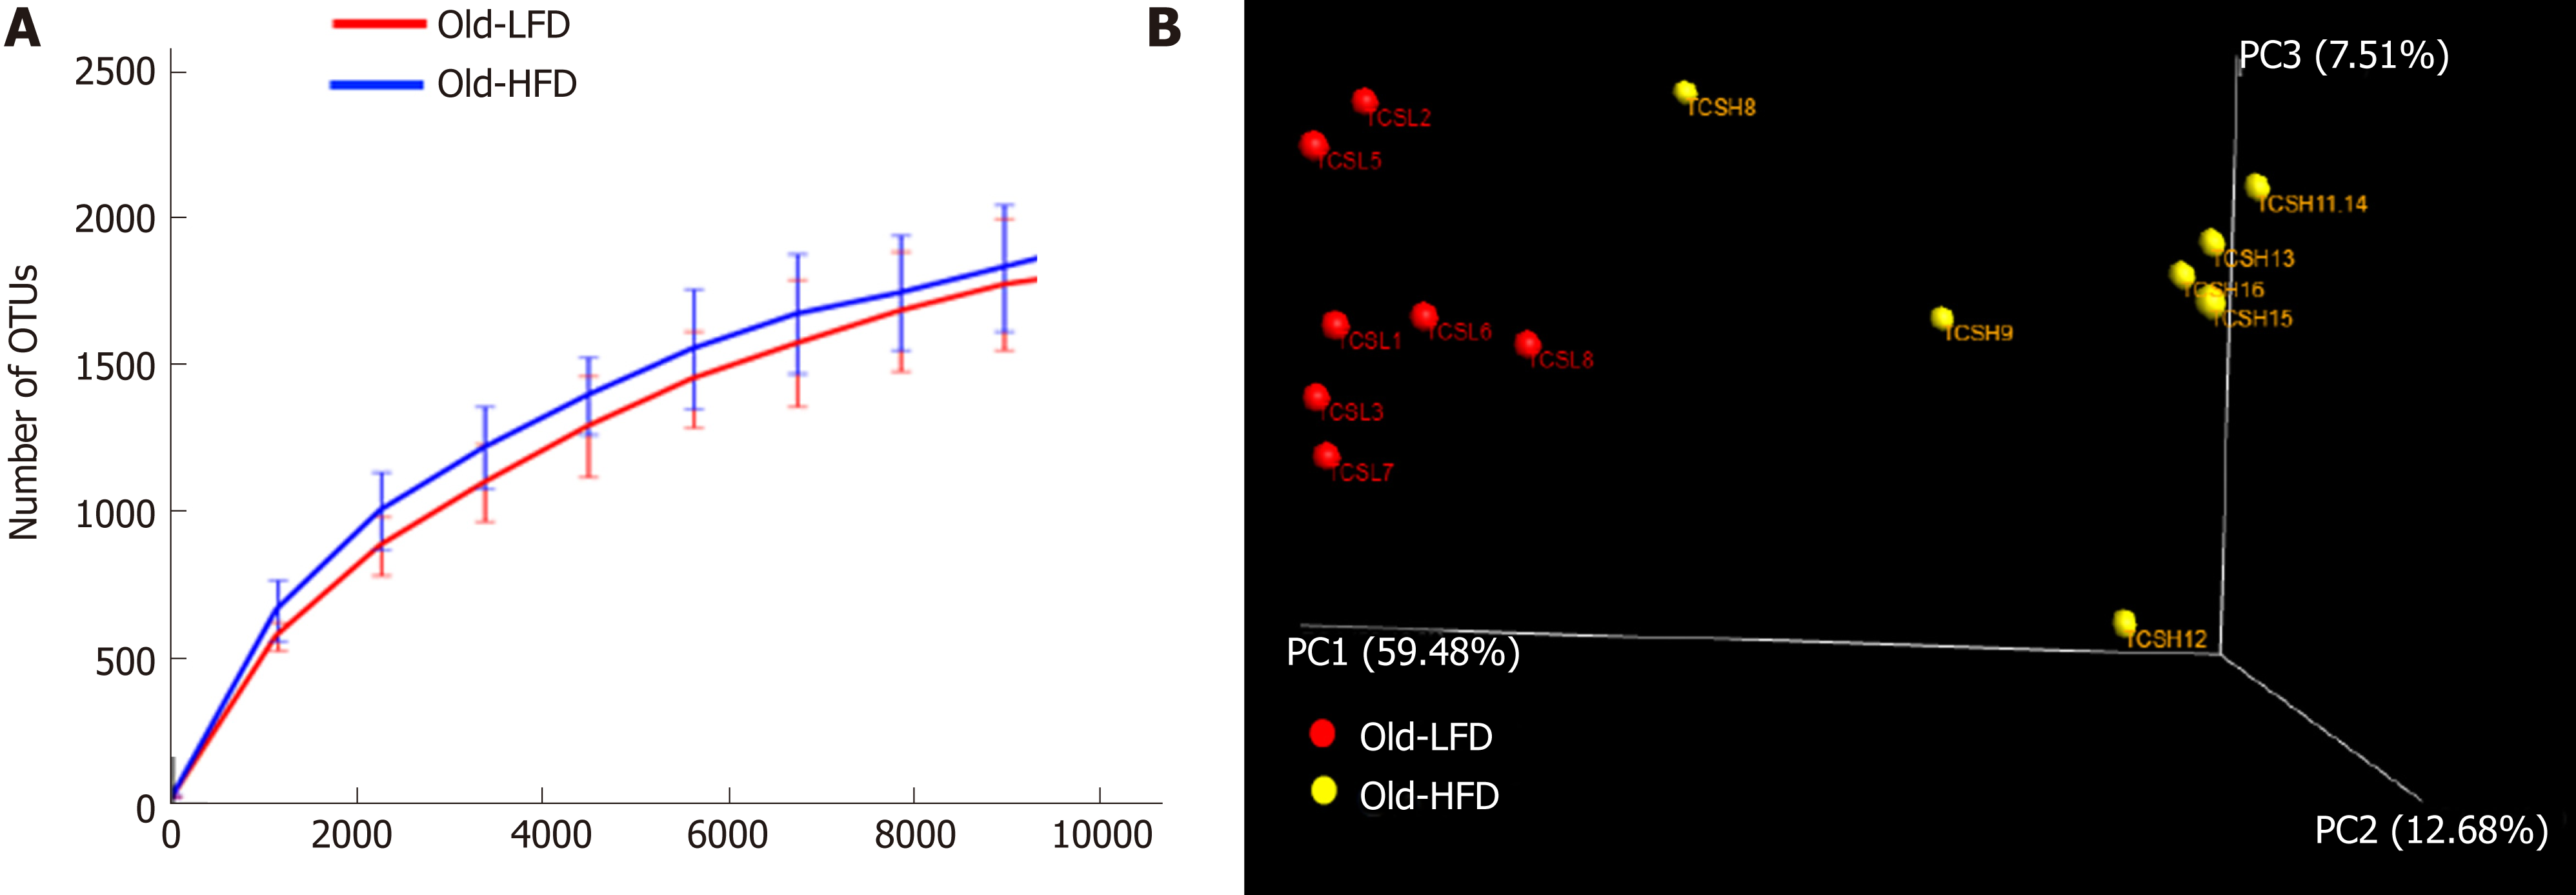
Figure 7 Gut microbial composition of mice subjected to prolonged high-fat diet-feeding.
A: Chao1 and sequence per sample; B: Principal coordinates analysis (PCoA). n = 7 mice per group. Only the feces of Old-high-fat diet-feeding and Old-high-fat diet-feeding mice were analyzed. Data are expressed as mean ± SE. n = 7 per group. HFD: High-fat diet-feeding; LFD: Low-fat diet.
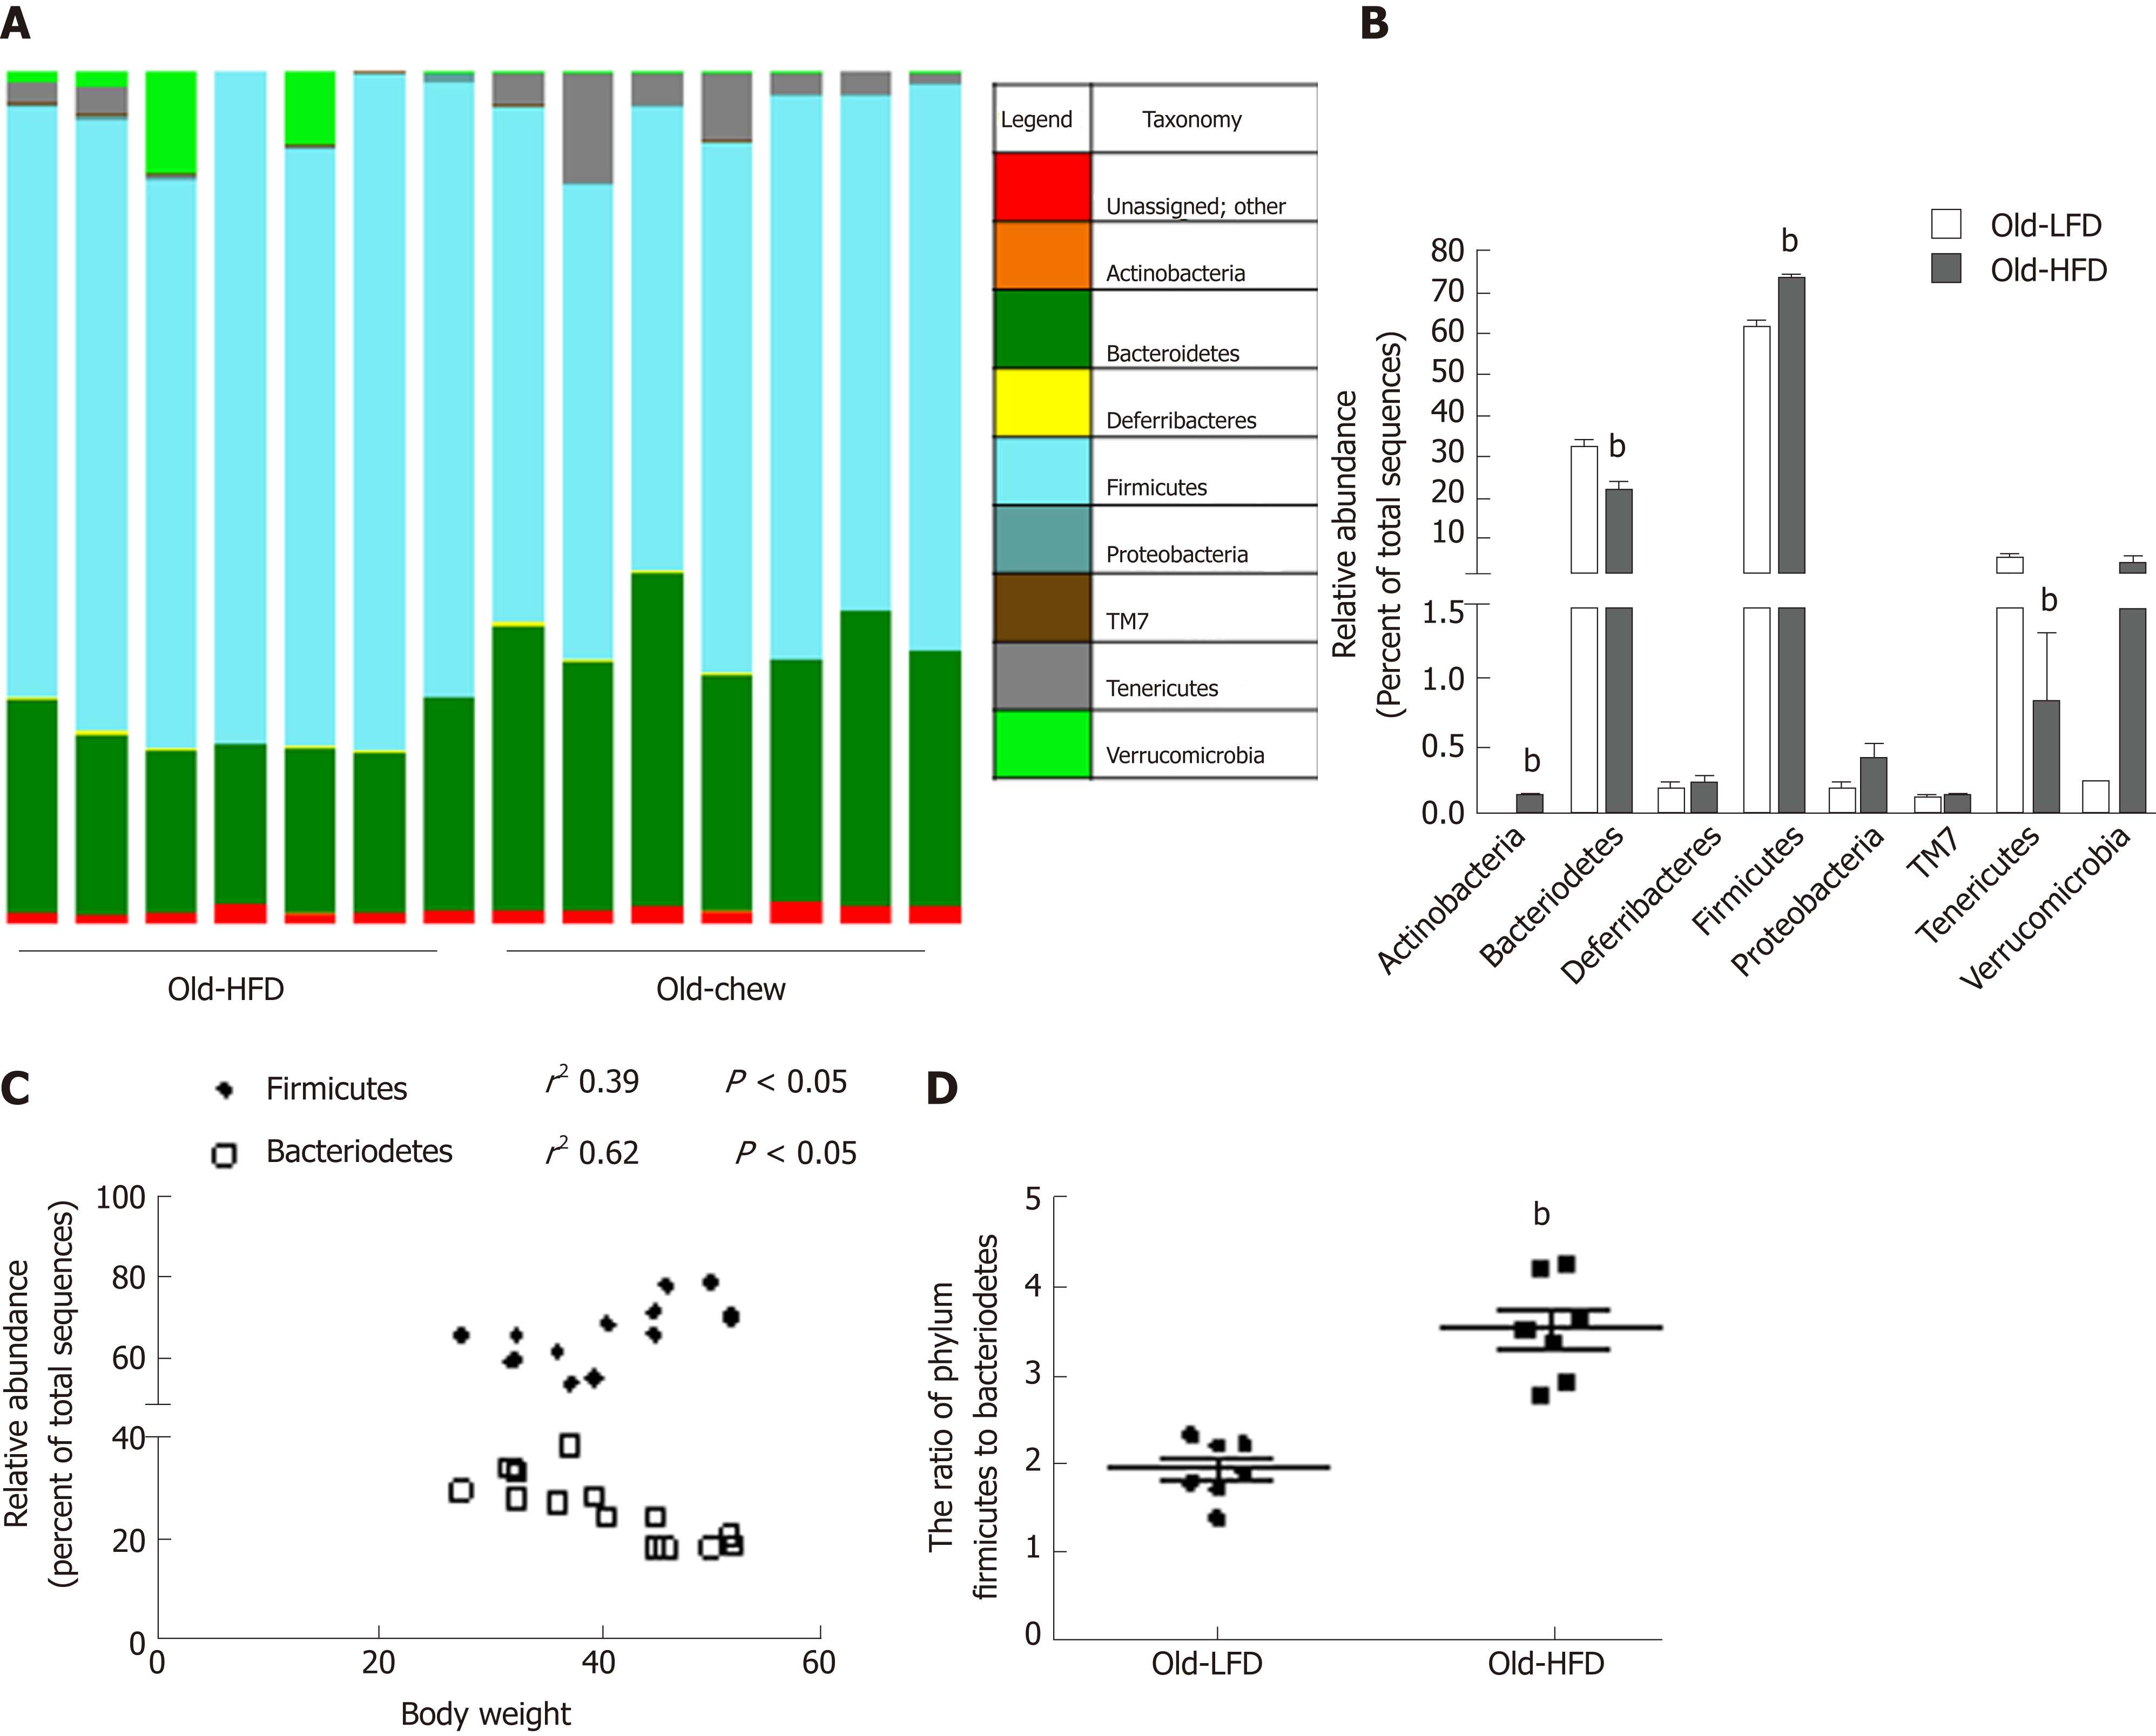
Figure 8 Relative abundance of gut microbial at the phylum level of mice subjected to prolonged high-fat diet-feeding.
A: Bar chart presenting the relative abundance of operational taxonomic units in bacterial phyla; B: Mean relative abundance of phyla; C: Mean relative ratio between firmicutes and bacteroidetes in Old-low-fat diet (LFD) and Old-high-fat diet-feeding (HFD) mice; D: Correlation between mean relative abundance of firmicutes and bacteroidetes and mouse body weight. Data are expressed as mean ± SE. n = 7 mice per group. bSignificantly different from Old-LFD (P < 0.05). HFD: High-fat diet-feeding; LFD: Low-fat diet.
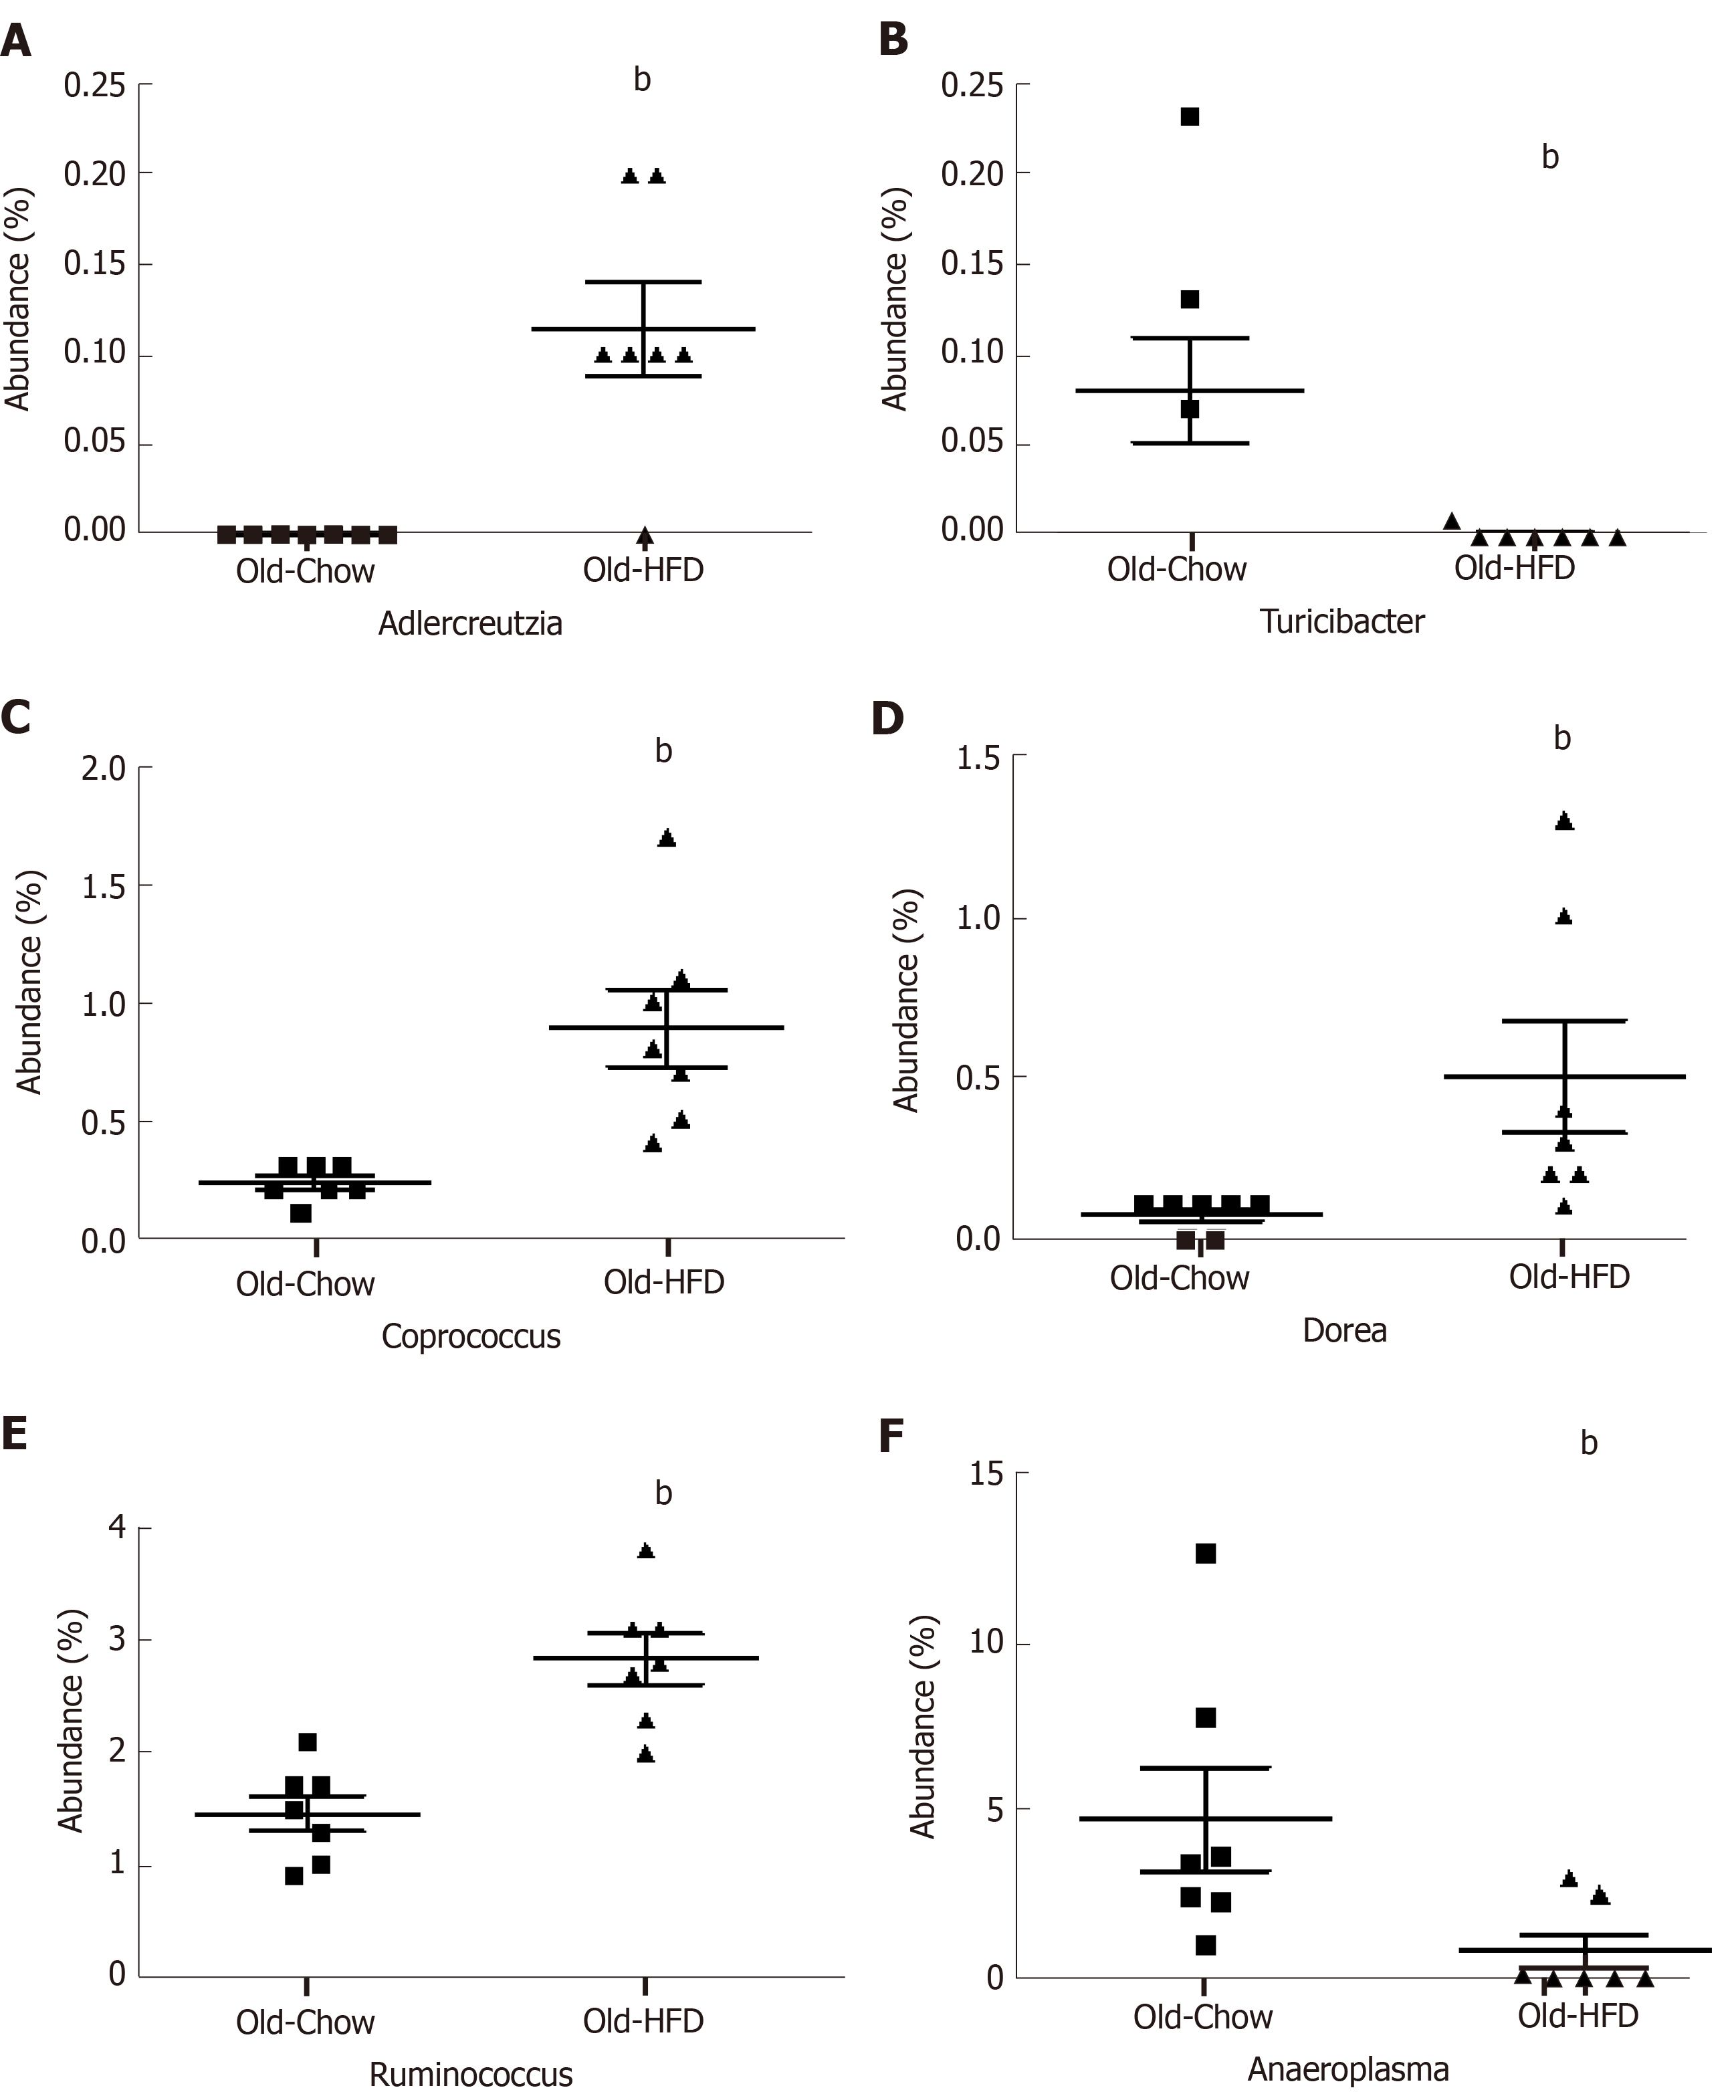
Figure 9 Relative abundance of gut microbial at the genus level of mice subjected to prolonged high-fat diet-feeding.
A: Mean relative abundance of Adlercreutzia; B: Mean relative abundance of Turicibacter; C: Mean relative abundance of Coprococcus; D: Mean relative abundance of Dorea; E: Mean relative abundance of Ruminococcus; F: Mean relative abundance of Anaerosplasma. Data are expressed as mean ± SE. n = 7 mice per group. bP < 0.05, vs Old-LFD. HFD: High-fat diet-feeding; LFD: Low-fat diet.
- Citation: Velázquez KT, Enos RT, Bader JE, Sougiannis AT, Carson MS, Chatzistamou I, Carson JA, Nagarkatti PS, Nagarkatti M, Murphy EA. Prolonged high-fat-diet feeding promotes non-alcoholic fatty liver disease and alters gut microbiota in mice. World J Hepatol 2019; 11(8): 619-637
- URL: https://www.wjgnet.com/1948-5182/full/v11/i8/619.htm
- DOI: https://dx.doi.org/10.4254/wjh.v11.i8.619


