Copyright
©The Author(s) 2019.
World J Hepatol. Aug 27, 2019; 11(8): 619-637
Published online Aug 27, 2019. doi: 10.4254/wjh.v11.i8.619
Published online Aug 27, 2019. doi: 10.4254/wjh.v11.i8.619
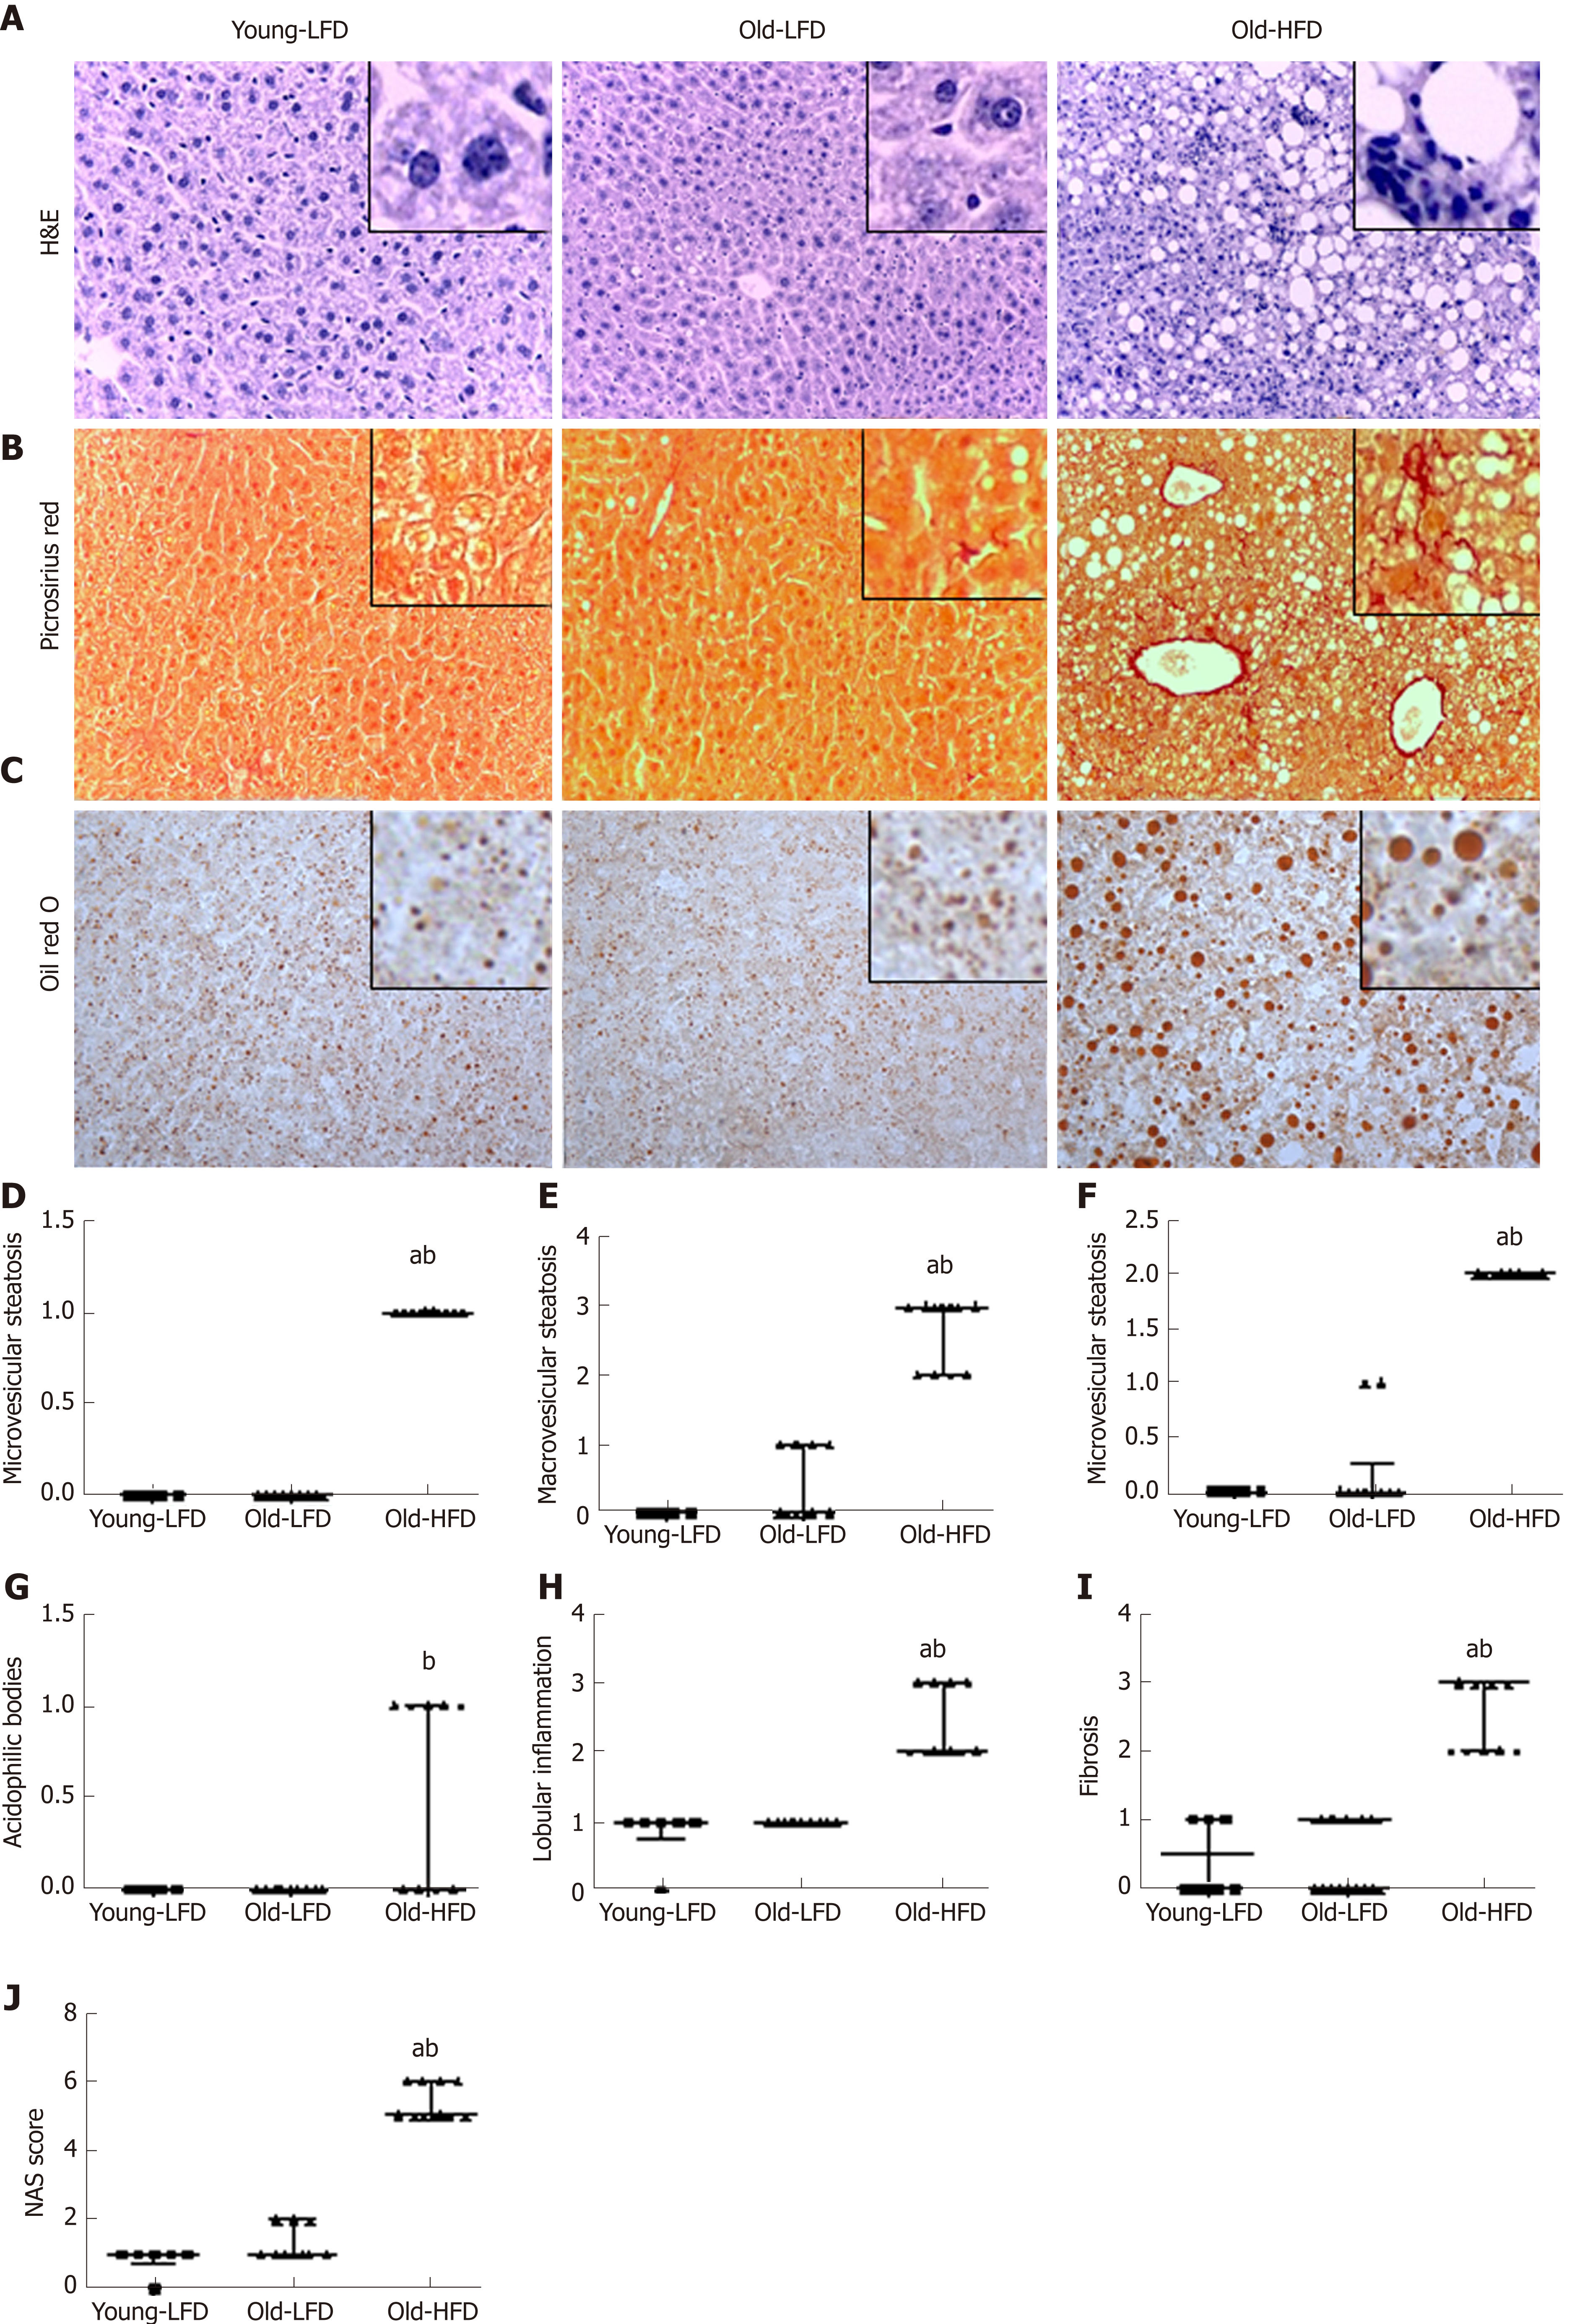
Figure 3 Histological assessment of the liver tissue in mice subjected to prolonged high-fat diet-feeding.
A: Hematoxylin and eosin; B: Picrossirious red; C: Oil red O images of liver tissue (200 X); D: Histological score of microvesicular steatosis; E: Microvesicular steatosis; F: Ballooing degeneration of hepatocytes; G: Acidophilic bodies; H: Lobular inflammation; I: Fibrosis; J: Non-alcoholic steatohepatitis score. Data are expressed as median with interquartile range. n = 6-11 mice per group. aSignificantly different from Young-LFD (P < 0.05), bSignificantly different from Old-LFD (P < 0.05). LFD: Low-fat diet.
- Citation: Velázquez KT, Enos RT, Bader JE, Sougiannis AT, Carson MS, Chatzistamou I, Carson JA, Nagarkatti PS, Nagarkatti M, Murphy EA. Prolonged high-fat-diet feeding promotes non-alcoholic fatty liver disease and alters gut microbiota in mice. World J Hepatol 2019; 11(8): 619-637
- URL: https://www.wjgnet.com/1948-5182/full/v11/i8/619.htm
- DOI: https://dx.doi.org/10.4254/wjh.v11.i8.619


