Copyright
©The Author(s) 2019.
World J Hepatol. Aug 27, 2019; 11(8): 619-637
Published online Aug 27, 2019. doi: 10.4254/wjh.v11.i8.619
Published online Aug 27, 2019. doi: 10.4254/wjh.v11.i8.619
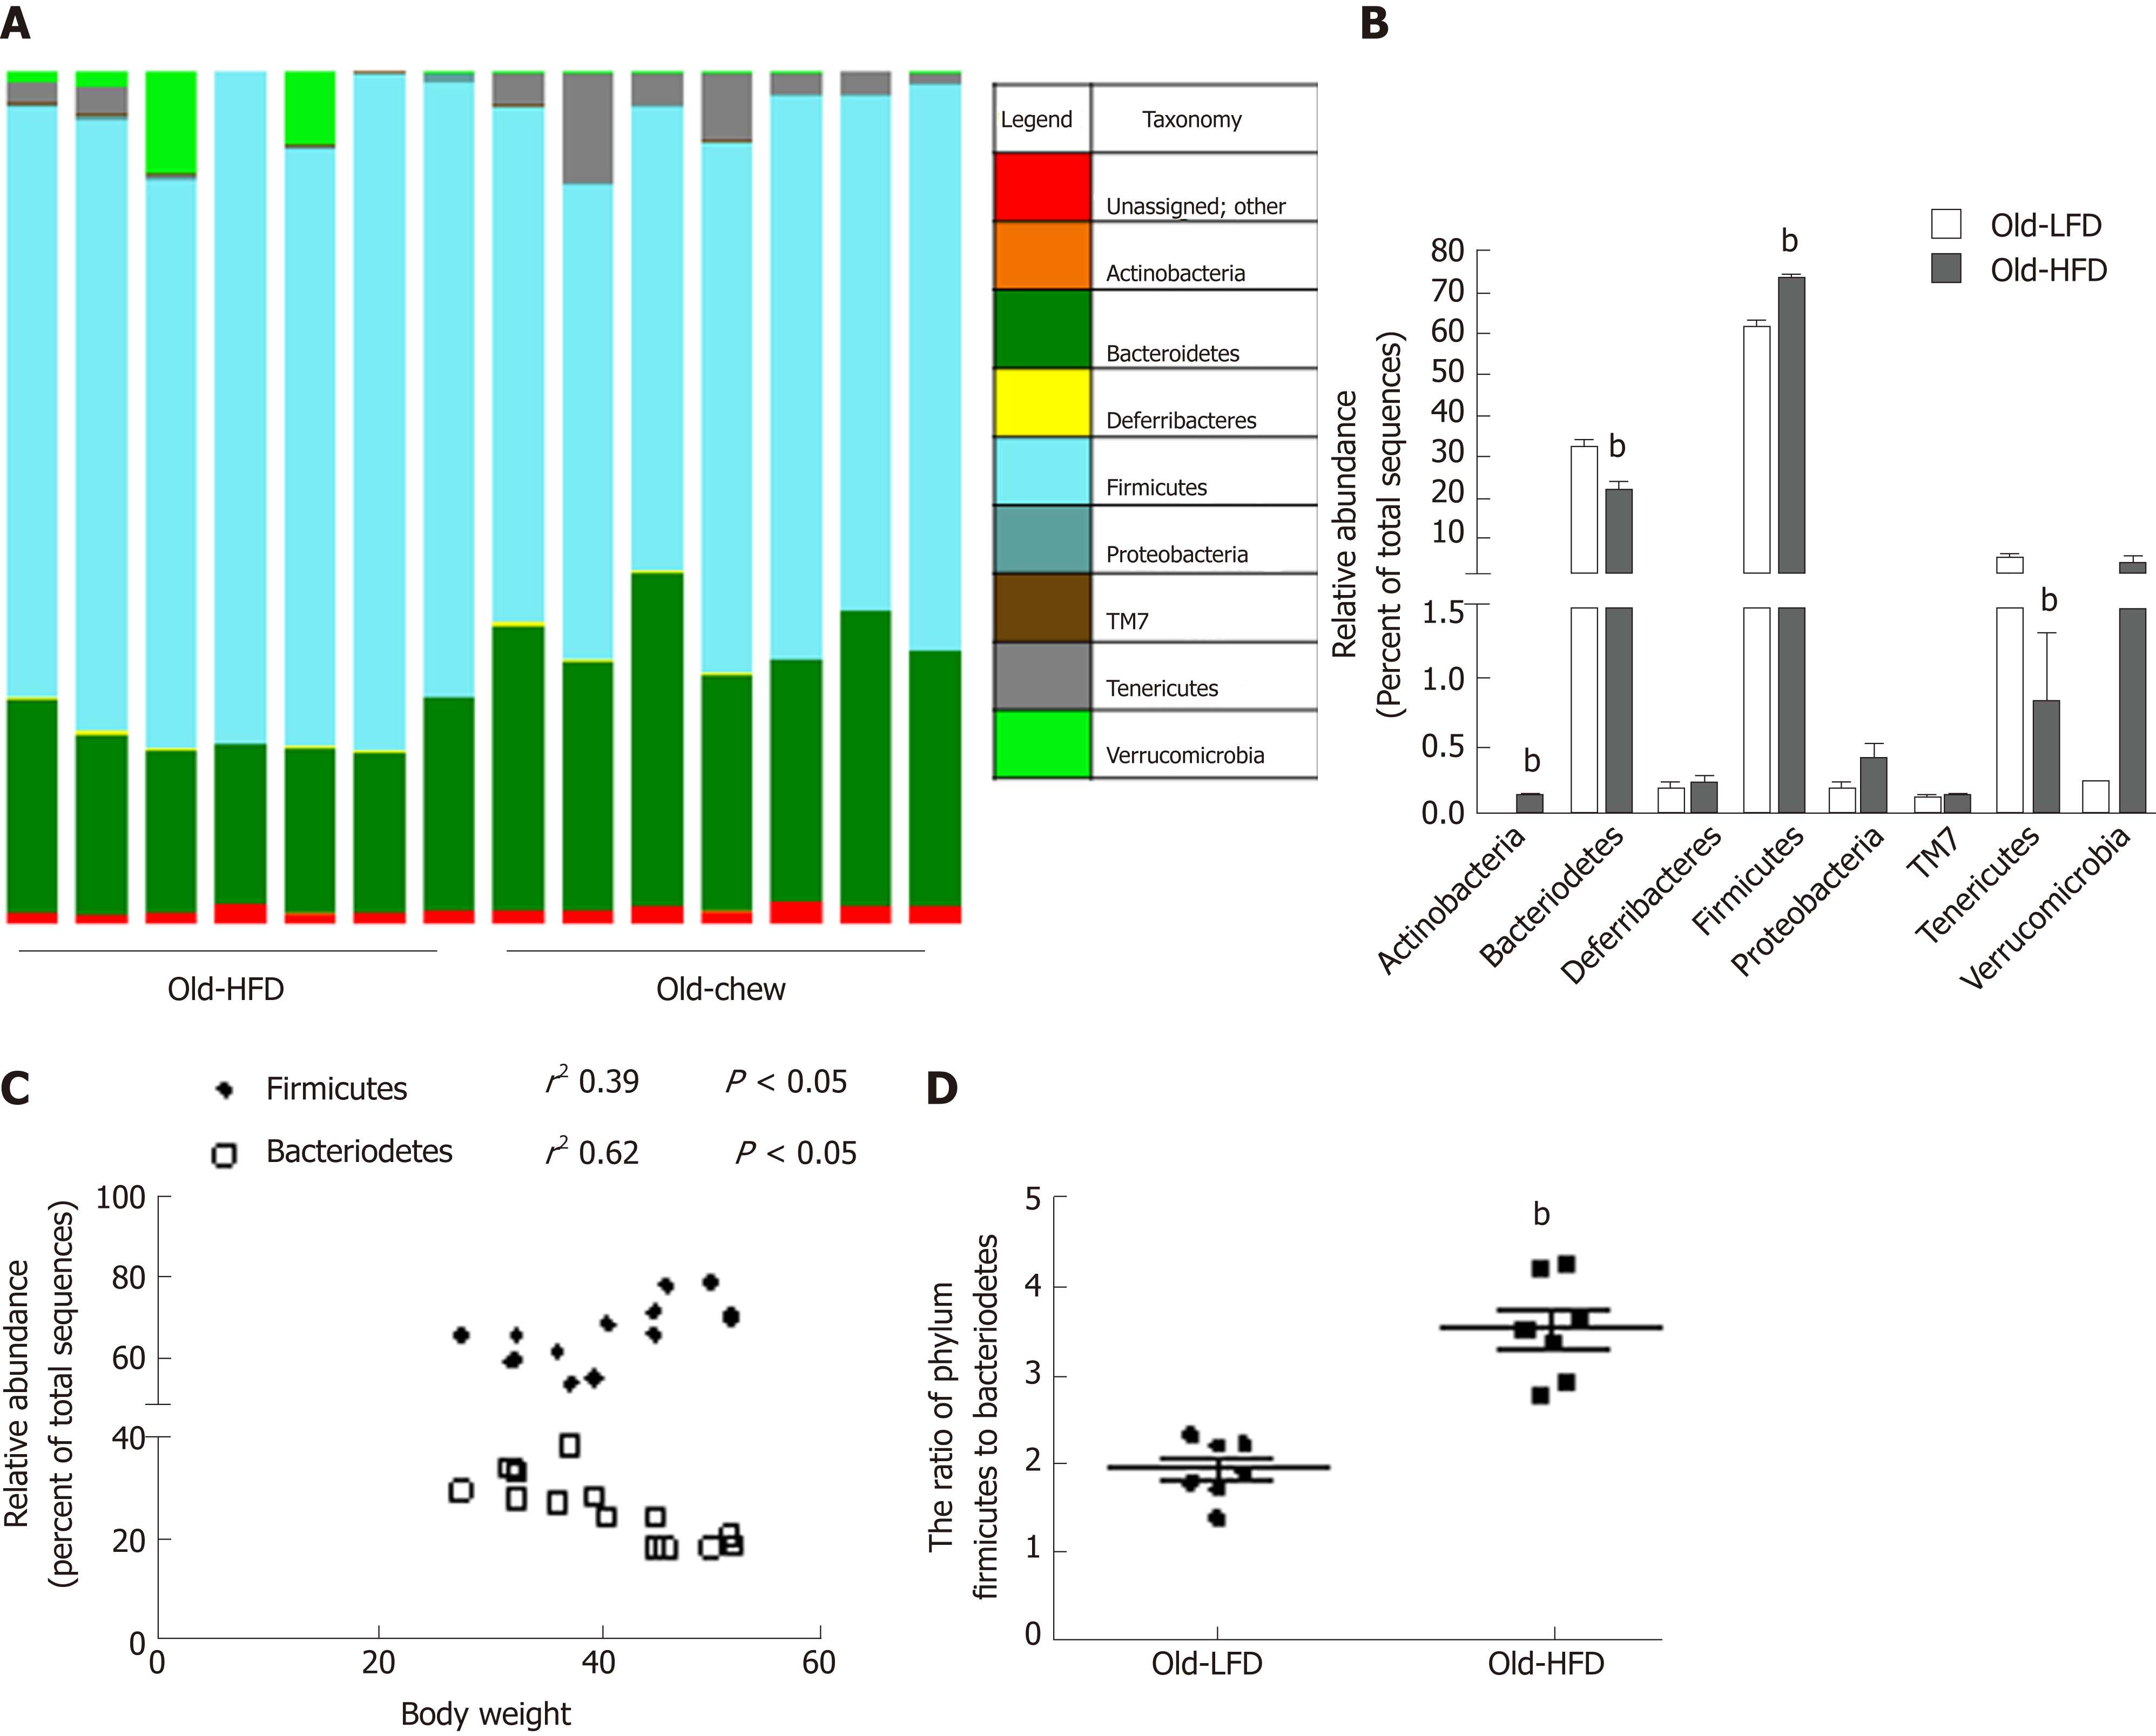
Figure 8 Relative abundance of gut microbial at the phylum level of mice subjected to prolonged high-fat diet-feeding.
A: Bar chart presenting the relative abundance of operational taxonomic units in bacterial phyla; B: Mean relative abundance of phyla; C: Mean relative ratio between firmicutes and bacteroidetes in Old-low-fat diet (LFD) and Old-high-fat diet-feeding (HFD) mice; D: Correlation between mean relative abundance of firmicutes and bacteroidetes and mouse body weight. Data are expressed as mean ± SE. n = 7 mice per group. bSignificantly different from Old-LFD (P < 0.05). HFD: High-fat diet-feeding; LFD: Low-fat diet.
- Citation: Velázquez KT, Enos RT, Bader JE, Sougiannis AT, Carson MS, Chatzistamou I, Carson JA, Nagarkatti PS, Nagarkatti M, Murphy EA. Prolonged high-fat-diet feeding promotes non-alcoholic fatty liver disease and alters gut microbiota in mice. World J Hepatol 2019; 11(8): 619-637
- URL: https://www.wjgnet.com/1948-5182/full/v11/i8/619.htm
- DOI: https://dx.doi.org/10.4254/wjh.v11.i8.619


