Copyright
©The Author(s) 2019.
World J Hepatol. Aug 27, 2019; 11(8): 619-637
Published online Aug 27, 2019. doi: 10.4254/wjh.v11.i8.619
Published online Aug 27, 2019. doi: 10.4254/wjh.v11.i8.619
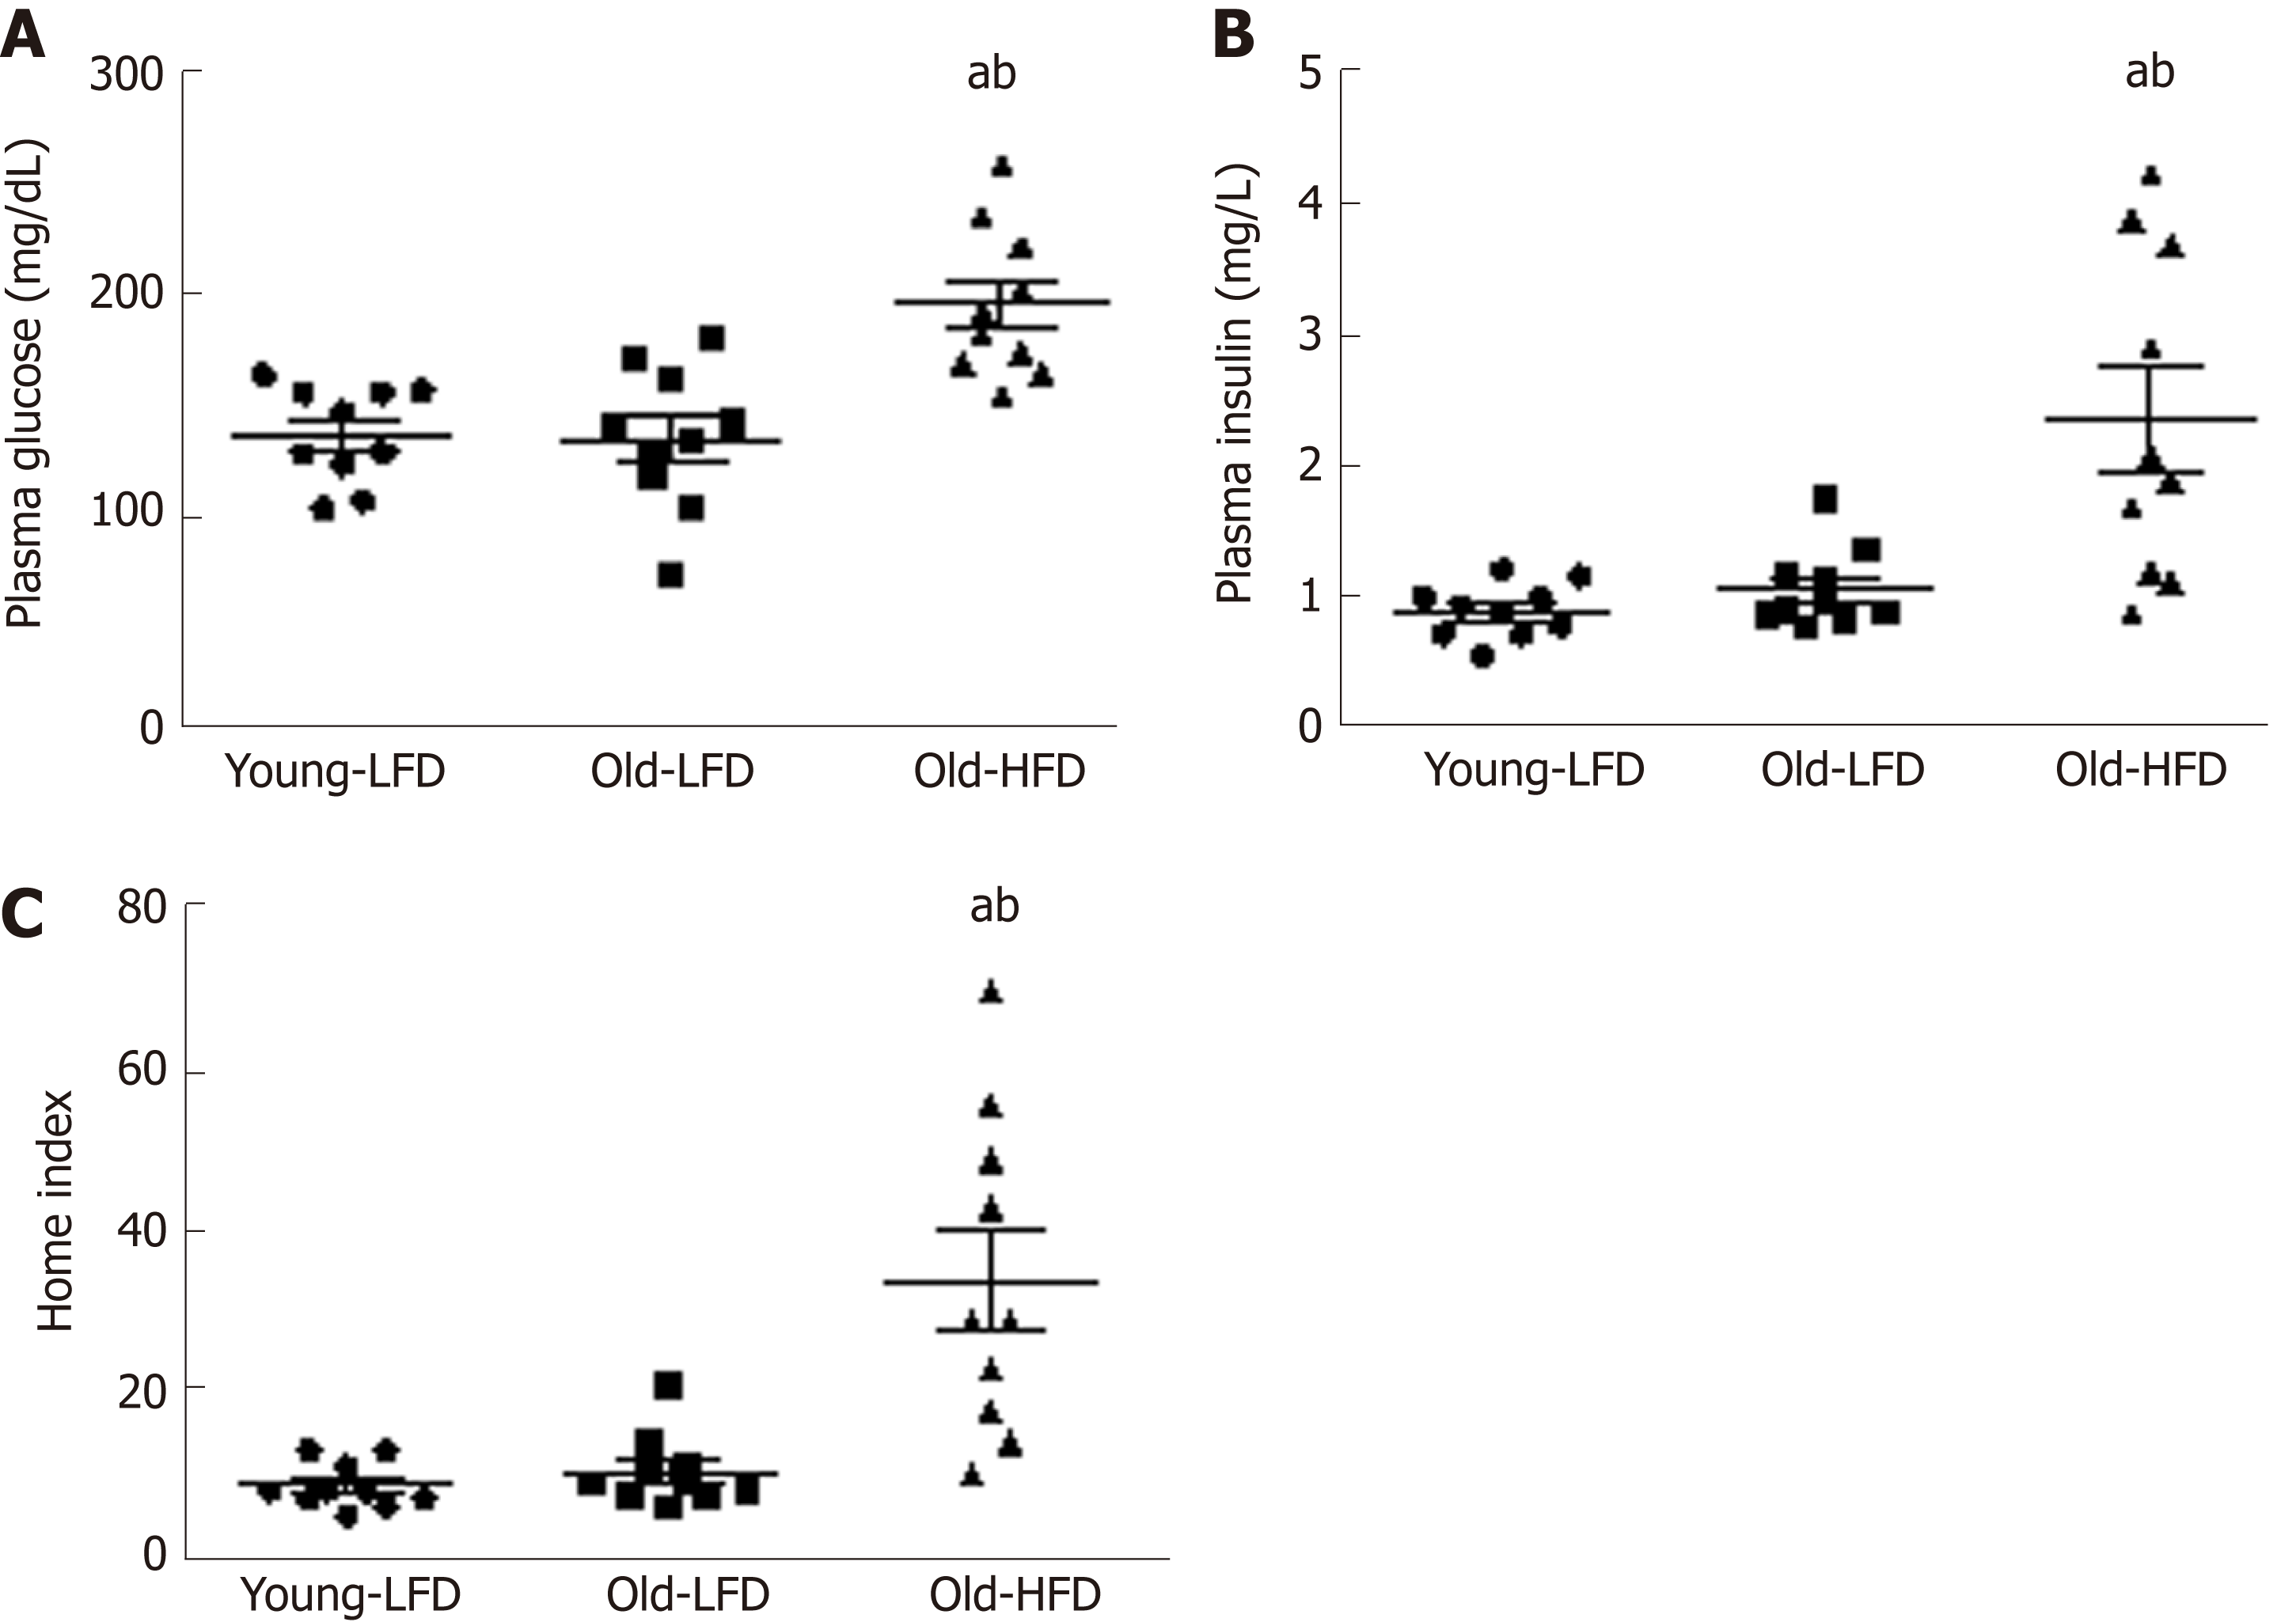
Figure 2 Metabolic characterization of mice subjected to prolonged high-fat diet-feeding.
A: Five hours fasting blood glucose; B: Five hours fasting plasma insulin; C: Homeostasis model of assessment-insulin resistance index. Data are expressed as mean ± SE. n = 10 mice per group. aSignificantly different from Young-LFD (P < 0.05). bSignificantly different from Old-LFD (P < 0.05). HOMA-IR: Homeostasis model of assessment-insulin resistance; LFD: Low-fat diet.
- Citation: Velázquez KT, Enos RT, Bader JE, Sougiannis AT, Carson MS, Chatzistamou I, Carson JA, Nagarkatti PS, Nagarkatti M, Murphy EA. Prolonged high-fat-diet feeding promotes non-alcoholic fatty liver disease and alters gut microbiota in mice. World J Hepatol 2019; 11(8): 619-637
- URL: https://www.wjgnet.com/1948-5182/full/v11/i8/619.htm
- DOI: https://dx.doi.org/10.4254/wjh.v11.i8.619


