Copyright
©The Author(s) 2025.
World J Stem Cells. May 26, 2025; 17(5): 101675
Published online May 26, 2025. doi: 10.4252/wjsc.v17.i5.101675
Published online May 26, 2025. doi: 10.4252/wjsc.v17.i5.101675
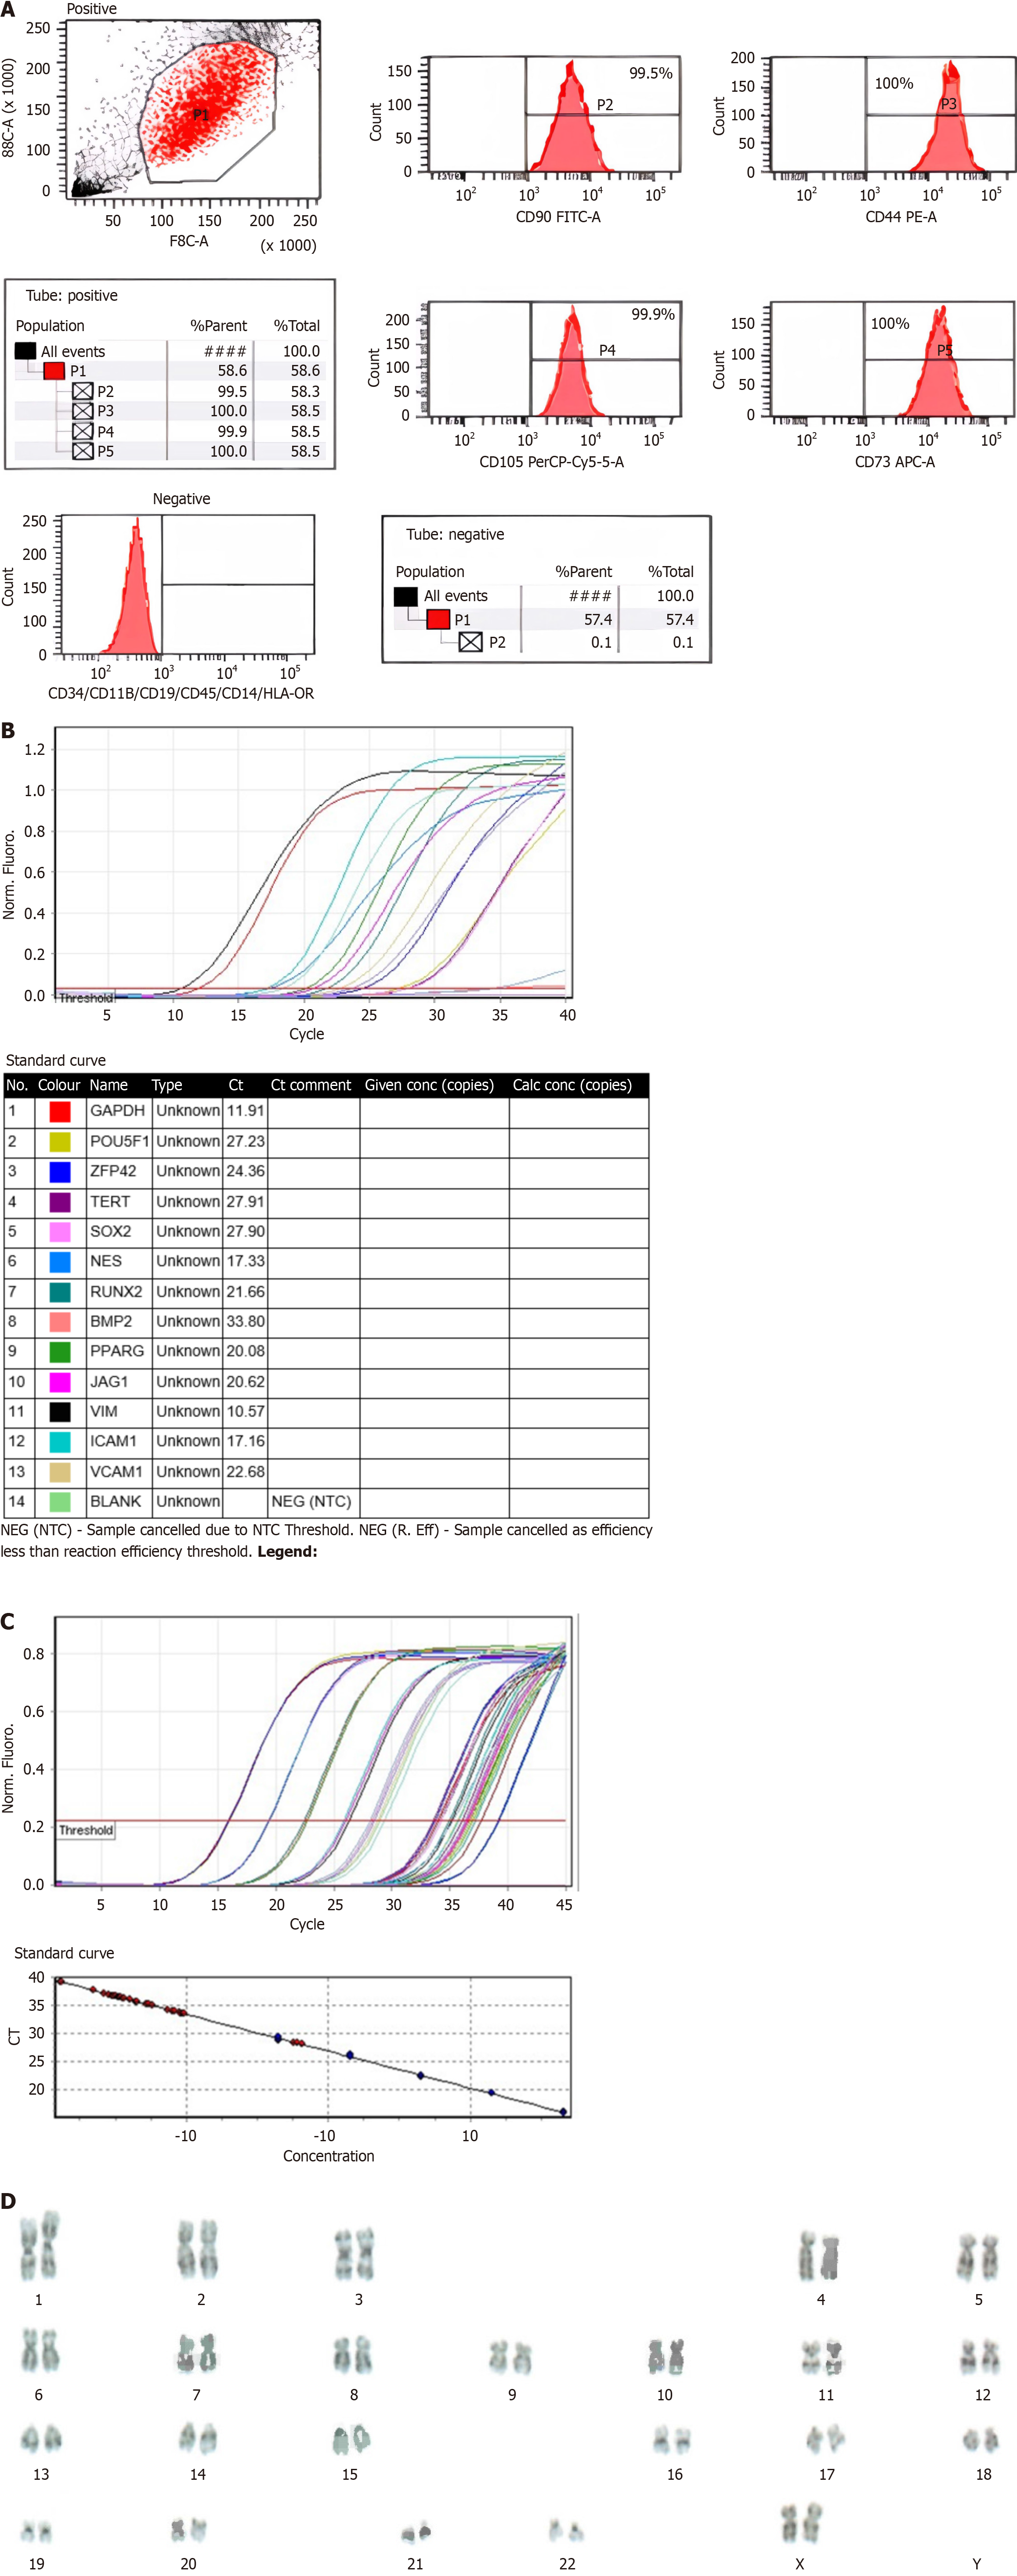
Figure 1 Wharton’s jelly derived mesenchymal stem cell flow cytometry, gene expression, telomerase activity, and karyotyping.
A: Wharton’s jelly-derived mesenchymal stem cell (WJ-MSC) flow cytometry. Positive marker values (CD90, CD105, CD73, and CD44) are above 95%. Negative marker values (CD45, CD34, CD19, CD11B, human leukocyte antigen DR, and CD14) are below 2%; B: WJ-MSC gene expression. In the gene expression test for MSCs, SOX2, OCT4, TERT, REX1, NES, RUNX2, PPARG, JAG1, ICAM1, VCAM1, and VIM had Ct values below 29 and were strongly positive. BMP2 had a Ct between 30-37 and was positive; C: WJ-MSC telomerase activity. In the telomerase activity assay of WJ-MSCs, the telomerase activity of the cell was not as high as the positive control; D: WJ-MSC karyotyping. Chromosomal analysis of metaphases obtained from WJ-MSCs after short-term cell culture using GPL banding revealed no numerical or gross structural chromosomal abnormalities. HLA: Human leukocyte antigen.
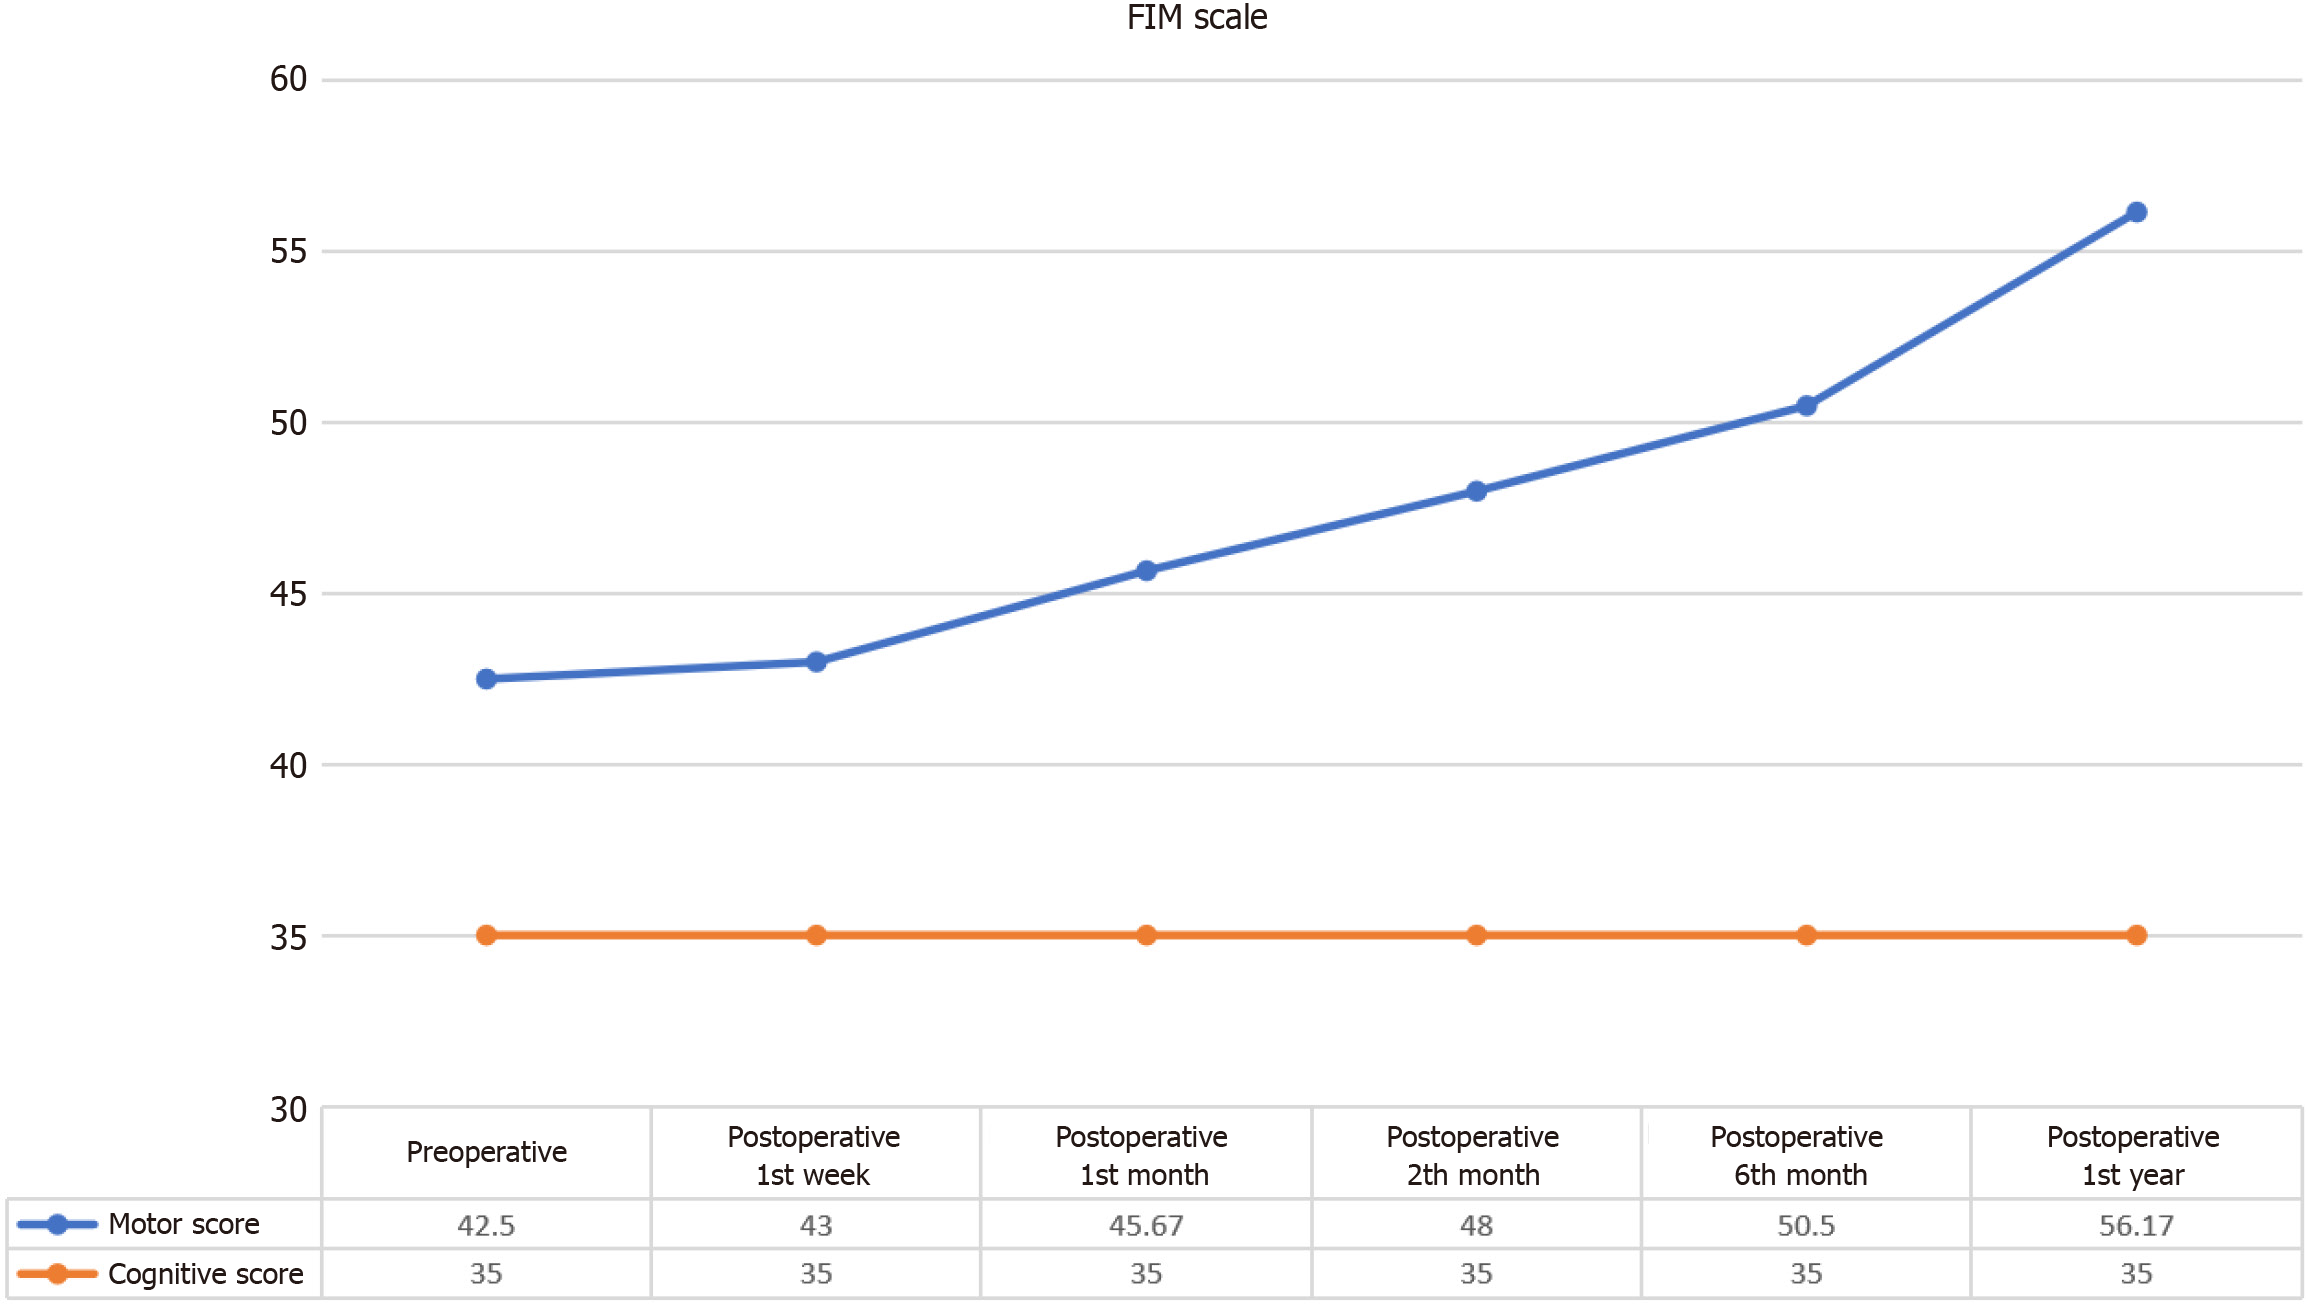
Figure 2 Changes in the Functional Independence Measure Motor scores following intervention.
This figure shows significant improvements in the Functional Independence Measure Motor scores at 1 month, 2 months, 4 months, and 1 year following intervention (χ² = 29.505, P < 0.001). Notable improvements were observed at 1 month (P = 0.039), 2 months (P = 0.026), and 4 months (P = 0.027), with sustained gains through 1 year (P = 0.027). FIM: Functional Independence Measure.
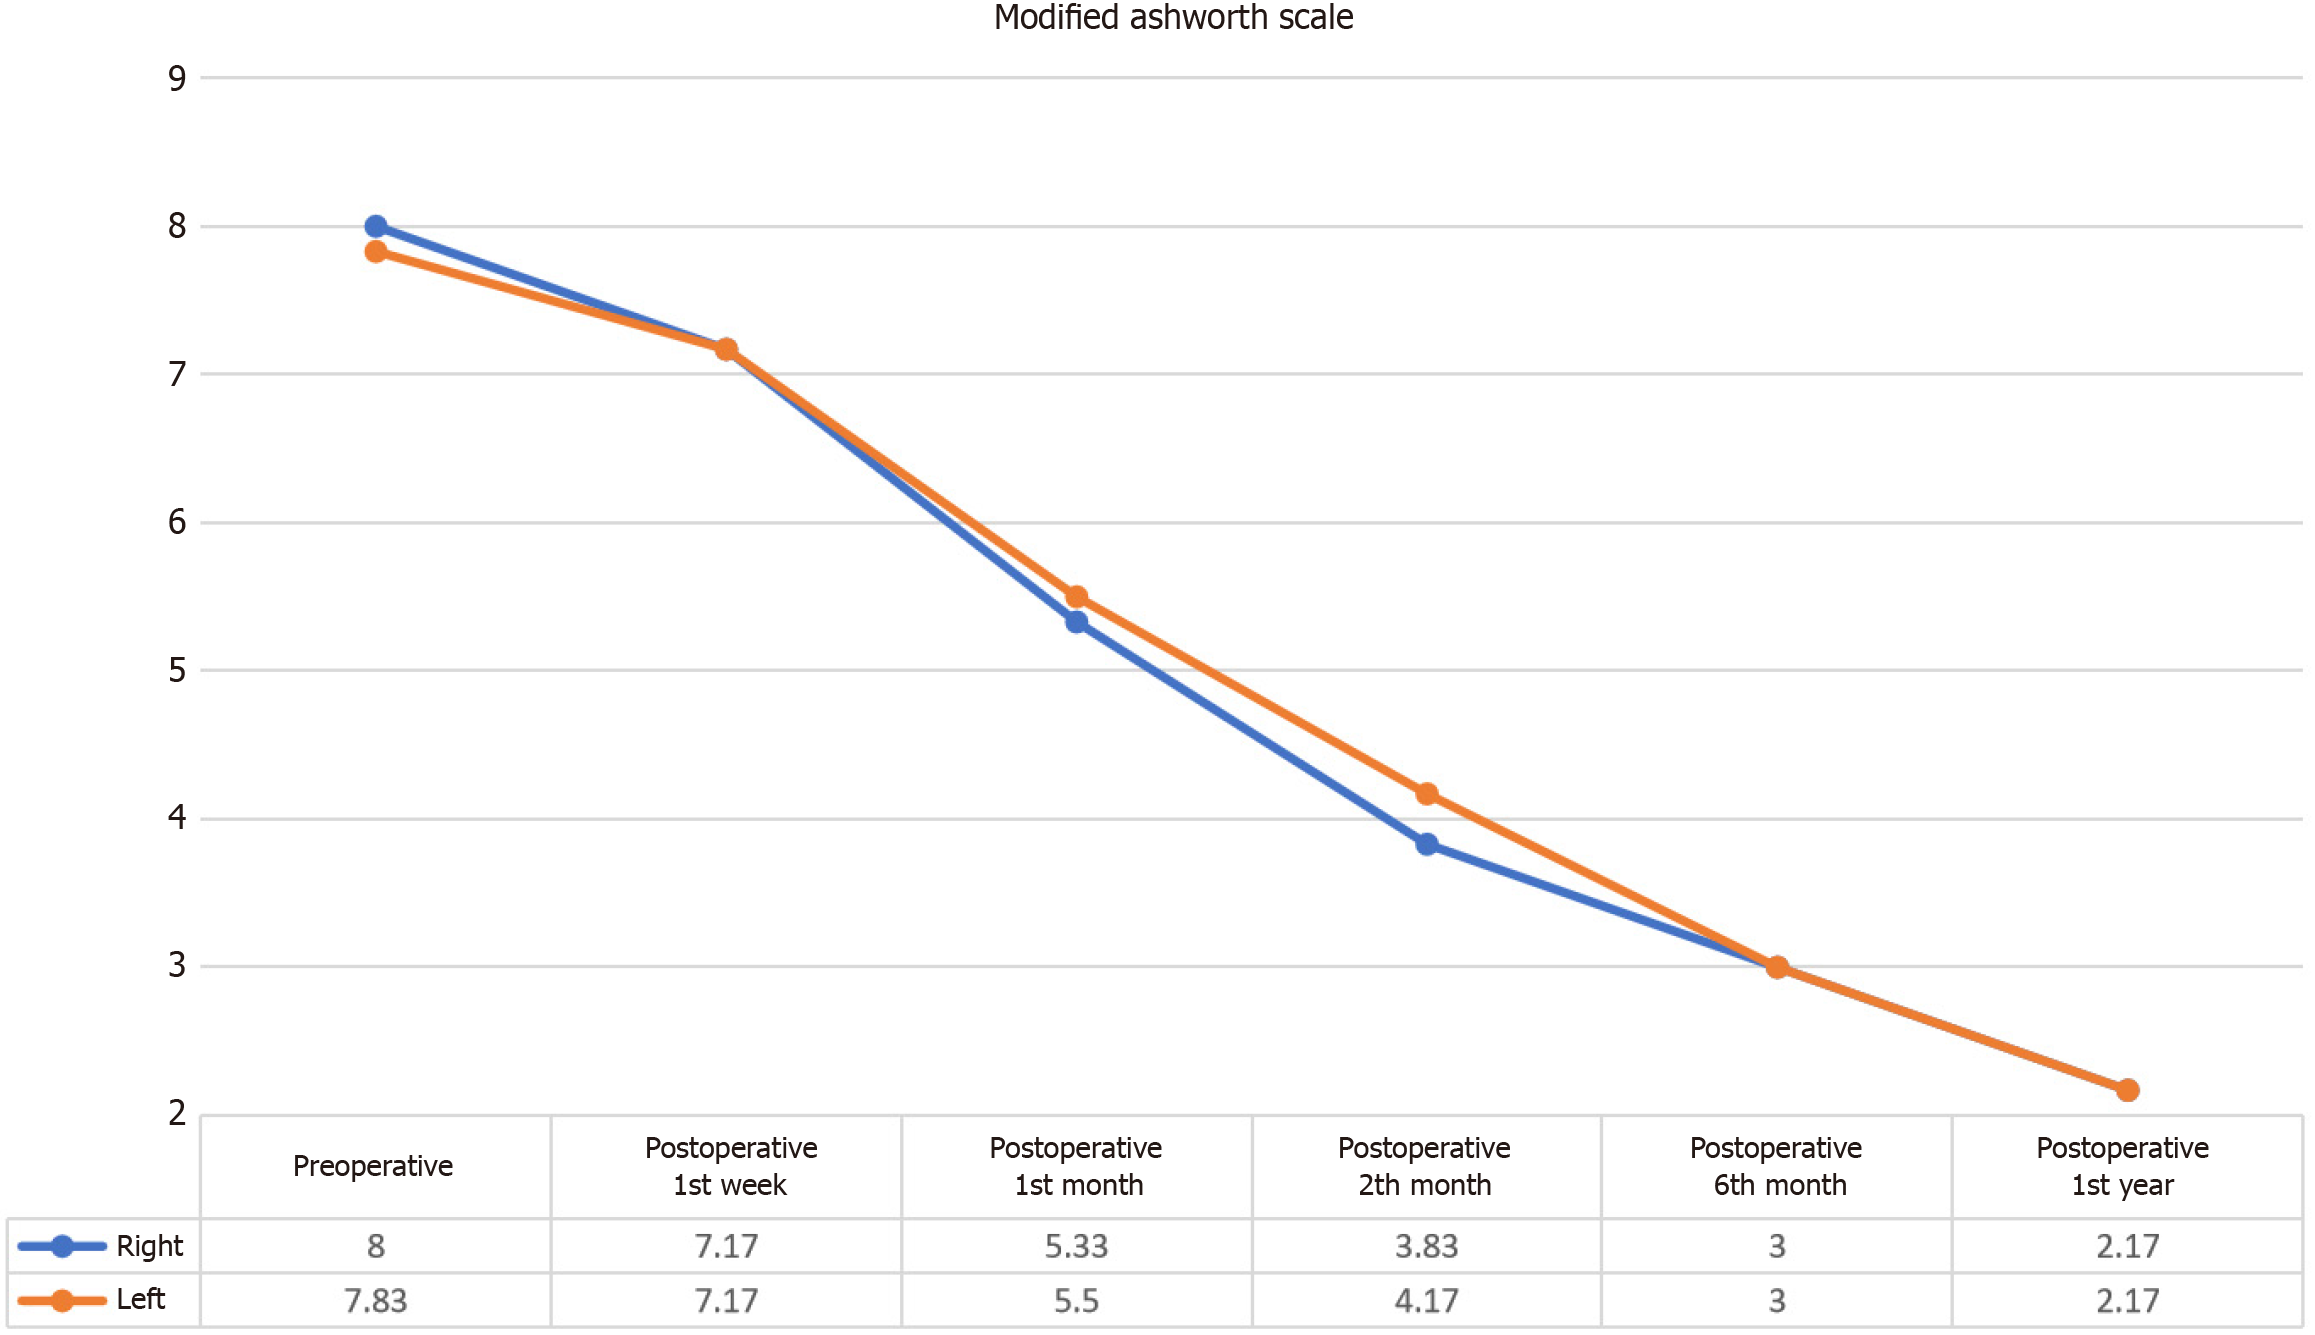
Figure 3 Changes in spasticity as measured by the Modified Ashworth scale.
This figure illustrates the significant reduction in spasticity in both the right and left lower extremities following intervention. Statistically significant decreases in the Modified Ashworth scale scores were observed at 1 month, 2 months, 4 months, and 1 year for both extremities (right: χ² = 28.452, P < 0.001; left: χ² = 29.030, P < 0.001).
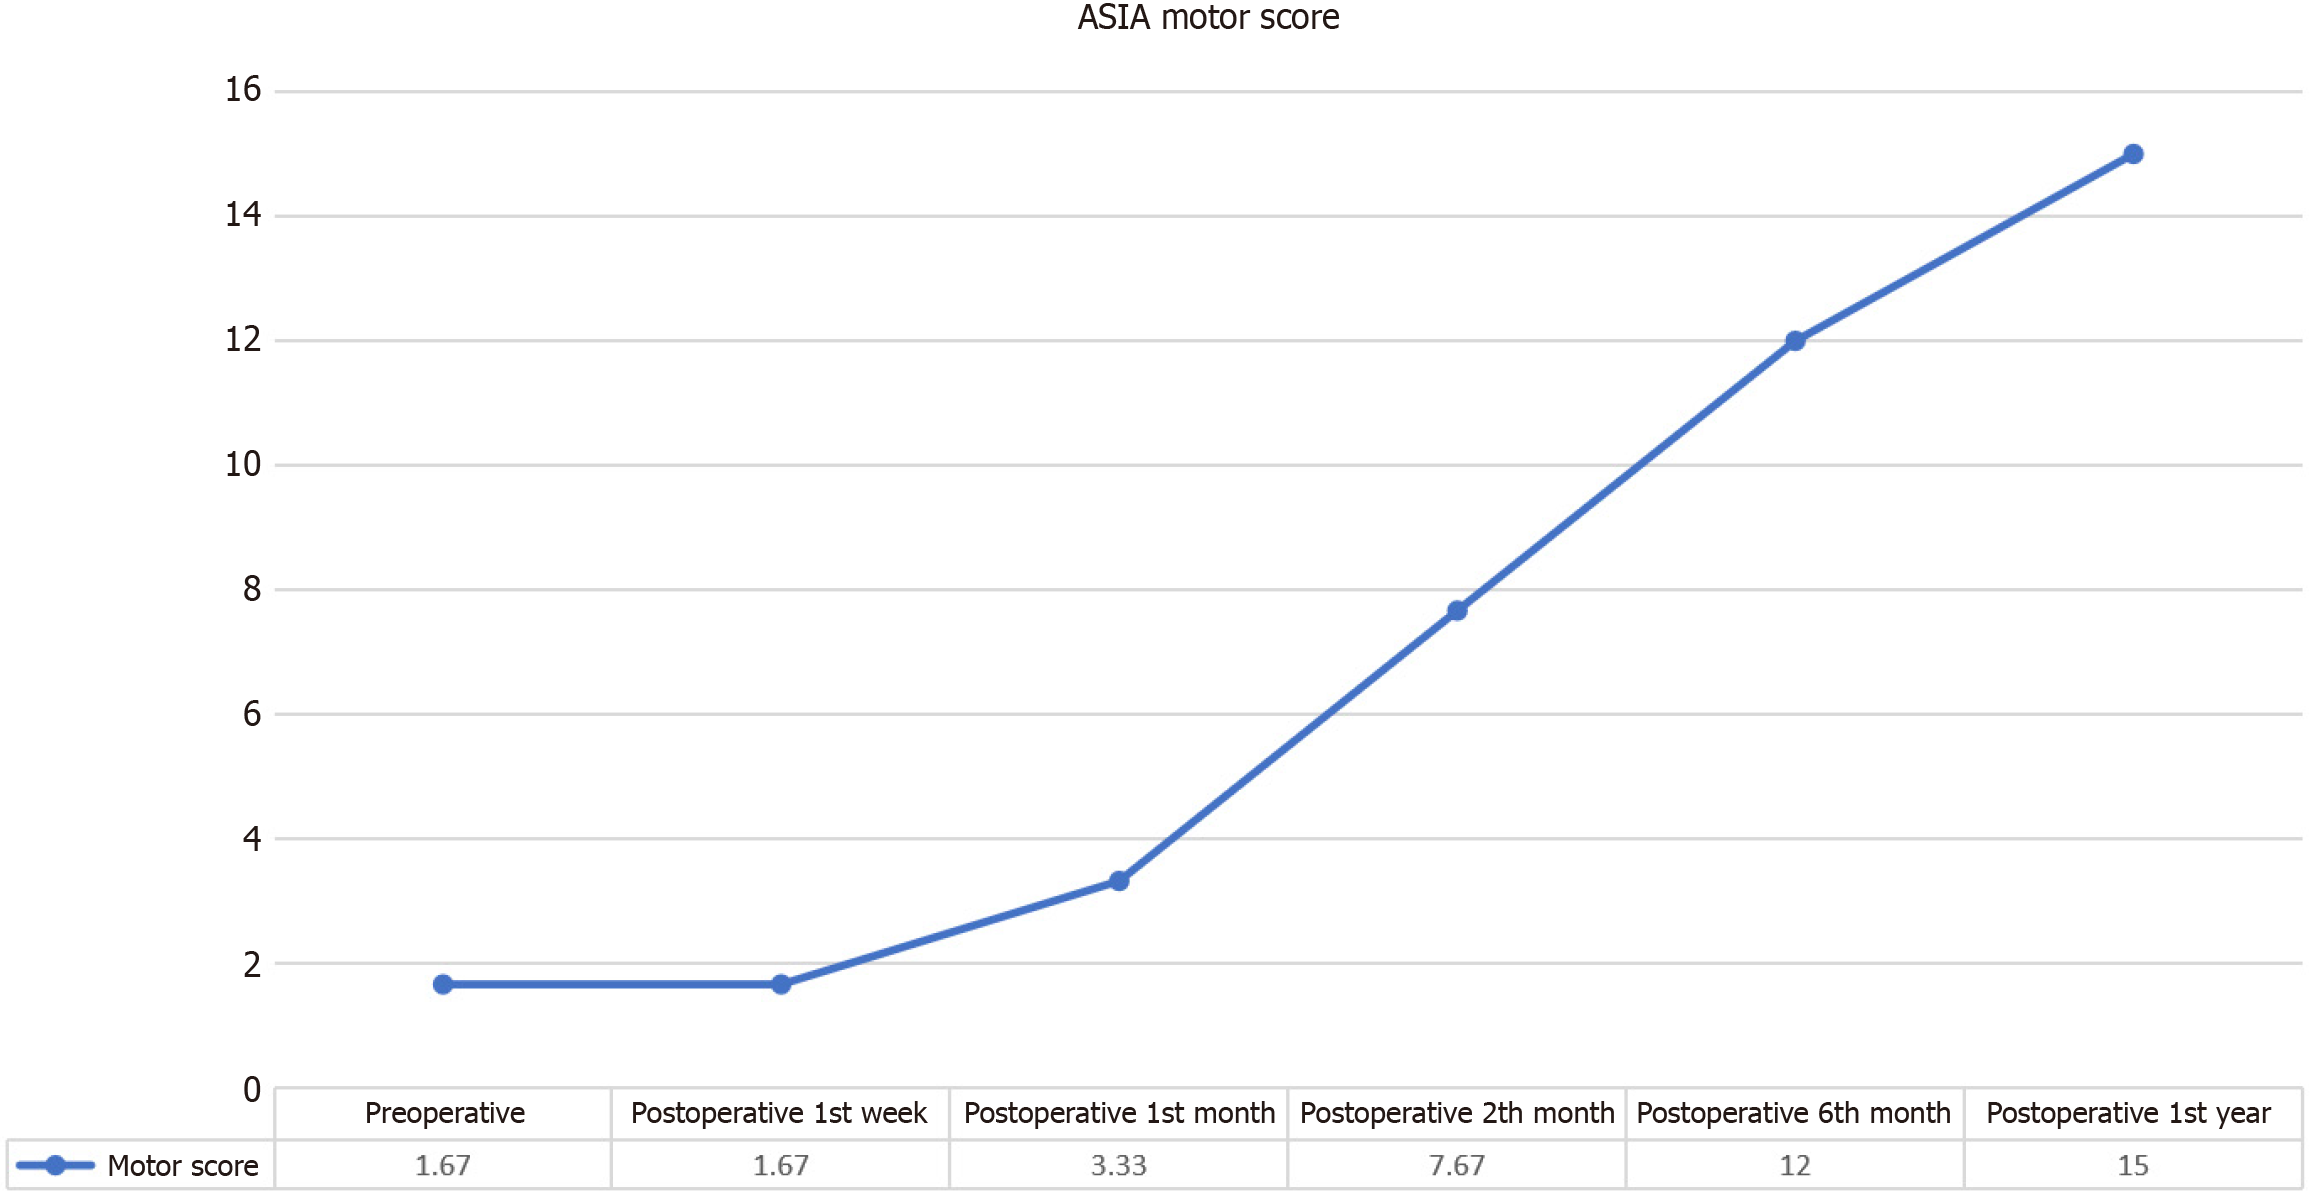
Figure 4 Changes in the American Spinal Injury Association Motor scores over time.
This figure shows significant and progressive improvements in the American Spinal Injury Association Motor scores following intervention (χ² = 23.938, P < 0.001). ASIA: American Spinal Injury Association.
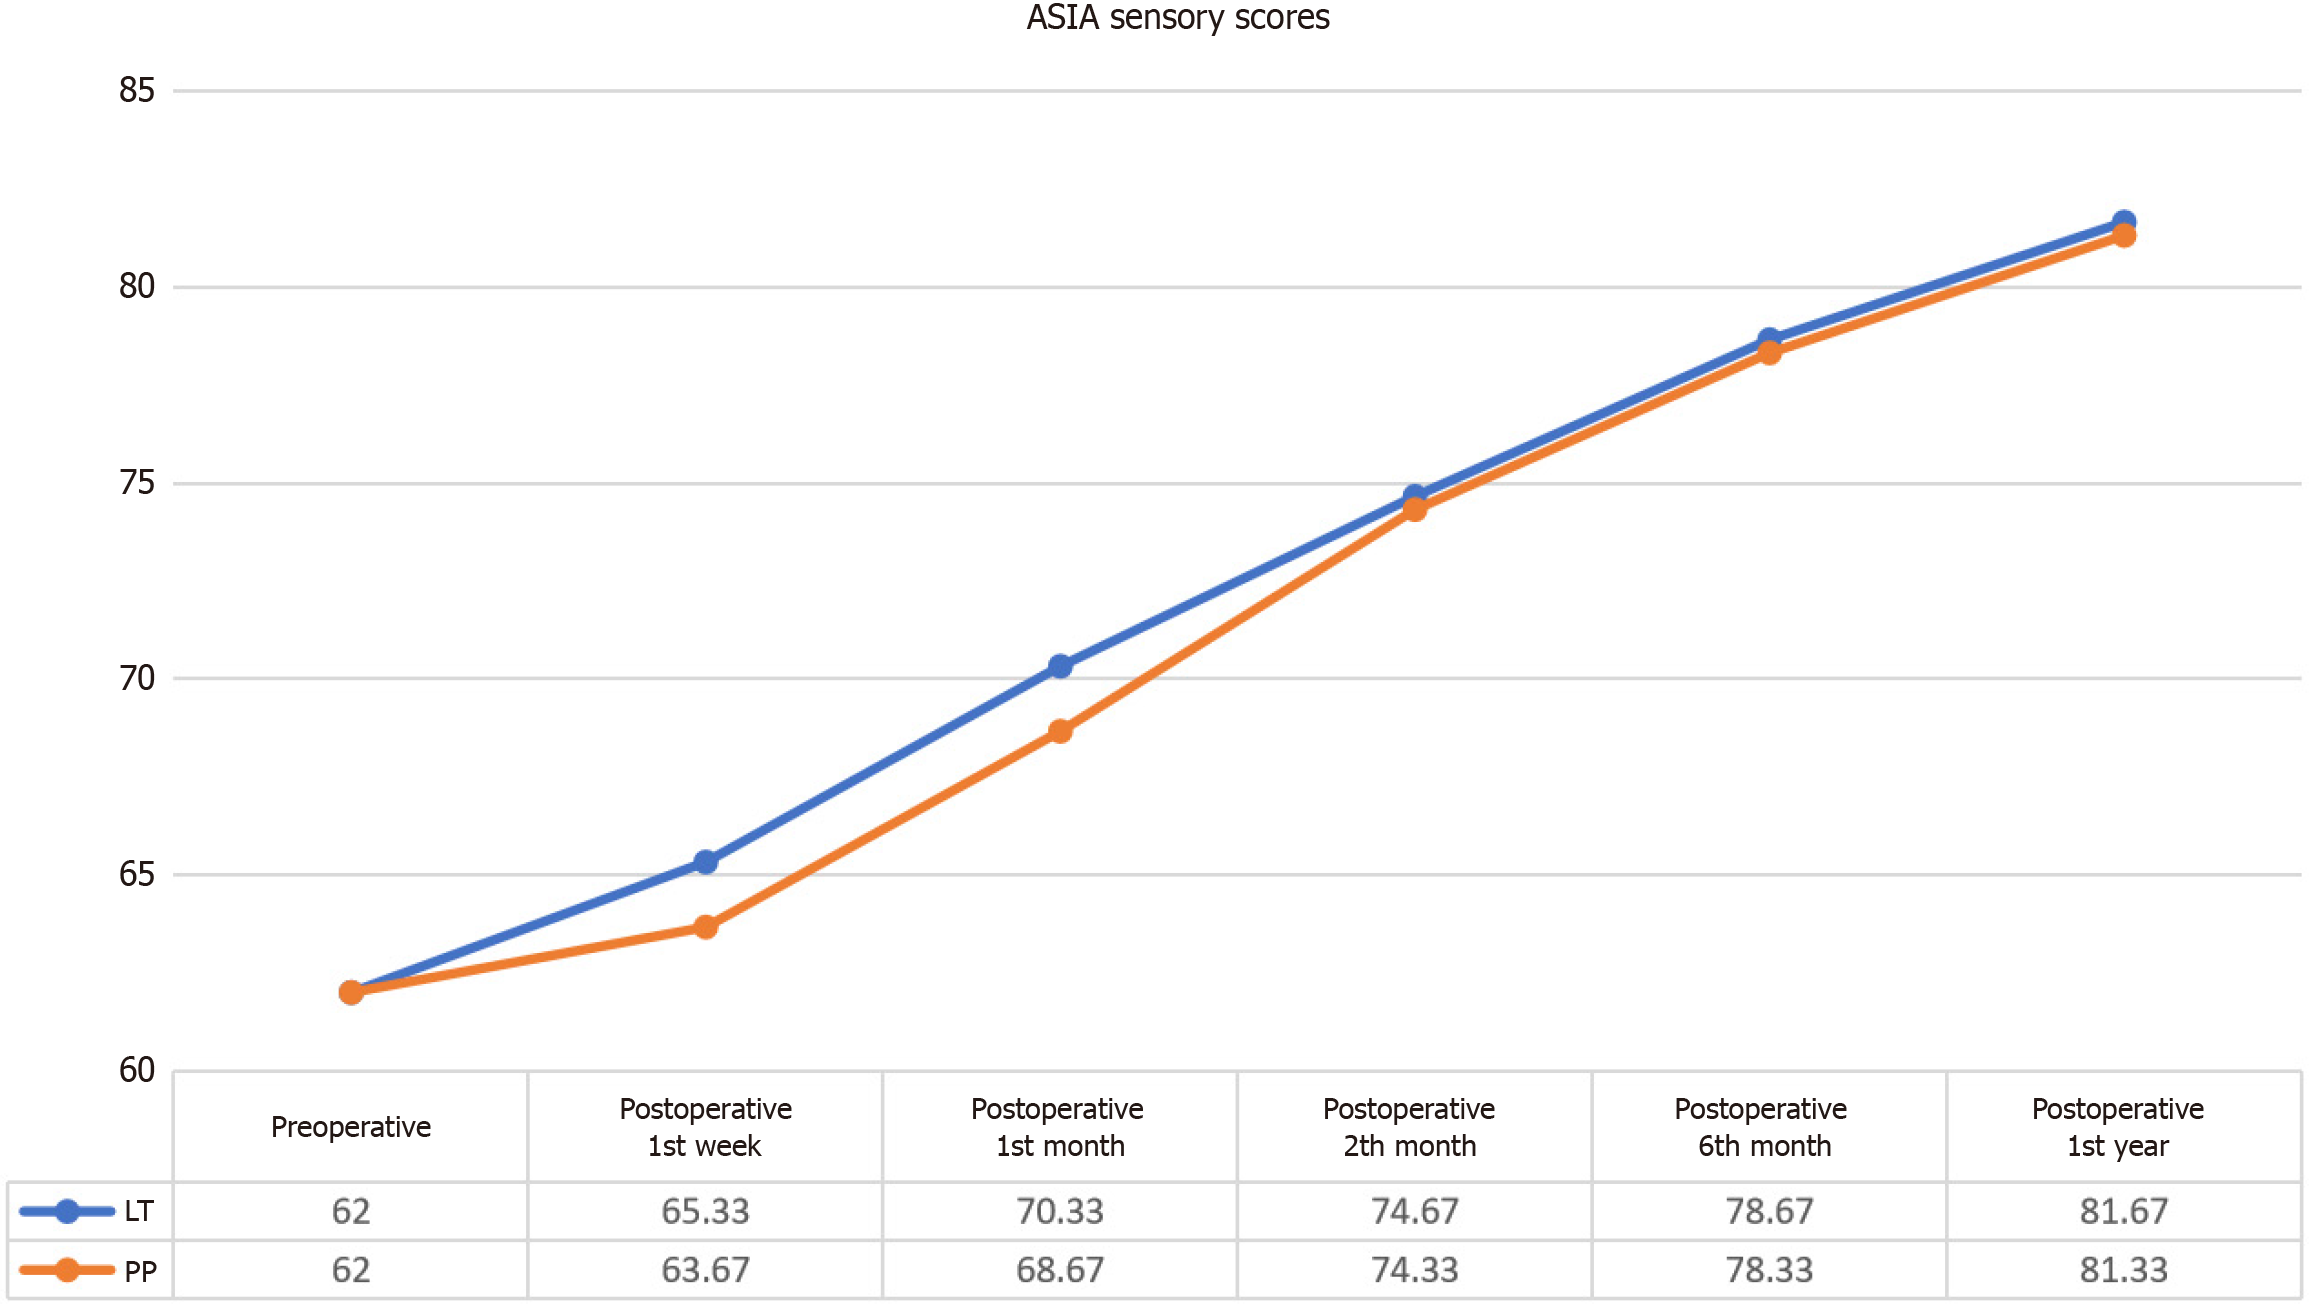
Figure 5 Changes in the American Spinal Injury Association Sensory scores over time.
This figure shows significant improvements in American Spinal Injury Association Sensory Scores for both Light Touch and Pin-Prick modalities following intervention (Light Touch: χ² = 28.299, P < 0.001; Pin-Prick: χ² = 28.838, P < 0.001). For both modalities, indicating a progressive improvement in sensory function over time. ASIA: American Spinal Injury Association; LT: Light Touch; PP: Pin-Prick.
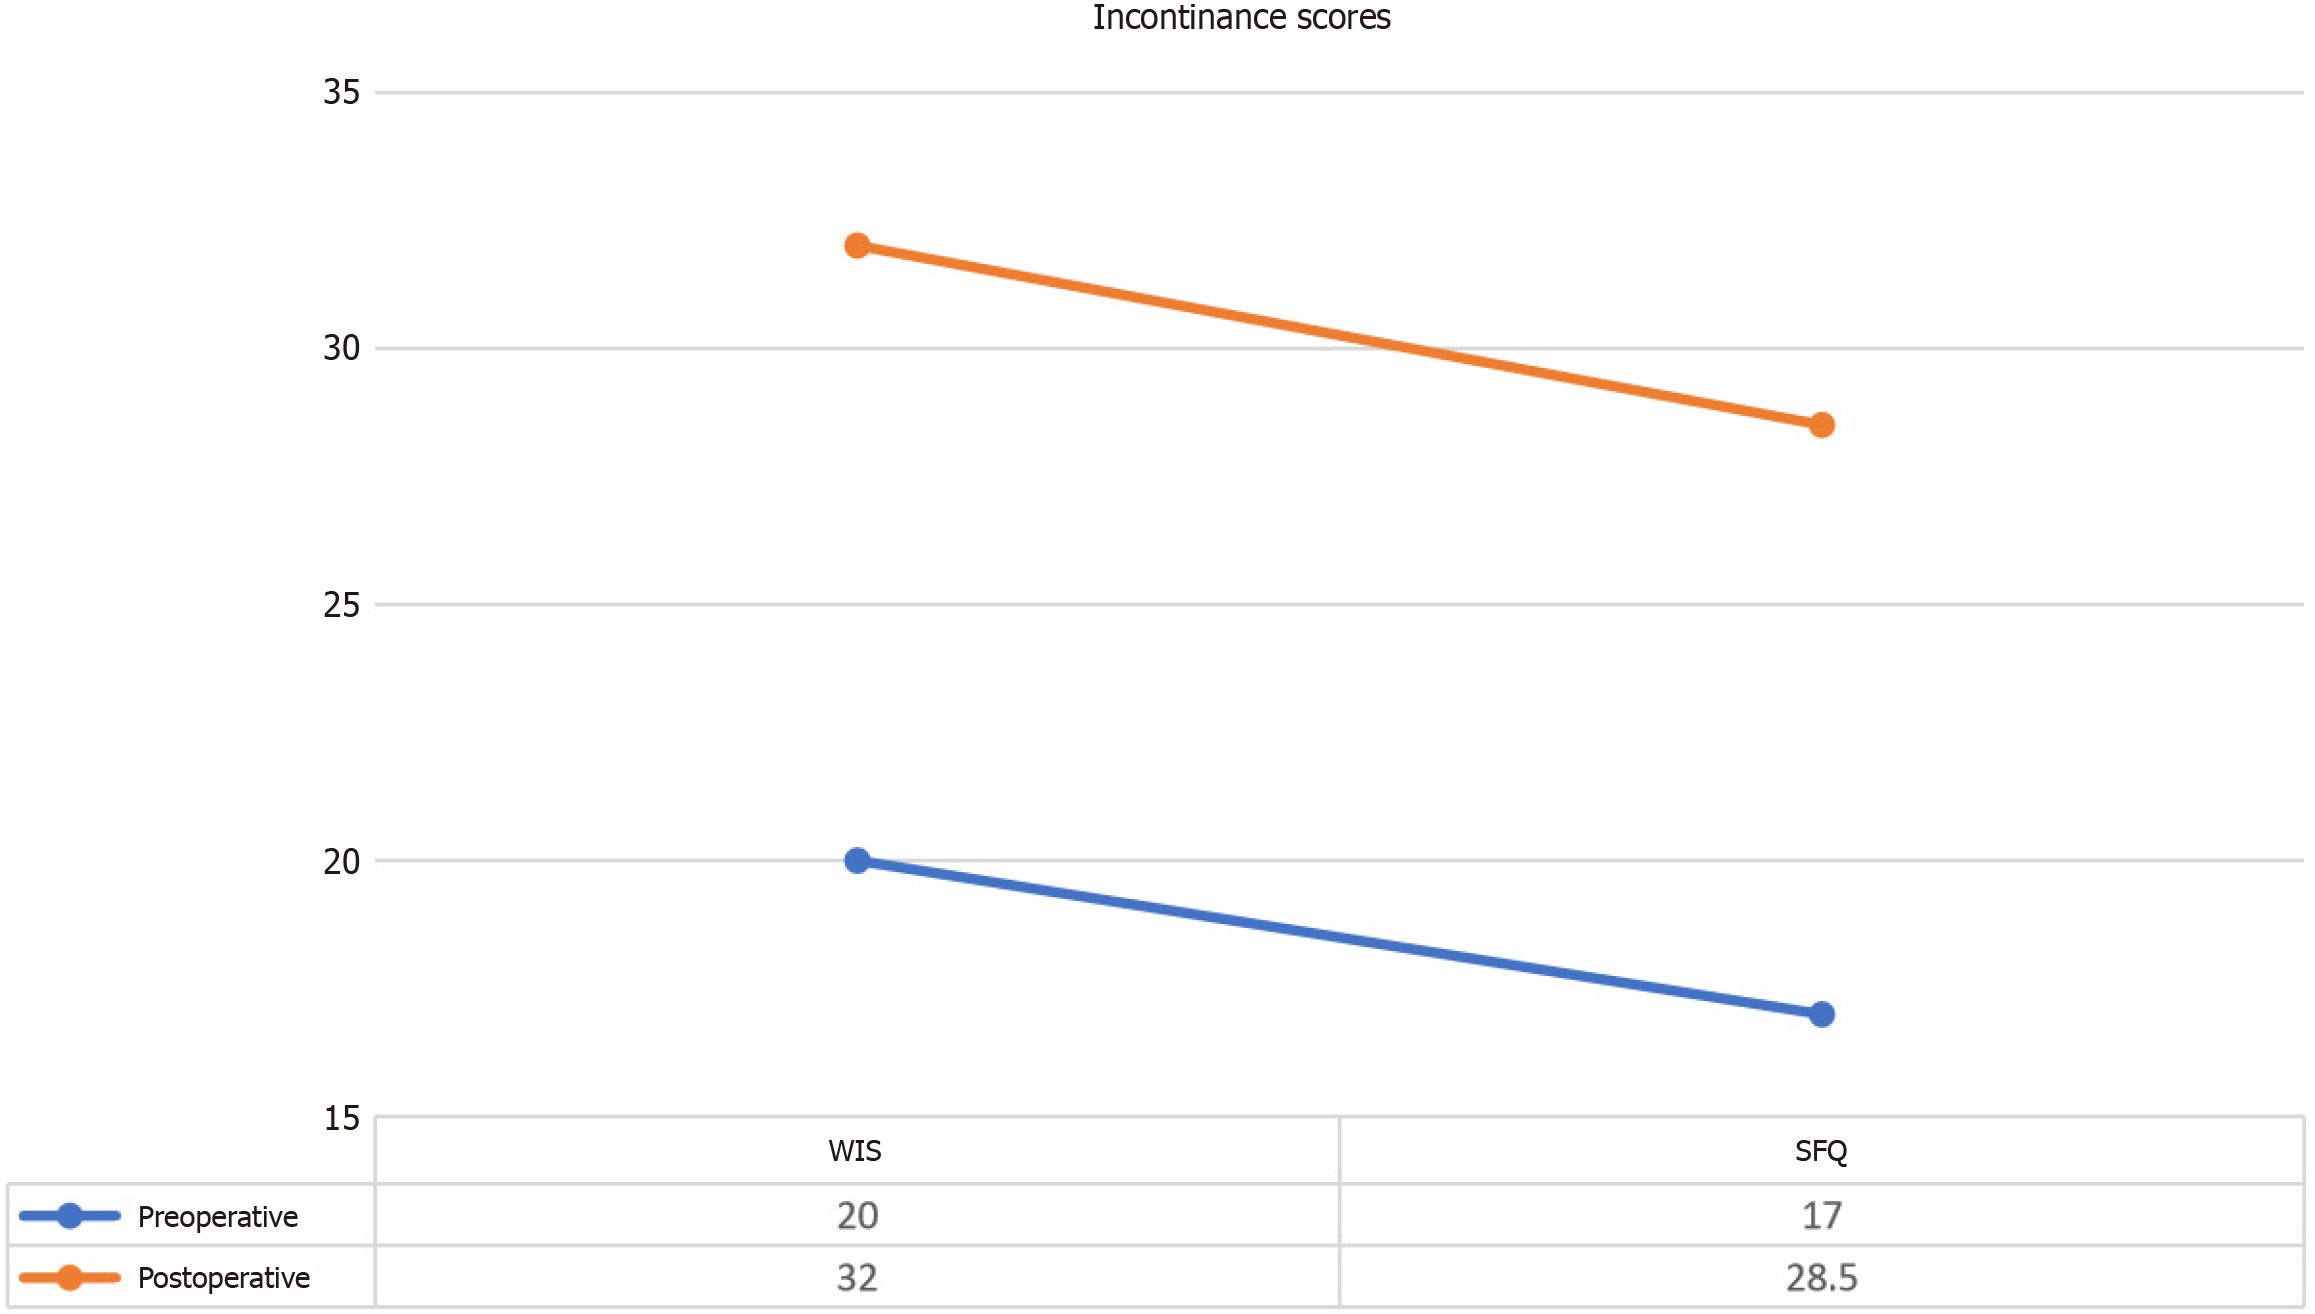
Figure 6 Changes in the incontinence scores (Wexner Incontinence Score and Qualiveen Short Form) following intervention.
This figure shows significant improvements in incontinence scores following intervention, as measured by the Wexner Incontinence Score (z = -2.226, P < 0.05) for bowel incontinence and the Qualiveen Short Form (z = -2.214, P < 0.05) for urinary incontinence. WIS: Wexner Incontinence Score; SFQ: Qualiveen Short Form.
- Citation: Kaplan N, Kabatas S, Civelek E, Savrunlu EC, Akkoc T, Boyalı O, Öztürk E, Can H, Genc A, Karaöz E. Multiroute administration of Wharton’s jelly mesenchymal stem cells in chronic complete spinal cord injury: A phase I safety and feasibility study. World J Stem Cells 2025; 17(5): 101675
- URL: https://www.wjgnet.com/1948-0210/full/v17/i5/101675.htm
- DOI: https://dx.doi.org/10.4252/wjsc.v17.i5.101675


