Copyright
©The Author(s) 2020.
World J Stem Cells. Dec 26, 2020; 12(12): 1652-1666
Published online Dec 26, 2020. doi: 10.4252/wjsc.v12.i12.1652
Published online Dec 26, 2020. doi: 10.4252/wjsc.v12.i12.1652
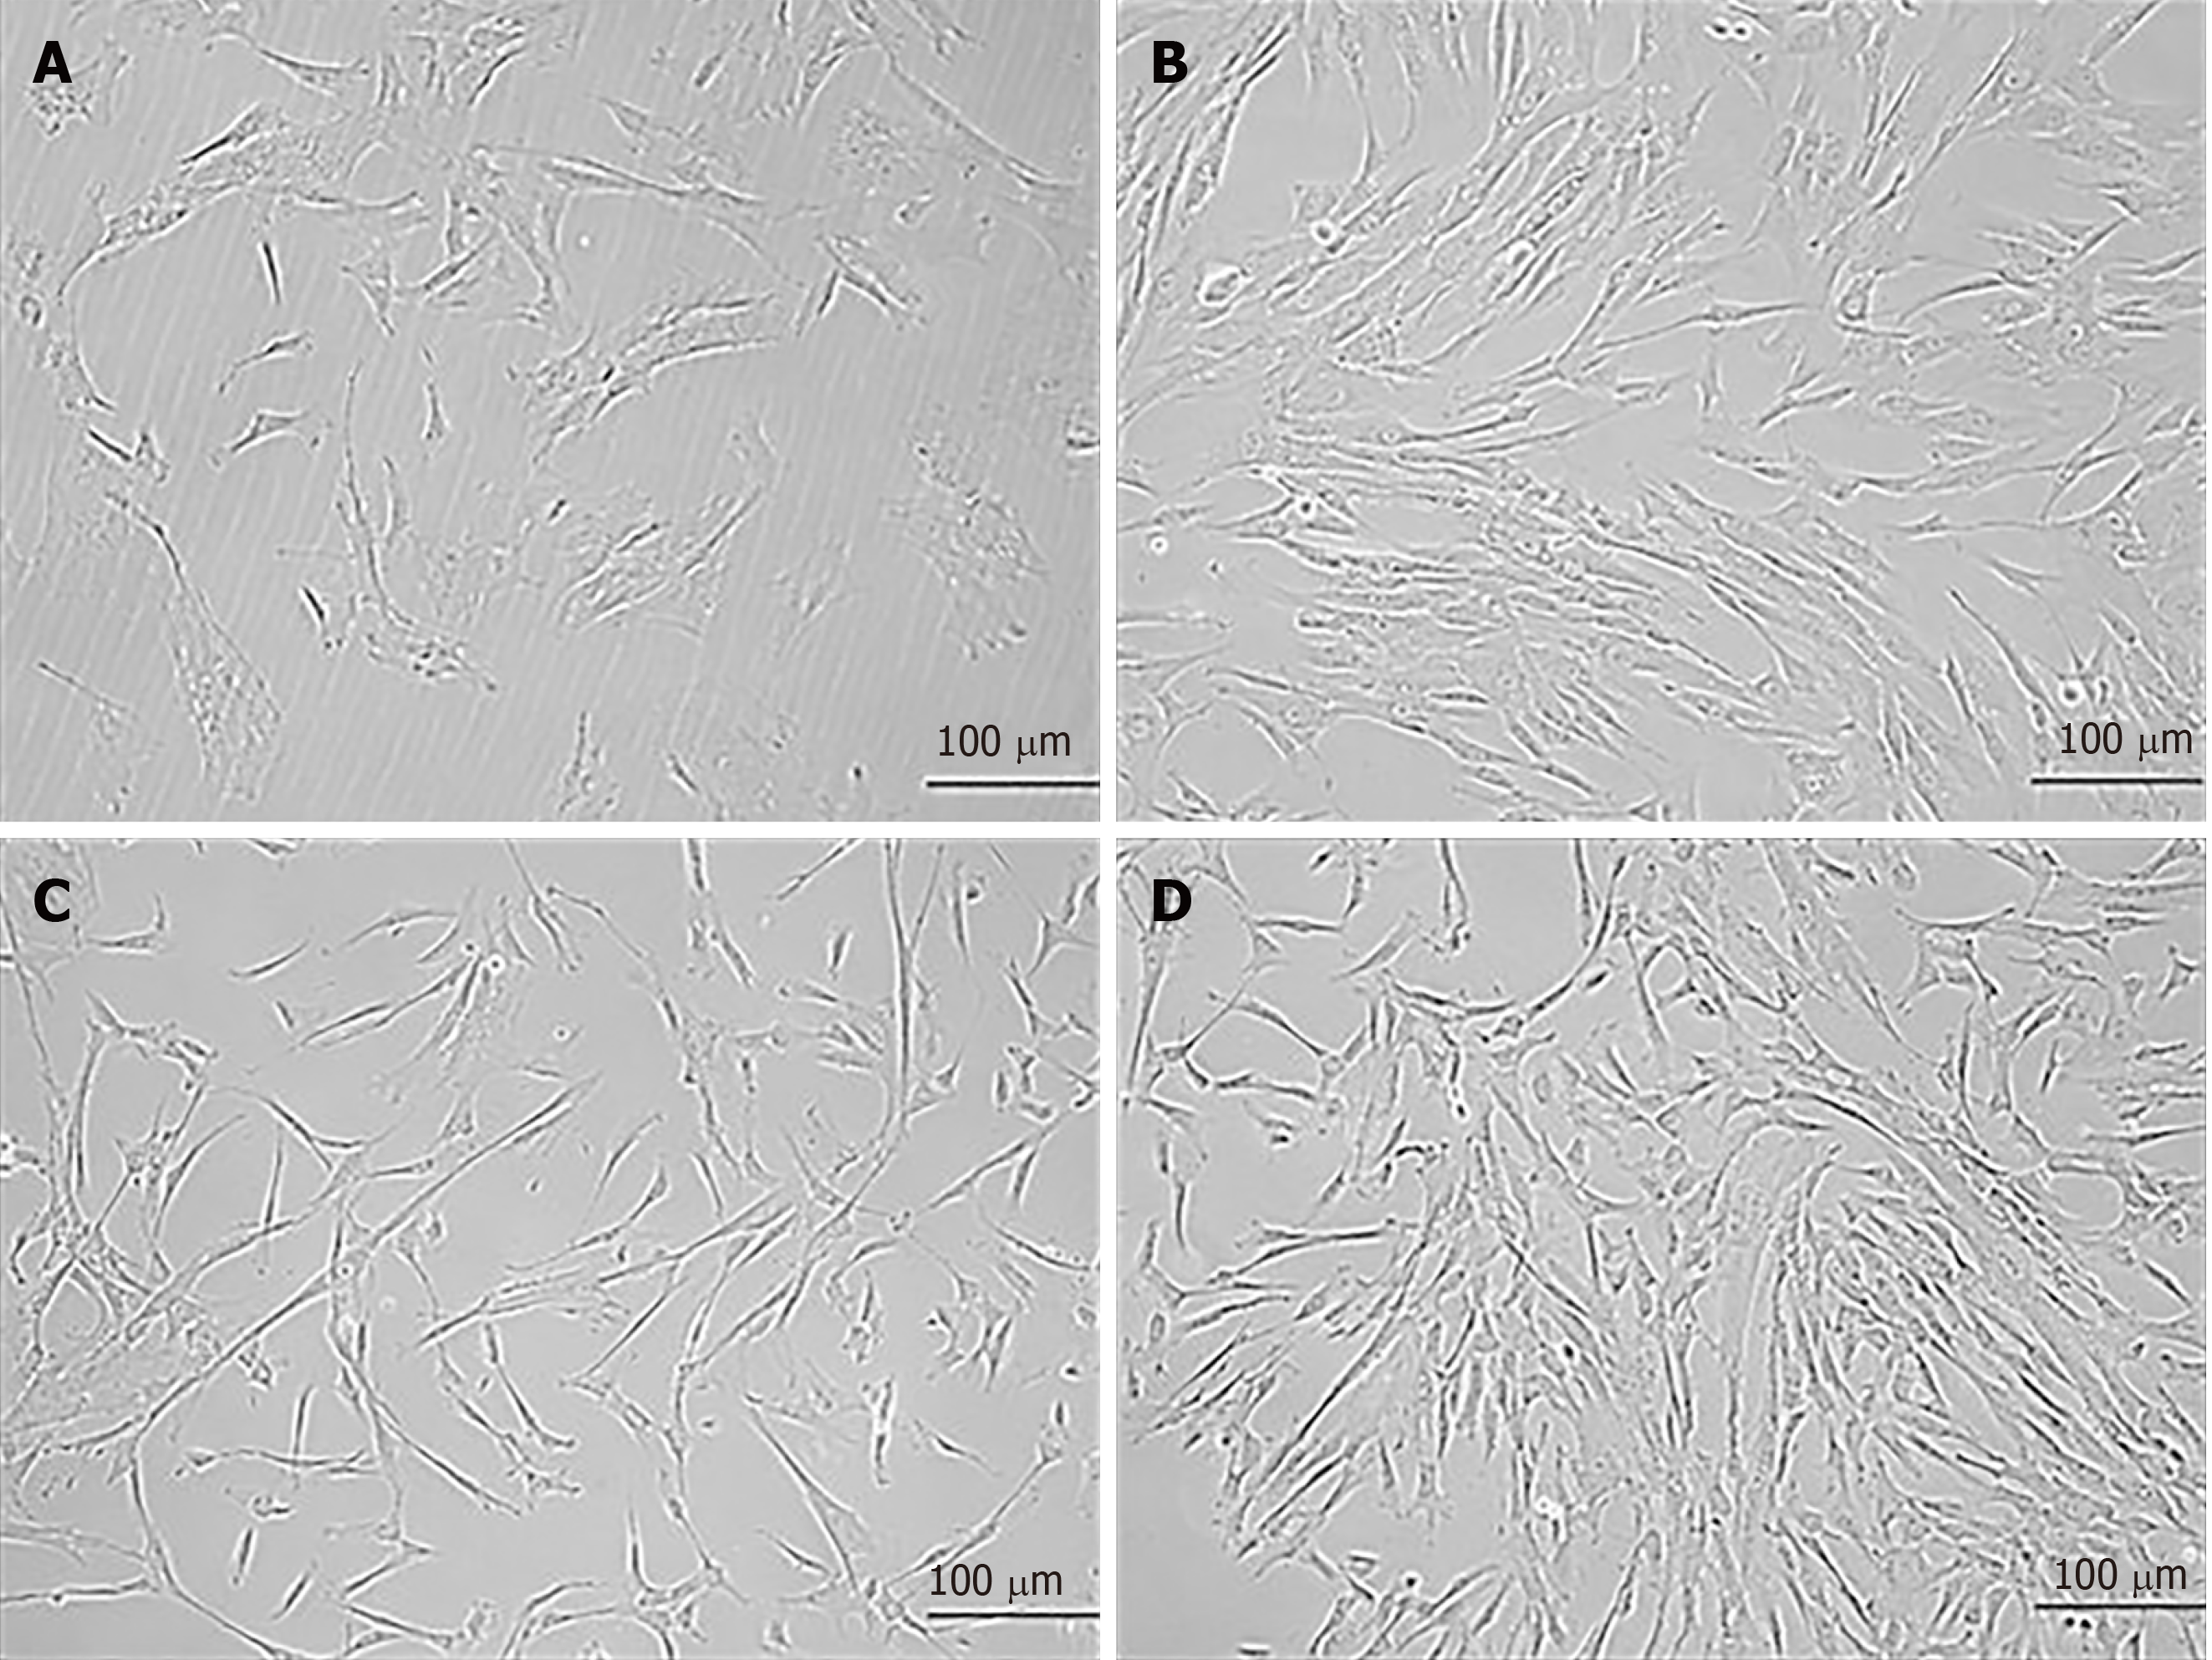
Figure 1 Morphology of mesenchymal stem cells at different passages.
Phase contrast images (20 ×) of human umbilical cord-derived mesenchymal stem cells show fibroblast-like morphology at passage 0 (P0) at day 10 and day 12 of culture. Similarly, cells at passage 1 (P1) show fibroblast-like morphology with extensions at day 10 and day 12 following subculture. A: P0 at day 10; B: P0 at day 12; C: P1 at day 10; D: P1 at day 12. Confluent cells are seen in B and D.
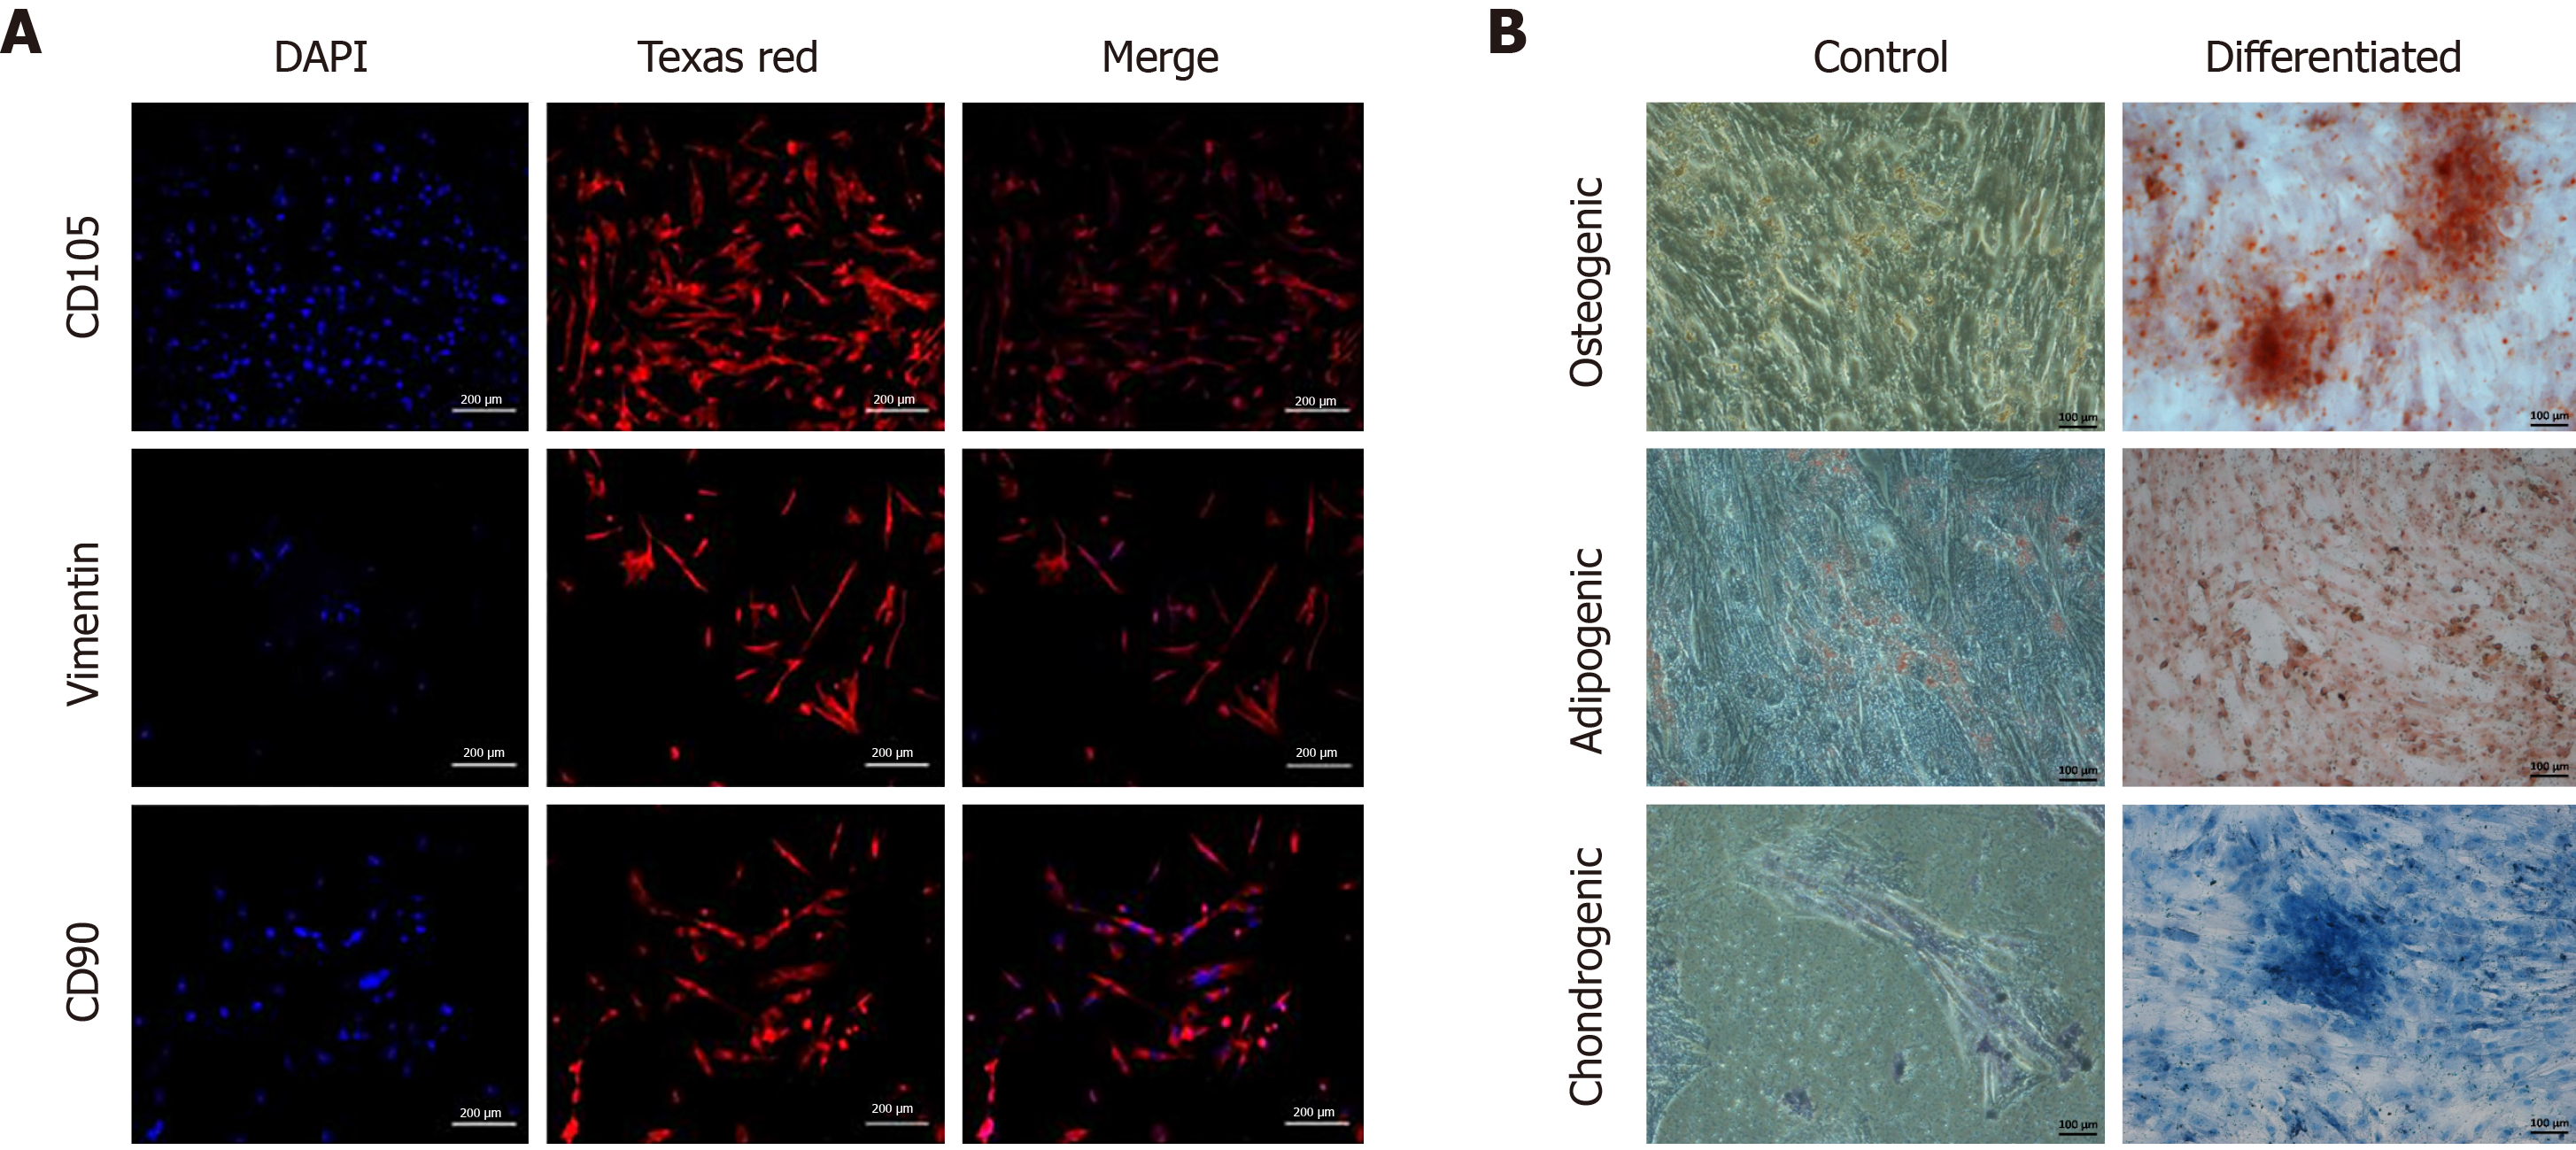
Figure 2 Characterization of mesenchymal stem cells.
A: Fluorescent images (10 ×) of isolated mesenchymal stem cells (MSCs) characterized by immunocytochemistry showing positive expression of cell surface markers CD105, vimentin and CD90. Alexa Fluor 546 goat anti-mouse secondary antibody was used for detection. Nuclei were stained with DAPI; B: Phase contrast images (10 ×) of MSCs stained with Alizarin Red stain showing mineral deposits, Oil Red O stain showing oil droplets, and Alcian Blue stain showing proteoglycans, confirming trilineage (osteogenic, adipogenic and chondrogenic) differentiation of MSCs grown in specific differentiation medium, as compared to the control.
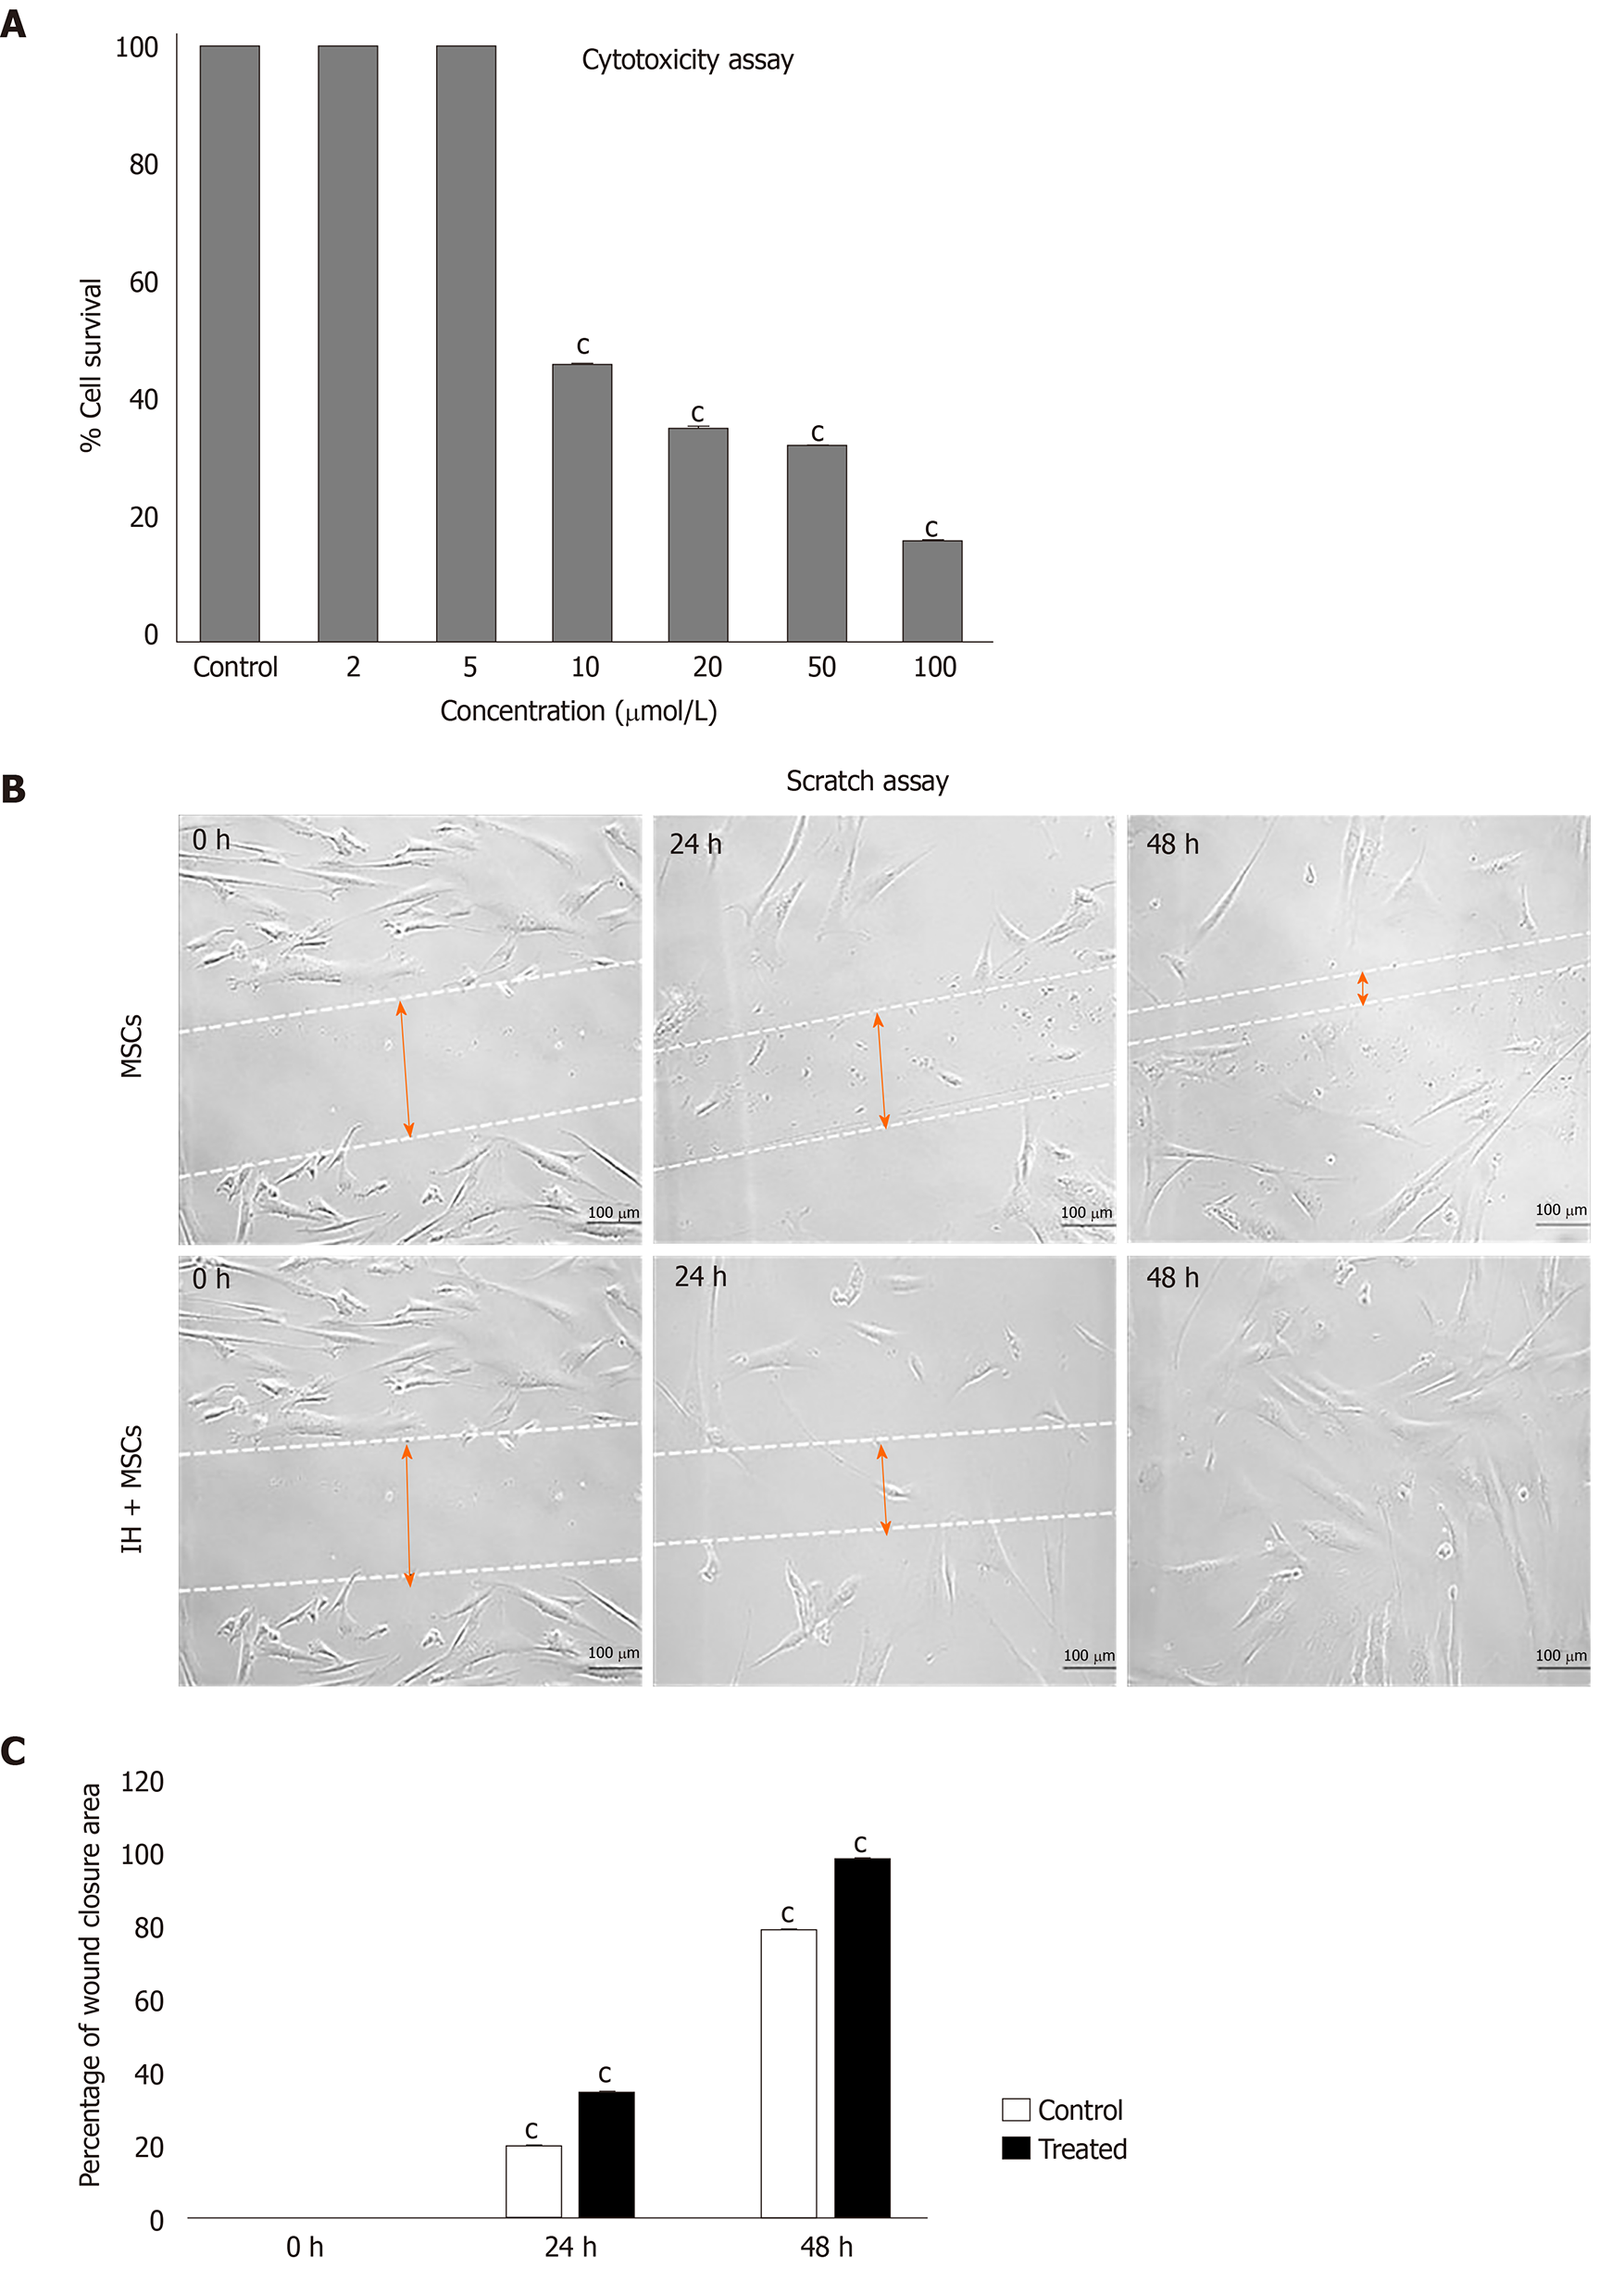
Figure 3 Cytotoxicity analysis and scratch assay.
A: MTT assay for cytotoxicity analysis showed a concentration dependent decrease in the viability of human umbilical cord mesenchymal stem cells (MSCs) treated with isorhamnetin, with a significant reduction in the percentage of cell survival at concentrations above 5 µmol/L; B: Scratch assay shows cell migration of normal untreated MSCs and preconditioned MSCs (IH + MSCs) at 0, 24 and 48 h. The scratch area was reduced in IH + MSCs as compared to untreated MSCs after 24 h and complete migration was observed after 48 h. The quantitative analysis showed significant cell migration of isorhamnetin treated MSCs at 24 h and complete migration at 48 h as compared to untreated normal MSCs. For statistical analysis, One way ANOVA was performed, followed by the Bonferroni post hoc test; Data are presented as the mean ± SE (n = 4). cP < 0.001. MSCs: Mesenchymal stem cells; IH + MSCs: Preconditioned mesenchymal stem cells.
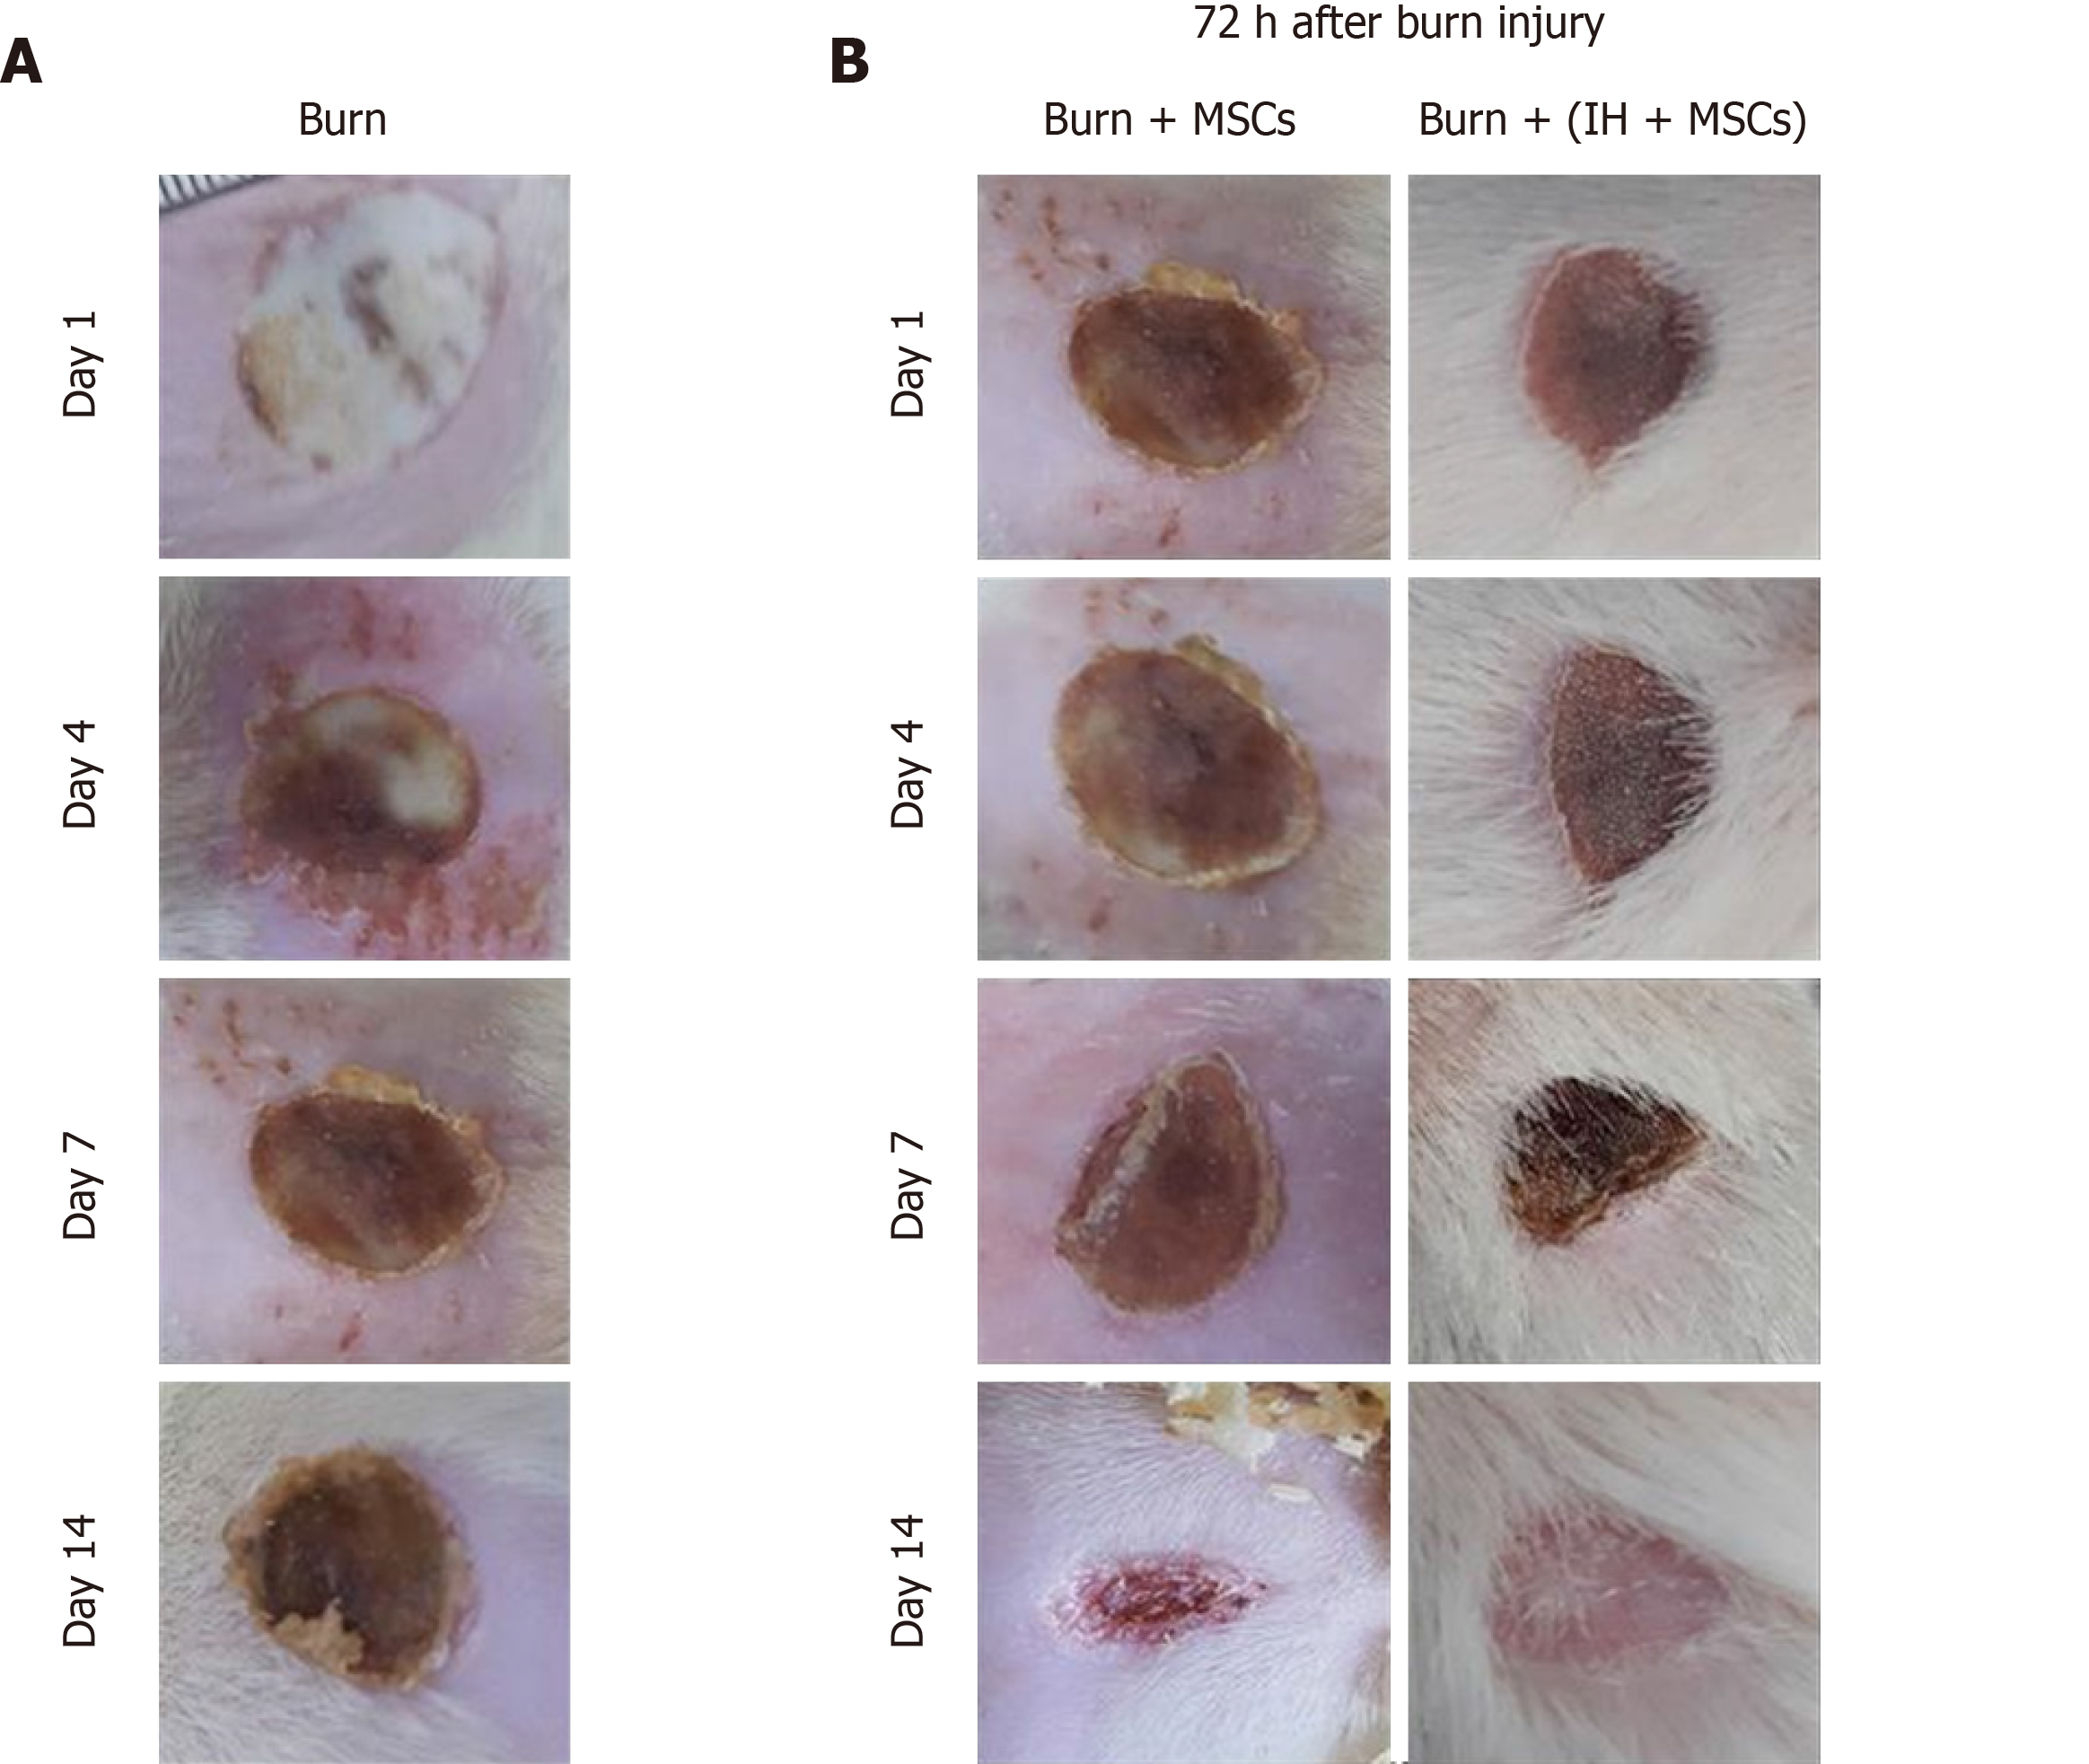
Figure 4 Macroscopic examination of burn wounds.
A: Images of burn wound tissue visualized macroscopically at days 1, 4, 7 and 14. Scab formation was observed at day 4 and slight detachment of the scab at day 14; B: Burn wound tissues transplanted with normal mesenchymal stem cells (MSCs) and preconditioned MSCs (IH + MSCs) were visualized 72 h after burn injury i.e. at day 1, 4, 7 and 14 following transplantation. At day 4, wound progression and initiation of scab formation were observed in all transplantation groups. At day 7, a thick scab with slight detachment was observed which completely covered the burn site and no sign of infection in the group transplanted with IH + MSCs. At day 14, complete detachment of the scab with slight granulation tissue was observed in the group transplanted with normal MSCs, while complete scab detachment and re-epithelialization were observed along with hair growth in the case of IH + MSCs. MSCs: Mesenchymal stem cells; IH + MSCs: Preconditioned mesenchymal stem cells.
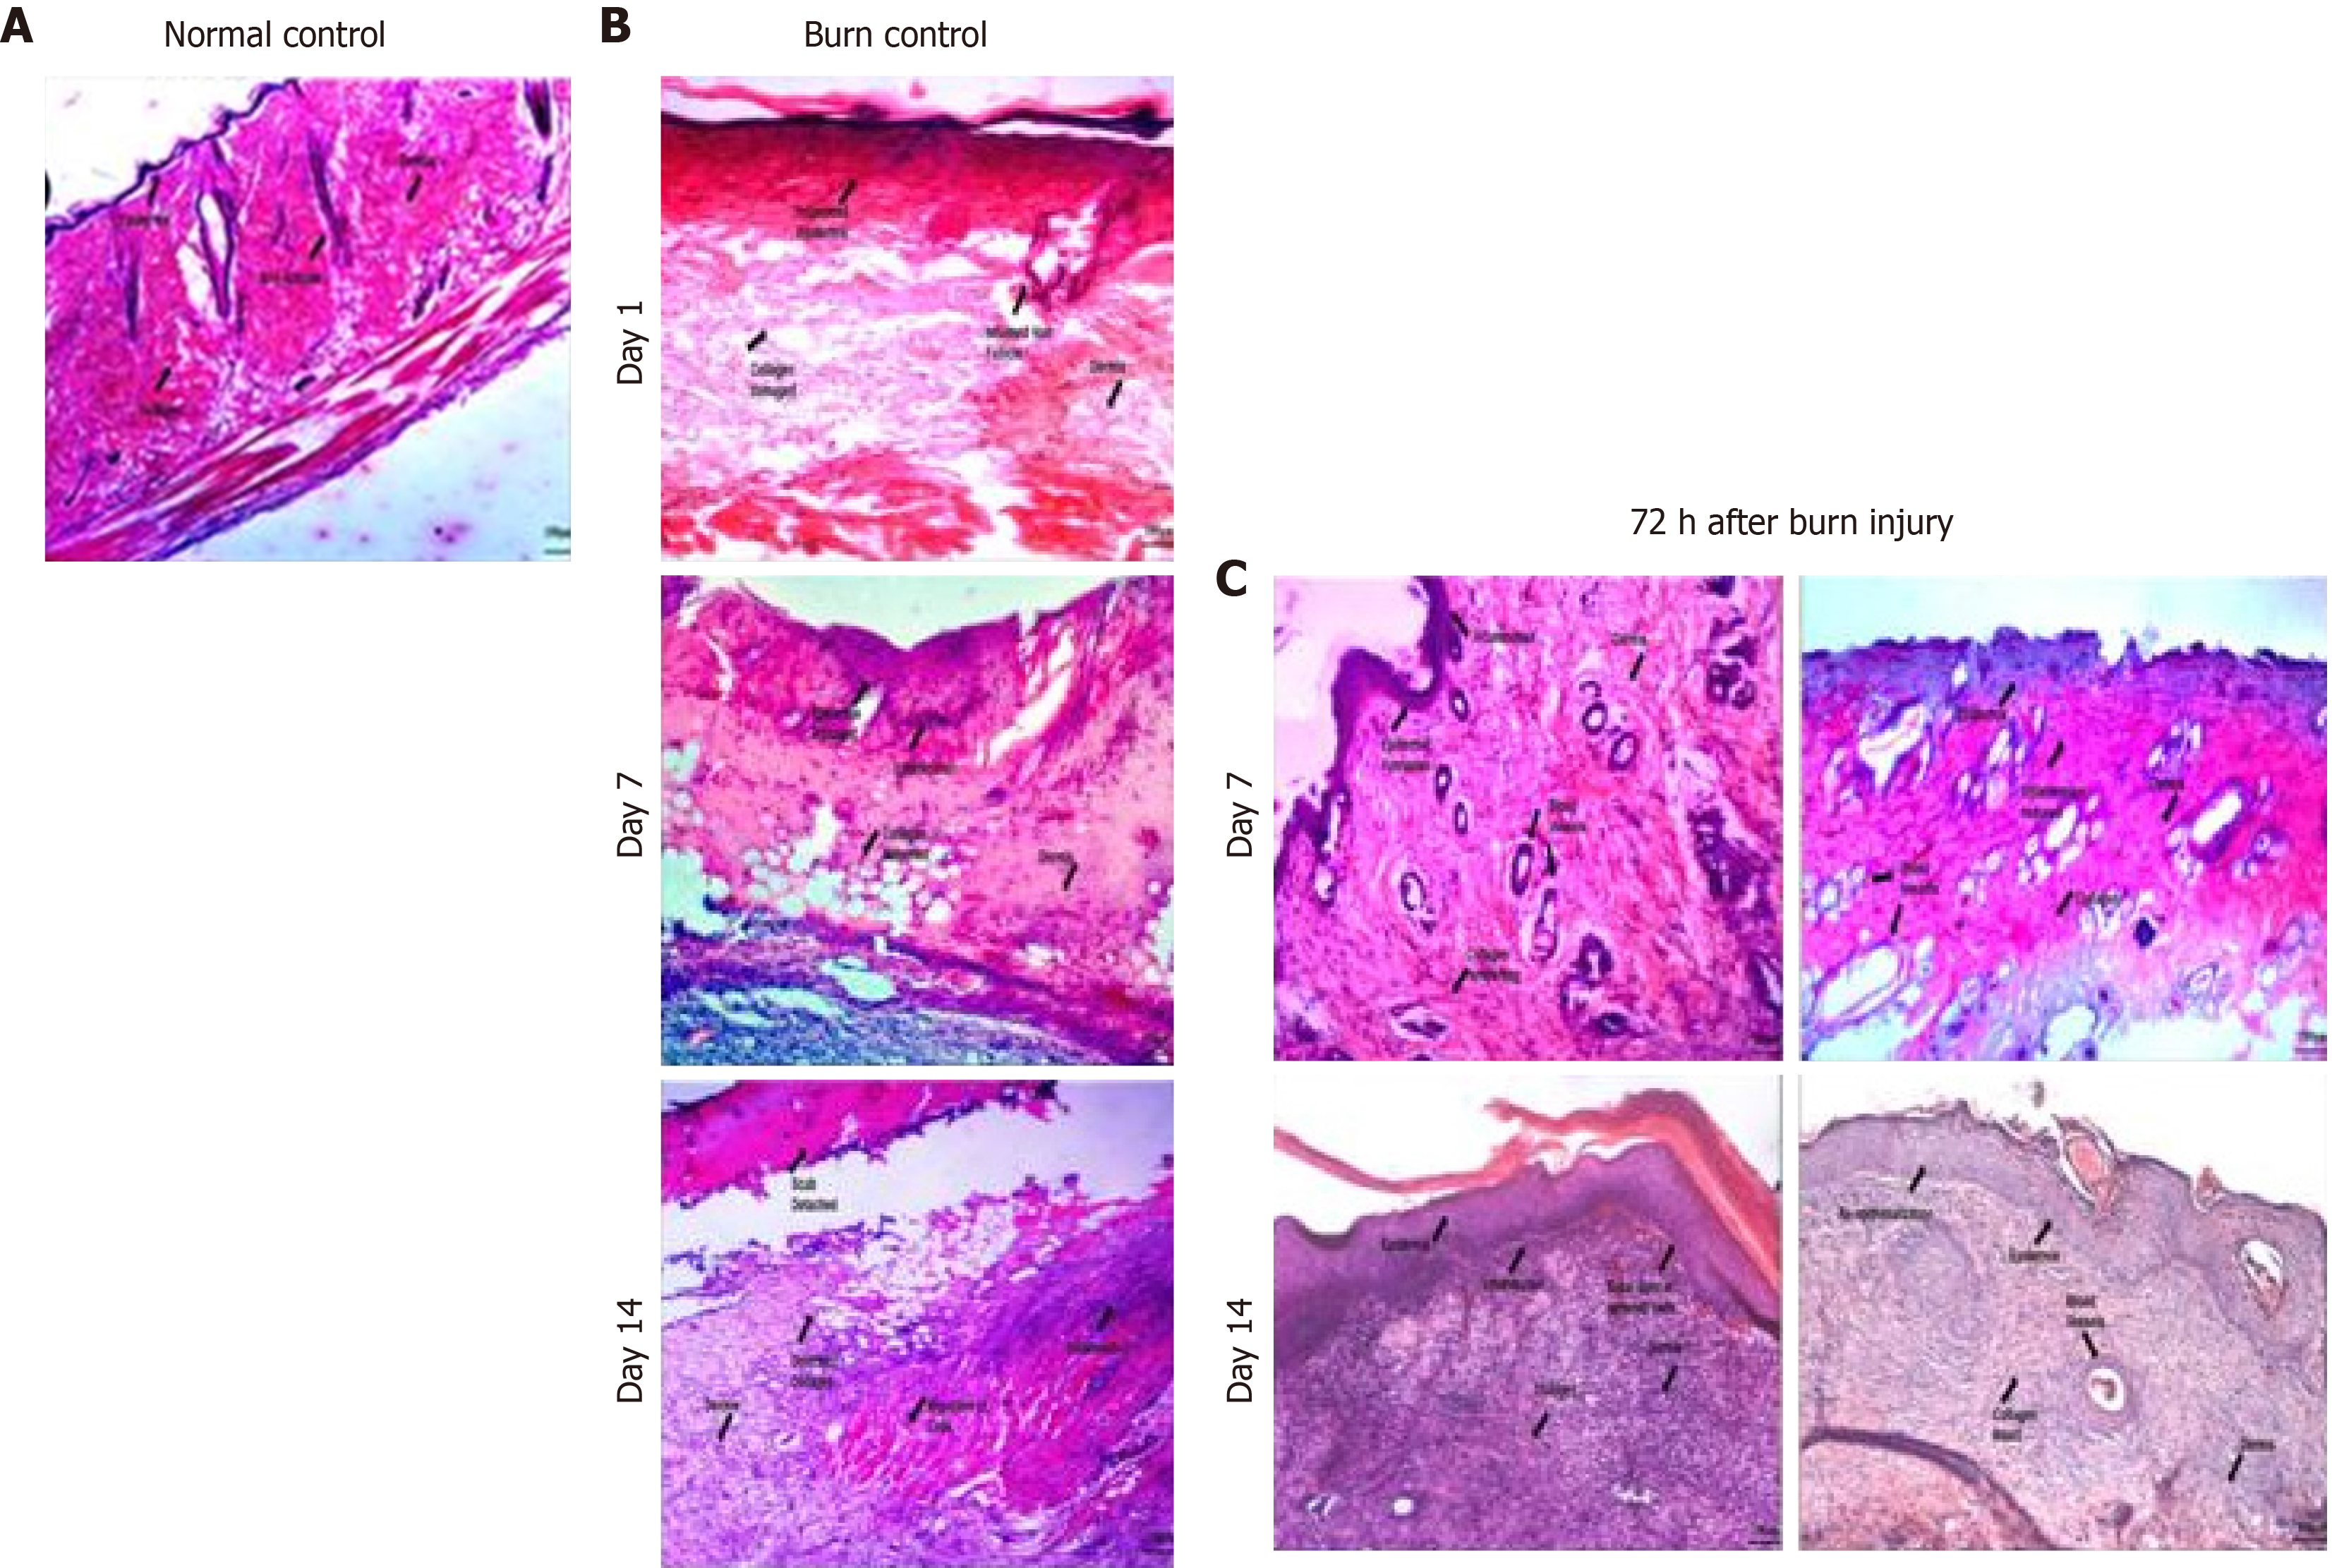
Figure 5 Histological analysis of normal and burn wound tissues.
Phase contrast images (20 ×) of histological sections stained with hematoxylin-eosin stain showing normal control (skin with no wound) with normal skin structure composed of the epidermis, dermis and hypodermis along with the muscles, burn wound control at days 1, 7 and 14, and burn wound tissues transplanted with normal mesenchymal stem cells (MSCs) and preconditioned MSCs (IH + MSCs) at days 7 and 14 following 72 h of burn injury. The burn wound at day 1 shows inflamed epidermis and hair follicles, completely distorted dermis and collagen matrix; at day 7, disorganized tissue framework with no distinct layers of skin and the presence of loose connective tissues, while hair follicles show better morphology and reduced inflammation; and at day 14, slight detachment of the scab with deformed collagen and cellular infiltration, loose connective tissue with disorganized dermis and absence of epidermis. Normal MSCs treated burn wound at day 7 shows neovascularization and inflamed epidermis along with collagen deposition, while hair follicles show inflammatory cell infiltration in the periphery with better morphology; and at day 14, epidermis formation with cellular migration and collagen deposition, constructing the dermis. IH + MSCs treated burn wound at day 7 shows increased angiogenesis and reduced inflammation in the epidermis, while hair follicles also show similar morphology to that in normal skin with reduced inflammation; and at day 14, complete re-epithelialization with intact collagen and vascularization, and remodeling of the tissue framework with a distinct layer of epidermis and dermis with no signs of scar. A: Normal control; B: Burn control; C: Seventy two hours (72 h) after burn injury.
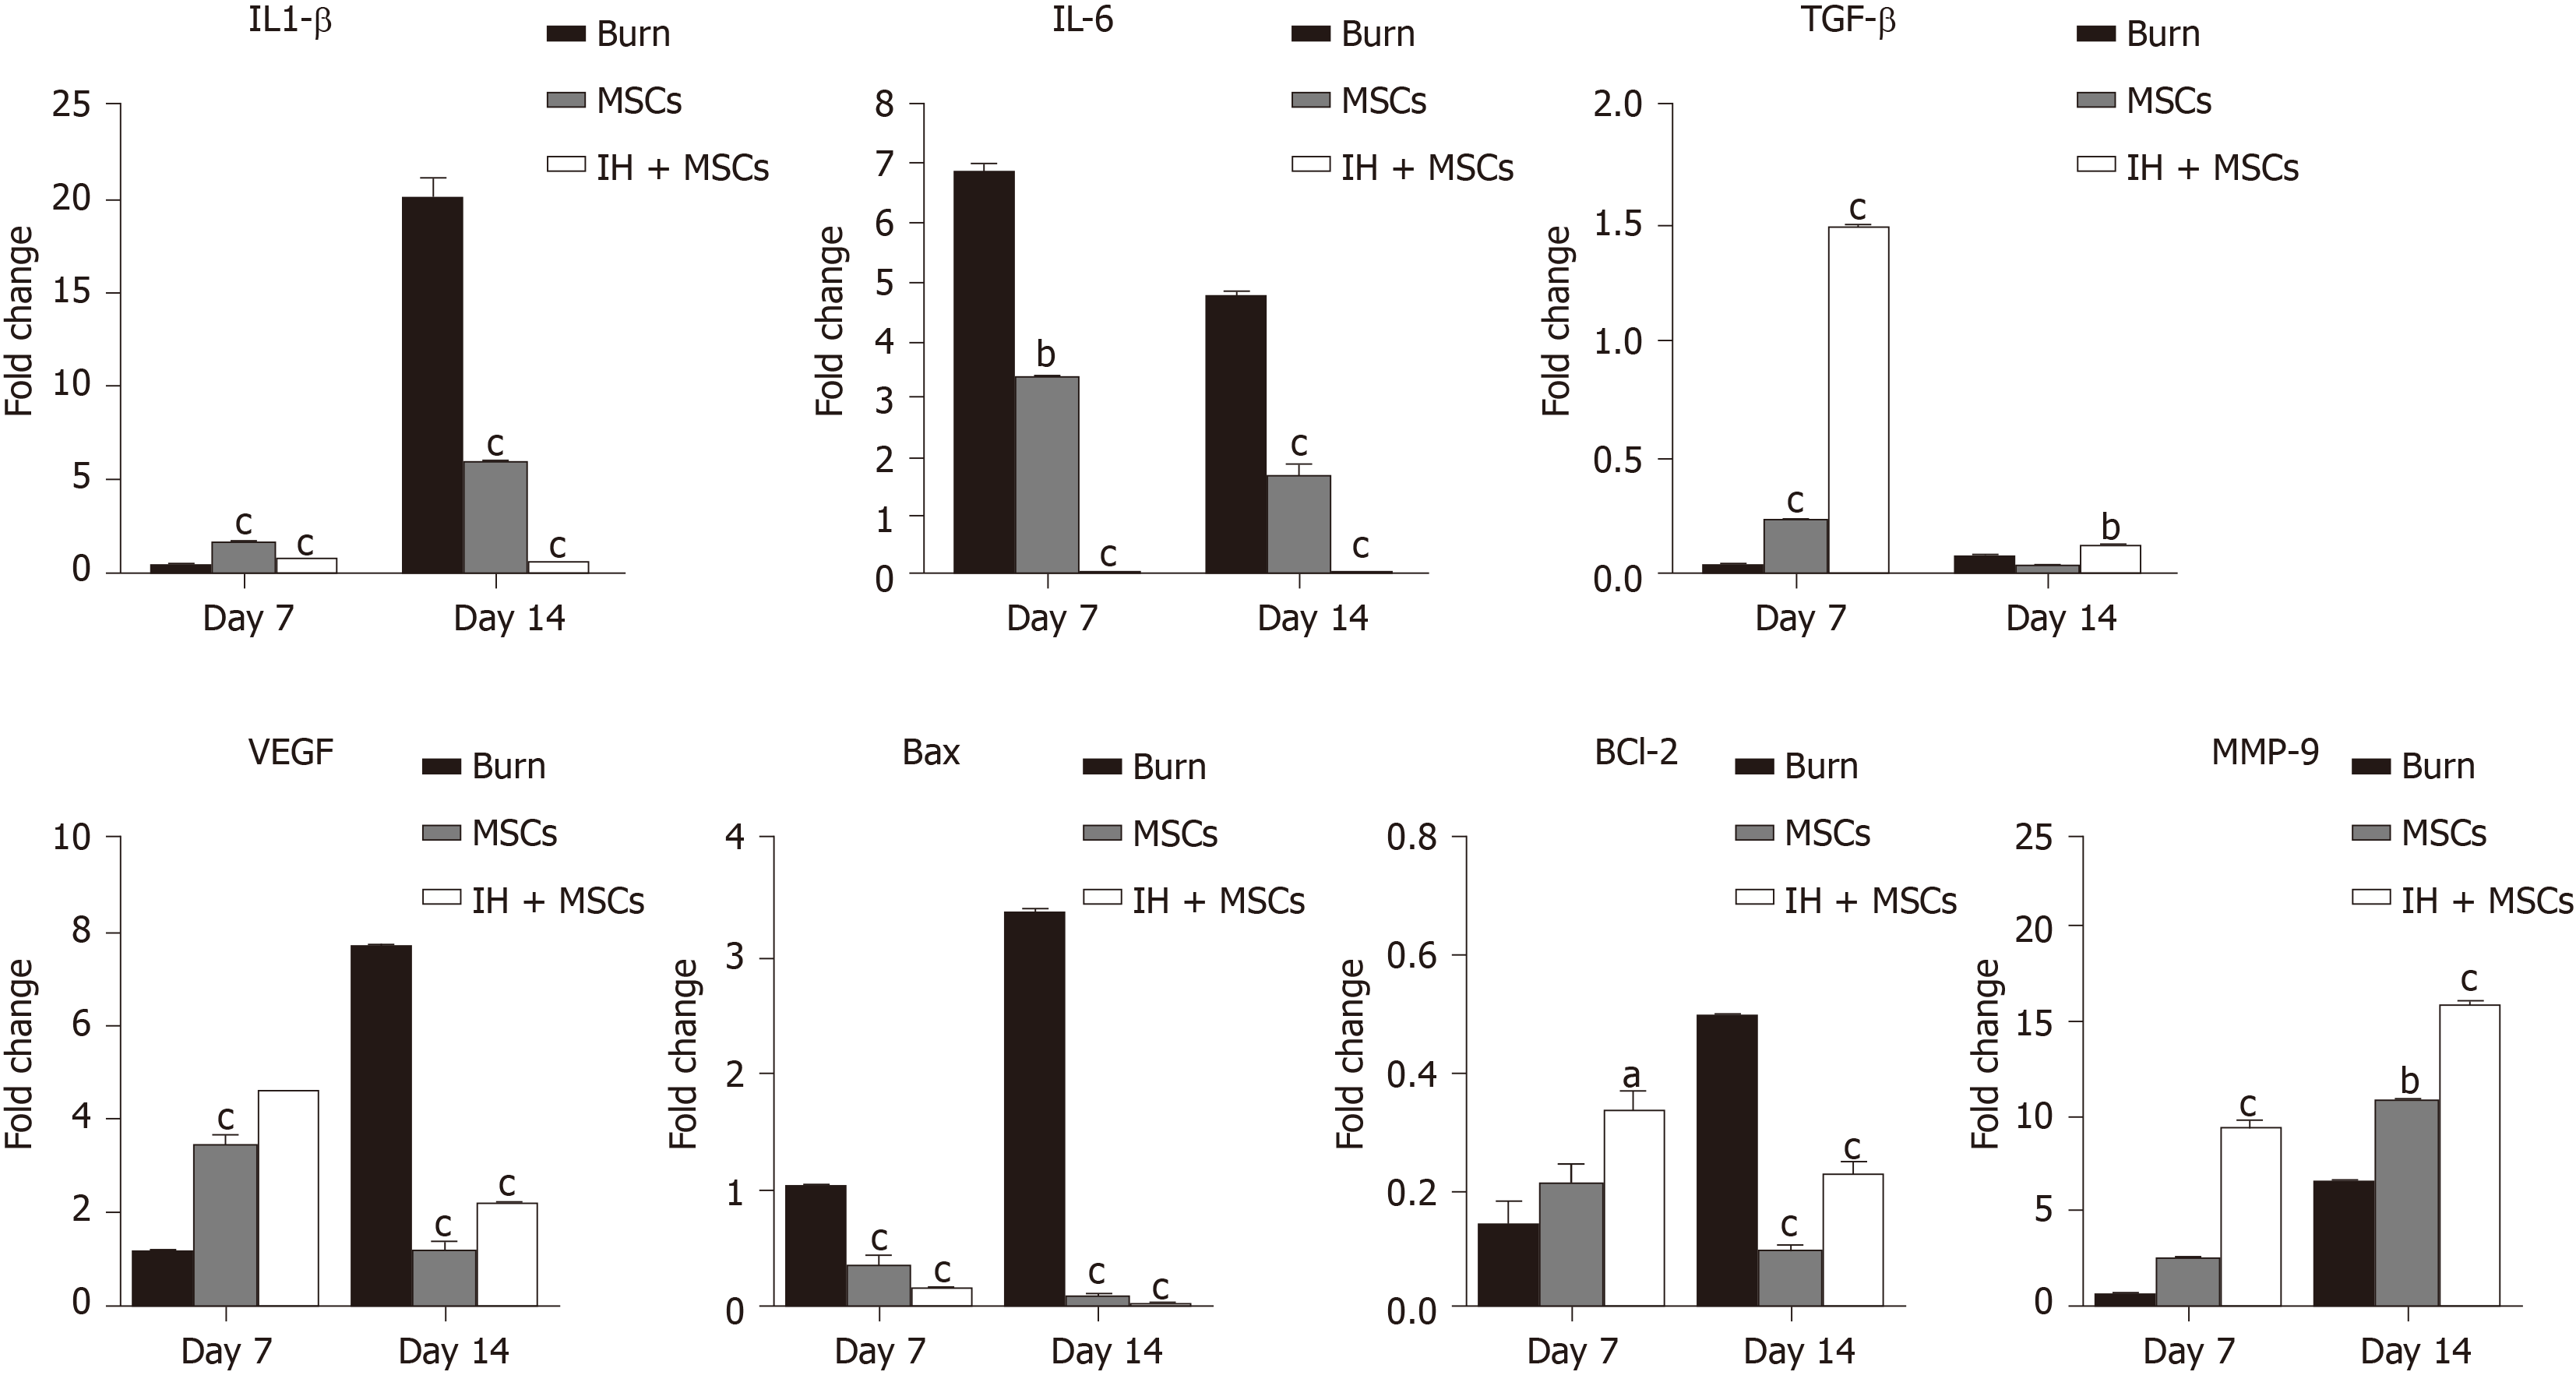
Figure 6 Gene expression analysis of burn wounds.
Bar diagrams corresponding to gene expression analysis of interleukin (IL)-1β, IL-6, transforming growth factor β (TGF-β), vascular endothelial growth factor (VEGF), Bcl-2 associated X (Bax), Bcl-2 and matrix metallopeptidase 9 (MMP-9) are shown in the burn wound control (at days 7 and 14) and experimental groups treated with normal untreated mesenchymal stem cells (MSCs) and preconditioned MSCs (IH + MSCs) at days 7 and 14 following 72 h of burn injury. The pattern of gene expression was time dependent; statistically significant downregulation of IL-1β (at day 14), IL-6 and Bax (days 7 and 14), and significant upregulation of TGF-β and MMP-9 (days 7 and 14), VEGF and Bcl-2 (day 7) in case of IH + MSCs as compared to burn control. Same pattern was observed in the case of normal MSCs for IL-1β, IL-6, Bax VEGF and Bcl-2 genes, while for TGF-β (day 14) and MMP-9 (day 7), the expression levels were non-significant. For statistical analysis, One way ANOVA was performed, followed by the Bonferroni post hoc test. Data are presented as the mean ± SE (n = 3). aP < 0.05, bP < 0.01 and cP < 0.001. IL: Interleukin; TGF-β: Transforming growth factor β; VEGF: Vascular endothelial growth factor; MMP-9: Matrix metalloproteinase-9.
- Citation: Aslam S, Khan I, Jameel F, Zaidi MB, Salim A. Umbilical cord-derived mesenchymal stem cells preconditioned with isorhamnetin: potential therapy for burn wounds. World J Stem Cells 2020; 12(12): 1652-1666
- URL: https://www.wjgnet.com/1948-0210/full/v12/i12/1652.htm
- DOI: https://dx.doi.org/10.4252/wjsc.v12.i12.1652


