Published online Feb 21, 2017. doi: 10.3748/wjg.v23.i7.1203
Peer-review started: November 15, 2016
First decision: December 19, 2016
Revised: December 27, 2016
Accepted: January 11, 2017
Article in press: January 11, 2017
Published online: February 21, 2017
Processing time: 97 Days and 3.1 Hours
To investigate the antioxidant effect of caffeic acid phenethyl ester (CAPE) in hepatic stellate cell-T6 (HSC-T6) cells cultured in vitro and the potential mechanisms.
HSC-T6 cells were cultured in vitro and treated with various concentrations of CAPE for 24, 48 and 72 h, respectively. Cell proliferation was investigated using the MTT assay, and cell ultrastructural alterations were observed by transmission electron microscopy. Flow cytometry was employed to investigate the effects of CAPE on apoptosis and the levels of reactive oxygen species in HSC-T6 cells cultured in vitro. An enzyme immunoassay instrument was used to evaluate antioxidant enzyme expression. The effect on α-smooth muscle actin was shown using immunofluorescence. Gene and protein levels of Nrf2, related factors, and mitogen activated protein kinases (MAPKs), in HSC-T6 cells were detected using RT-PCR and Western blot, respectively.
CAPE inhibited the proliferation and activation of HSC-T6 cells cultured in vitro. CAPE increased the antioxidant levels and the translocation of Nrf2 from the cytoplasm to the nucleus in HSC-T6 cells. Moreover, the phosphorylation of MAPKs in cells decreased in response to CAPE. Interestingly, CAPE-induced oxidative stress in the cells was significantly attenuated by pretreatment with MAPKs inhibitors.
CAPE inhibits cell proliferation and up-regulates the antioxidant levels in HSC-T6 cells partly through the Nrf2-MAPKs signaling pathway.
Core tip: Liver fibrosis is a pathological response to hepatocyte injury, including oxidative stress, which is a primary mechanism of liver damage. Caffeic acid phenethyl ester (CAPE) is a phenolic compound extracted from honeybee propolis that has strong biological properties in liver protection and as an antioxidant and anti-fibrosis agent. It has been used in the treatment of several diseases. In this study, we investigated the antioxidant effect of CAPE in HSC-T6 cells and its potential mechanism. Our results demonstrated that CAPE inhibited cell proliferation and up-regulated the antioxidant levels in HSC-T6 cells partly through the Nrf2-MAPKs signaling pathway.
- Citation: Yang N, Shi JJ, Wu FP, Li M, Zhang X, Li YP, Zhai S, Jia XL, Dang SS. Caffeic acid phenethyl ester up-regulates antioxidant levels in hepatic stellate cell line T6 via an Nrf2-mediated mitogen activated protein kinases pathway. World J Gastroenterol 2017; 23(7): 1203-1214
- URL: https://www.wjgnet.com/1007-9327/full/v23/i7/1203.htm
- DOI: https://dx.doi.org/10.3748/wjg.v23.i7.1203
Liver fibrosis is a pathological response to hepatocyte injury, including injury caused by viral infection, chronic inflammation, and other factors such as oxidative stress, which is a primary mechanism of liver damage[1,2]. Oxidative stress can stimulate the activation of hepatic stellate cells (HSCs) through paracrine and autocrine mechanisms, leading to the formation of liver fibrosis[1,2]. HSC-T6 cells, a well-differentiated transformed cell line[3,4], were used in this study to observe the role of HSC in liver fibrosis.
Caffeic acid phenethyl ester (CAPE) is a phenolic compound extracted from honeybee propolis that has strong biological properties in liver protection and as an antioxidant and anti-fibrosis agent. It has been used in the treatment of several diseases[5-7]. Our previous studies have shown that CAPE inhibited liver fibrosis in rats due to its ability to suppress oxidative stress[8].
Antioxidants play a pivotal role in the development of liver fibrosis[1]. Several antioxidative stress factors have been identified, including superoxide dismutase (SOD), catalase (CAT), glutathione peroxidase, and nonenzymatic compounds [vitamin E, carotene, and glutathione-S-transferase (GSTs)], in liver tissue[9,10]. SOD, CAT, and GSTs are recognized enzymes that are closely related to nuclear factor-erythroid 2 related factor 2 (Nrf2)[11,12]. Nrf2 is an important transcription factor regulating the expression of antioxidative stress factors. Nrf2 binds to an antioxidant response element (ARE) in the promoter region of genes encoding several phase-II detoxifying/antioxidant enzymes and related stress-responsive proteins, including SOD, CAT and GSTs[12]. Several studies have confirmed that Nrf2 is involved in the signaling pathway of mitogen activated protein kinase (MAPKs) in nuclear translocation[13]. MAPKs, including the ERK1/2, JNK1/2, and p38 signaling pathways, play a critical role in regulating the oxidative stress response in various types of cells. However, it is still largely unknown whether CAPE can reduce the expression of these factors via the Nrf2-mediated MAPKs signaling pathway in HSCs.
In this study, we show that CAPE inhibits the proliferation and activation, but increases apoptosis, of HSC-T6 cells in vitro. CAPE up-regulates the antioxidant capacity in HSC-T6 cells through the Nrf2-mediated MAPKs signaling pathway.
The cell apoptosis kit and SB203580 were purchased from Joincare Pharmaceutical Industry Group Co., Ltd. (Nanjing, China). SP600125 and PD98059 were obtained from Sigma-Aldrich (St. Louis, United States) and Cell Signaling Technology (Boston, United States), respectively. CAPE (Sigma-Aldrich, St. Louis, MO, United States) was dissolved in dimethyl sulfoxide (DMSO, Sigma-Aldrich, St. Louis, MO, United States) to 40 mmol/L as a stock solution and stored at -20 °C. Control flasks or plates contained DMSO at an equivalent dilution in cultures containing CAPE.
HSC-T6 cells were purchased from Joincare Pharmaceutical Industry Group Co., Ltd. (NanJing, China). Cells were cultured in Dulbecco’s modified Eagle’s medium (DMEM, HyClone, Utah, United States) supplemented with 10% (v/v) fetal bovine serum (FBS, HyClone, Utah, United States), 100 μg/mL streptomycin (Sigma-Aldrich, St. Louis, United States), 100 U/mL penicillin (Sigma-Aldrich, St. Louis, MO, United States), 2 mmol/mL L-glutamine (Sigma-Aldrich, St. Louis, United States), and 100 U/mL DNase I (Sigma-Aldrich, St. Louis, United States) at 37 °C in a 5% (v/v) CO2 humidity atmosphere. Cells adhering to the culture flask in logarithmic phase were trypsinized and subjected to passage as usual for further experimentation.
The tetrazolium dye colorimetric test [3-(4,5-dimethylthiazolyl-2)-2, 5-diphenyl-tetrazolium bromide, MTT, Sigma-Aldrich, St. Louis, MO, United States] was used to determine the viability of HSC-T6 cells. The MTT assay is based on the ability of functional mitochondria to catalyze the reduction of MTT to insoluble purple formazan, the concentration of which can be measured spectrophotometrically, as described previously[14]. HSC-T6 cells were incubated on a 96-well plate at a density of 5 × 10⁵ cells/well for 24 h and treated with different concentrations of CAPE (0, 5, 10, 15, 20, 40, 60, 80 and 100 μmol/L). MTT solution (0.5 mg/mL) was then added to each well. The MTT solution was replaced with DMSO to dissolve the blue formazan crystals. Four hours later, absorbance was measured at 490 nm using a microplate reader (BioTekInstruments, United States) and the percentage viability was calculated.
Cells in the logarithmic phase were treated with a range of CAPE (5, 10 and 15 μmol/L) for 24 h or established as controls. At the end of the treatment, cells were washed twice with phosphate buffered solution (PBS, 137 mmol/L NaCl, 2.7 mmol/L KCl, 4.3 mmol/L Na2HPO4, 1.4 mmol/L KH2PO4, pH 7.4), fixed in 2.5% (v/v) glutaraldehyde followed by 1% (v/v) perosmic acid, and dehydrated in an ethanol series. Ultrathin sections were placed on 400-mesh grids and double-stained with uranyl acetate and lead citrate. The ultrastructures were observed using a transmission electron microscope (HITACHI-H7650, Tokyo, Japan).
Cell apoptosis was determined using Annexin V-FITC and PI double staining (KaiJi, Nanjing, China), as described previously[15]. Cells grown in logarithmic phase were treated with a range of CAPE (5, 10 and 15 μmol/L) for 24 h or established as controls. At the end of the treatment, cells were collected by centrifugation and washed twice with PBS. Cell pellets were resuspended in 0.5 mL PBS and fixed in 5 mL 70% (v/v) ice-cold ethanol at 4 °C for 24 h. After resuspension in 1 mL PBS, the cells were incubated with ribonuclease A (Rnase A, 20 mg/L, Sigma-Aldrich) and propidium iodide (PI, 50 mg/L, Sigma-Aldrich) for 1 h at 37 °C in the dark. The stained cells were analyzed using a FACscan flow cytometer in combination with BD lysis II software (CALIBUR, BD, United States).
SOD and CAT activity and GSH content were measured using a SOD protein reagent kit (Bio-Rad, Hercules, CA, United States), CAT protein reagent kit (Bio-Rad, Hercules, CA, United States), and GSH protein reagent kit (Bio-Rad, Hercules, CA, United States), respectively. Briefly, HSC-T6 cells grown in logarithmic phase were treated with a range of CAPE (5, 10 and 15 μmol/L) for 24 h. The cells were washed twice with PBS, collected by centrifugation, and lysed in cell disrupter buffer (Bio-Rad, Hercules, CA, United States). After centrifugation, the protein concentrations of the supernatant were determined using a protein reagent kit. The optical density (OD) of SOD, GSH, and CAT was measured using a spectrophotometer (ND-1000, Thermo Fisher, United States) at wavelengths of 450 nm, 405 nm and 420 nm to generate the standard curve and calculate the concentrations of SOD, GSH and CAT, respectively.
Total RNA was extracted using Trizol reagent (Invitrogen, United States) and reverse transcription was carried out using an RT-PCR kit (Takara, Japan), as described previously[16]. Real-time PCR was performed using the SYBRE Script TM RT-PCR Kit (Takara, Japan) on an iQ5 Multicolor Real-Time PCR Detection System (Bio-Rad, Hercules, CA, United States) according to the manufacturer’s protocols. The primers are shown in Table 1. The comparative CT method was used to quantify the target gene expression, with β-actin used as an internal control[17].
| Gene | Primer sequence | Tm (°C) | Size (bp) | Source |
| Nrf2 | ||||
| F | 5’-CTGCCATTAGTCAGTCGCTCTC-3’ | 57.3 | 22 | Rat |
| R | 5’-TCGGCTGGGACTTGTGTTC-3’ | 57.7 | 19 | Rat |
| SOD1 | ||||
| F | 5’-GCTTCTGTCGTCTCCTTGCT-3’ | 55.7 | 20 | Rat |
| R | 5’-CTCGAAGTGAATGA CGCCCT-3’ | 55.8 | 20 | Rat |
| CAT | ||||
| F | 5’-TGGCTATGGCTCACACACCTTC-3’ | 59.3 | 22 | Rat |
| R | 5’-GAGGCCA TAATCCGGGTCTTC-3’ | 57.7 | 21 | Rat |
| GSTs | ||||
| F | 5’-GTGGAGATTGACGGGATGAA -3’ | 54.2 | 20 | Rat |
| R | 5’-CGGTCTTGGCTTCTCTTTGG -3’ | 56.0 | 20 | Rat |
| β-actin | ||||
| F | 5’-GGAGATTACTGCCCTGGCTCCTA-3’ | 60.2 | 23 | Rat |
| R | 5’-GACTCATCGTACTCCTGCTTGCTG-3’ | 59.3 | 24 | Rat |
The expression of α-SMA and Nrf2 in HSC-T6 cells was investigated using immunofluoresence staining[18]. Briefly, the cells were fixed in 4% (w/v) paraformaldehyde (Sigma-Aldrich) and permeabilized with 0.1% (v/v) Triton X-100 (Sigma-Aldrich). After blocking with 5% (w/v) bovine serum albumin (BSA, Sigma-Aldrich) and 1% (v/v) normal donkey serum (Sigma-Aldrich), the cells were incubated with rabbit anti-α-SMA (1:500) or Nrf2 (1:500) primary antibody (Table 2) for 16 h at 4 °C. The cells were washed and further incubated with peroxidase-conjugated anti-rabbit IgG (1:1000, Pierce Biotechnology, Rockford, United States) for 1 h. The cell nuclei were counter-stained using 4’,6-diamidino-2-phenylindole (DAPI, Sigma-Aldrich). After neutral gum mounting, fluorescence microscopy images were obtained using a confocal microscope (Ti-E, Nikon, Japan) with a laser at 405 nm and 535 nm excitation.
| Antibody (dilution) | Clone | Species | Specificity | Source |
| Nrf2 | M | Rabbit | Immunogen: ag9489 | ProteinTech, United States |
| (16396-1-AP 1:500) | ||||
| P38MAPK | M | Rabbit | Synthetic peptide corresponding to residues near the C-terminus of human p38 MAP kinase was used as immunogen. Predicted to react with CSBP1 splice form based on sequence homology | EPITOMICS, United States |
| (ab32142, 1:500) | ||||
| P-p38MAPK | M | Rabbit | Phospho-P38 MAPKinase (Thr180/Tyr182) (3D7) rabbit mAb detects endogenous levels of p38MAP kinase only when dually phosphorylated at Thr180 and Tyr182. This antibody does not cross-react with the phosphorylated forms of either p42/44 MAPK or SAPK/JNK | Cell Signaling, United States |
| (#4511, 1:500) | ||||
| Erk1/2 | M | Rabbit | P44/42 MAP kinase (137F5) rabbit mAb detects endogenous level of total P44/42 MAP kinase (Erk1/Erk2) protein. The antibody does not cross-react with JNK/SAPK or p38 MAP kinase | Cell Signaling, United States |
| (#4695, 1:500) | ||||
| Erk1phospho(pY204)/Erk2phospho | M | Rabbit | A phospho-specific peptide corresponding to residues surrounding tyrosine 204 of human Erk1. This antibody detects Erk1 phosphorylated at tyrosine 204 | EPITOMICS, United States |
| (pY187) | ||||
| (ab76299 1:500) | ||||
| SAPK/JNK | M | Rabbit | SAPK/JNK(56G8) rabbit mAb detects endogenous levels of total SAPK/JNK protein | Cell Signaling, United States |
| (#9258 1:500) | ||||
| JNK1phospho(pT183) /JNK2phospho(pT221) (ab124956 1:500) | M | Rabbit | A phospho-specific peptide corresponding to residues surrounding threonine 221 of human JNK3 was used as immunogen. The antibody detects JNK1 (pT183), JNK2 (pT183) and JNK3 (pT221) | EPITOMICS, United States |
| α-SMA | M | Rabbit | A synthetic peptide corresponding to N-terminus of human actin was used as immunogen | EPITOMICS, United States |
| (ab124964,1: 1000) | ||||
| Collegen-1 | P | Rabbit | KLH conjugated synthetic peptide derived from human Collagen I C-terminal propeptide | Bioss, China |
| (bs-0578R 1:500) | ||||
| β-actin | M | Mouse | β-actin is recommended for detection of β-actin of mouse, rat, human, chicken, dog, pig, rabbit | SANTA CRUZ, United States |
| (sc-47778, | ||||
| 1:1000) |
The expression of Nrf2, related factors, and MAPKs in HSC-T6 cells was investigated using Western blot, as described previously[16]. Briefly, the cells were harvested and re-suspended in a Nuclear/Cytosol Fractionation Kit (BioVision, Mountain View, CA, United States) or RIPA lysis buffer [20 mmol/L Tris, 150 mmol/L NaCl, 1% (v/v) Triton X-100, 1% (w/v) digestive phosphatase inhibitors, 1% (w/v) protease inhibitors, 1% (w/v) phenylmethyl sulfonylfluoride (PMSF), pH 7.5] (Sigma-Aldrich). The protein content was determined using a commercial protein reagent kit (Bio-Rad, Hercules, CA, United States). Equal amounts of proteins in each sample were resolved by 10% (w/v) sodium dodecyl sulfate-polyacrylamide gel (SDS-PAGE, Sigma-Aldrich) electrophoresis and the proteins were transferred onto PVDF membranes (Sigma-Aldrich). After blocking with skim milk, the membranes were incubated with the specific antibodies (Table 2) for 24 h at 4 °C. After washing, the membranes were incubated with a horseradish peroxidase-conjugated secondary antibody (Pierce Biotechnology, Rockford, United States) for 2 h at 37 °C. Proteins were detected with an all-enhanced chemiluminescence detection system (Syngene, United Kingdom) and quantified using a Gel-Pro Analyzer v4.0 (Media Cybernetics, L.P., United States). β-actin was used as the loading control.
The results are shown as the mean ± SD. Differences between groups were assessed by Student’s t-test and one- or two-way ANOVA with post-hoc Duncan multiple comparisons using SPSS 13.0. A P-value < 0.05 was considered statistically significant.
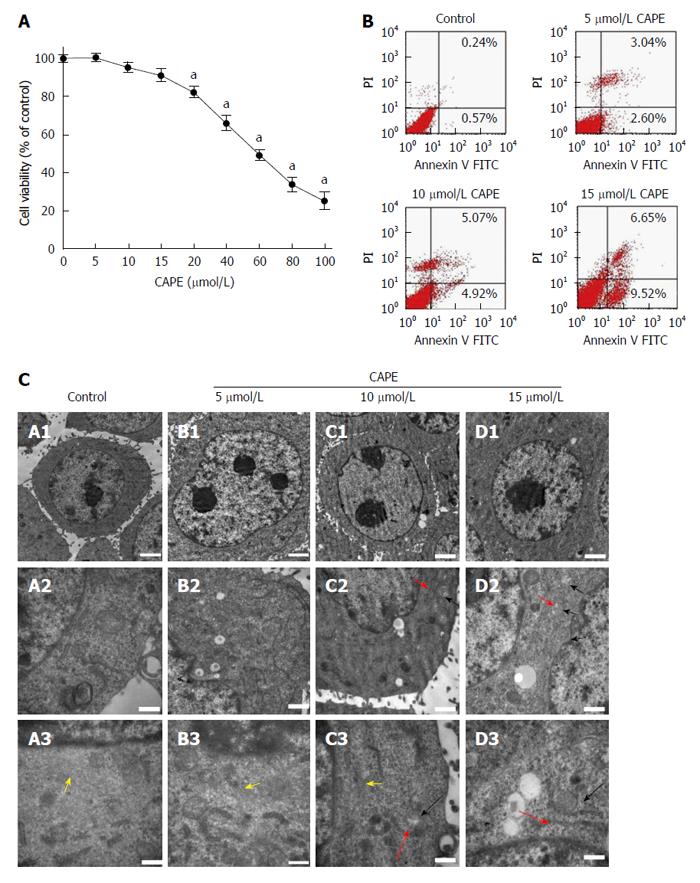
The MTT assay results indicated that 5, 10 and 15 μmol/L CAPE treatment for 24 h did not decrease cell viability compared to the control group (P > 0.05, Figure 1A). However, 20-100 μmol/L of CAPE was cytotoxic in HSC-T6 cells (P < 0.05, Figure 1A). Similar results were obtained after 48 and 72 h (data not shown). Therefore, 5, 10 and 15 μmol/L CAPE were used for all subsequent experiments. After treatment for 24 h, the proportion of cell apoptosis increased in a concentration-dependent manner compared to the control group (Figure 1B). Transmission electron microscopy was then used to investigate the ultrastructure of apoptotic cells. In the control group, the cells were round with tiny villous projections observed on the cell membrane. Many plasmosomes were distributed in the nucleus; the structure of mitochondria was clear; the rough endoplasmic reticulum was streaky; and lipid droplets were found in the cytoplasm (Figure 1C-A1-3). In the CAPE treatment groups, the growth of HSC-T6 cells was obviously inhibited; cell volume gradually declined; surface villous structure decreased or disappeared; there were fewer multiple nucleoli; there was mitochondrial swelling; the endoplasmic reticulum was slender; and a scattered distribution of lipid droplets was observed in the cytoplasm (Figure 1C-B/C/D).
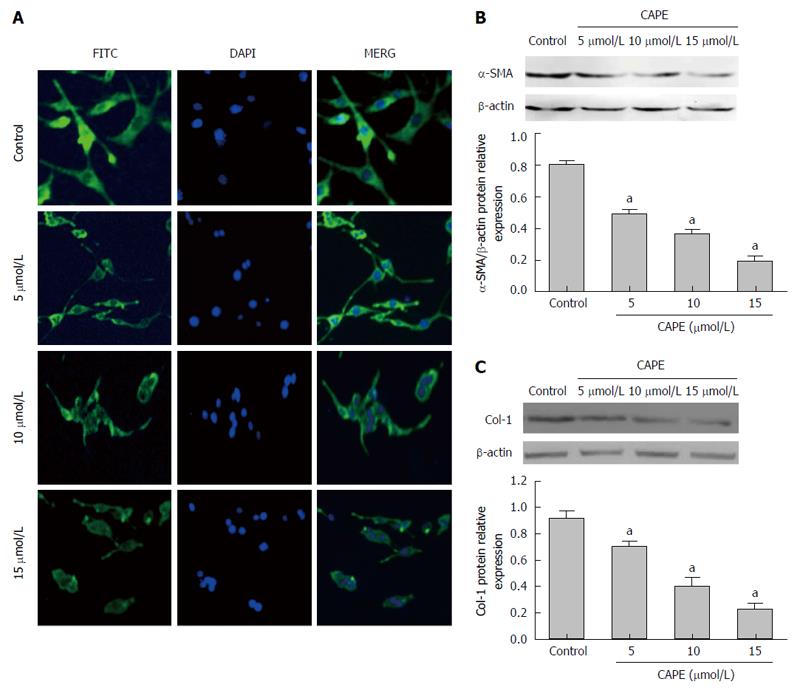
In the control group, HSC-T6 cells were spindle-shaped and fully stained with α-SMA (Figure 2A). After treatment with 5, 10 and 15 μmol/L of CAPE for 24 h, the cell volume was lower and the cell morphology became round with reduced α-SMA fluorescent staining (Figure 2A). Western blot analysis showed that α-SMA and collegen-1 protein expression decreased in a dose-dependent manner in HSC-T6 cells compared to the control group (P < 0.05, Figure 2B and C).
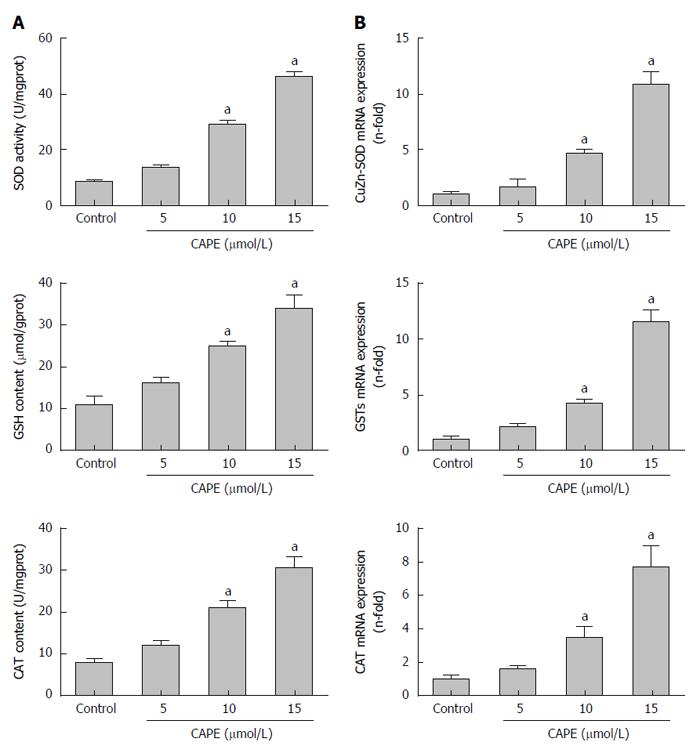
After treatment with CAPE for 24 h, gene and protein expression of SOD, CAT, GSH and GSTs was significantly increased in HSC-T6 cells treated with 10 μmol/L or 15 μmol/L CAPE compared to the control group (P < 0.05, Figure 3A and B). However, 5 μmol/L of CAPE did not affect SOD, CAT, GSH, or GSTs (P > 0.05, Figure 3A and B).
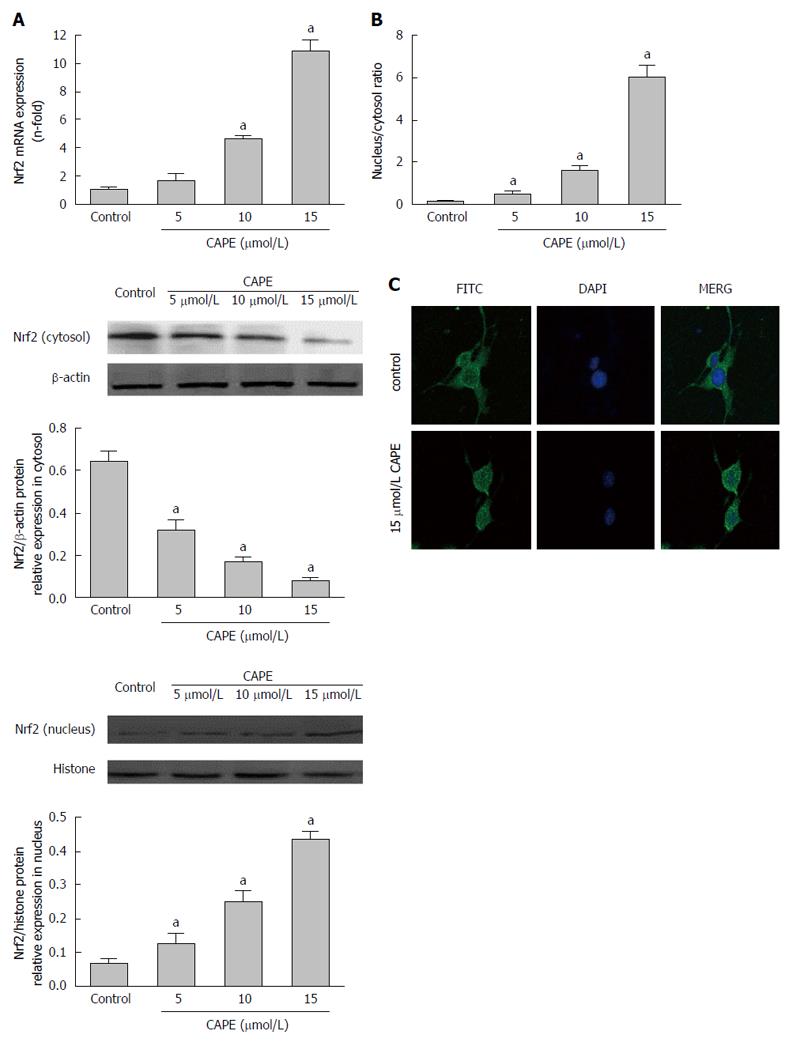
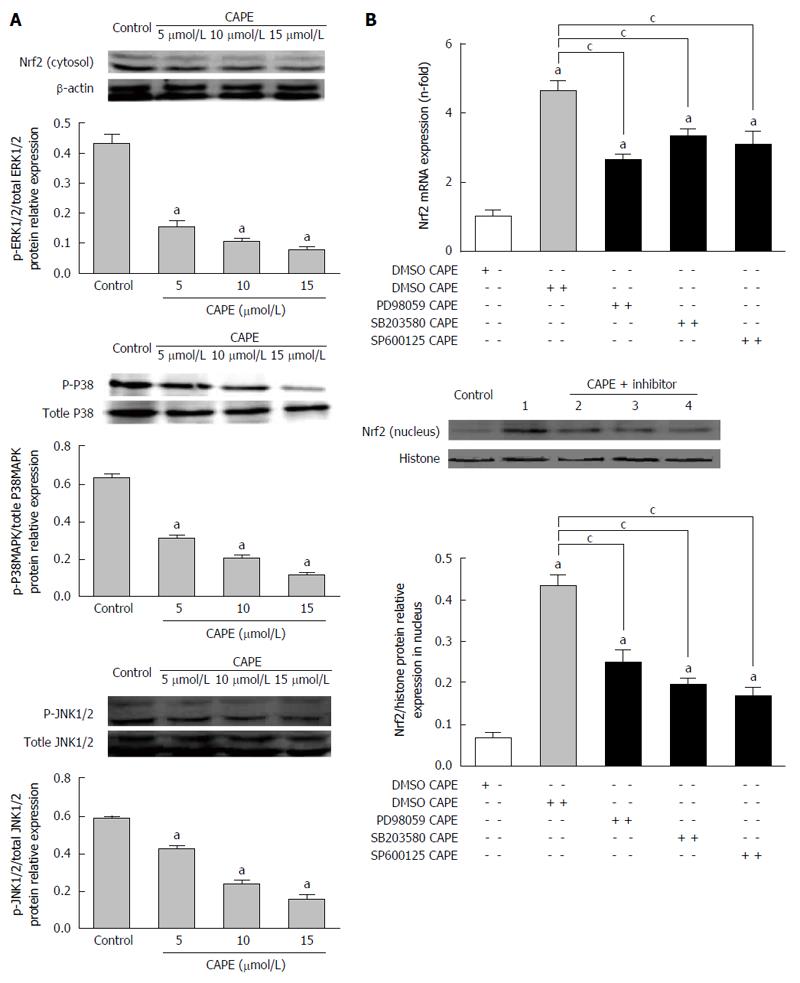
We observed that 10 μmol/L and 15 μmol/L of CAPE significantly increased Nrf2 gene expression in HSC-T6 cells (P < 0.05, Figure 4A). However, there was no alteration in Nrf2 gene expression in HSC-T6 cells in response to 5 μmol/L CAPE (P > 0.05, Figure 4A). Interestingly, Nrf2 protein expression in the cytosol was decreased in a dose-dependent manner (P < 0.05), whereas in the nucleus it was increased in a dose-dependent manner (P < 0.05) in HSC-T6 cells after treatment with CAPE (5, 10 and 15 μmol/L) for 24 h (Figure 4B). The nuclear/cytosol ratio of Nrf2 protein levels was significantly higher in CAPE-treated HSC-T6 cells than in the control group (P < 0.05, Figure 4B). Indirect immunofluorescence showed that Nrf2 protein translocated from the cytosol to the nucleus in HSC-T6 cells in the 15 μmol/L CAPE treatment group compared to the control group (Figure 4C). These results suggest that CAPE induces the activation and nuclear transcription of Nrf2.
The phosphorylation levels of ERK1/2, p38MARK and JNK1/2 were significantly increased in a dose-dependent manner in HSC-T6 cells after treatment with CAPE (5, 10 and 15 μmol/L) for 24 h compared to the control group (P < 0.05, Figure 5A). To further investigate the connection between Nrf2 and MAPKs pathways in HSC-T6 cells, HSC-T6 cells were pre-treated with the ERK1/2 inhibitor PD98059, the p38MAPK inhibitor SB203580, and the JNK1/2 inhibitor SP600125 for 2 h, followed by treatment with CAPE (15 μmol/L) for 24 h. All of the inhibitors partially decreased Nrf2 mRNA expression and nuclear/cytosol protein levels in HSC-T6 cells (P < 0.05, Figure 5B), suggesting that inhibition of MAPKs suppresses the translocation of Nrf2 protein in HSC-T6 cells.
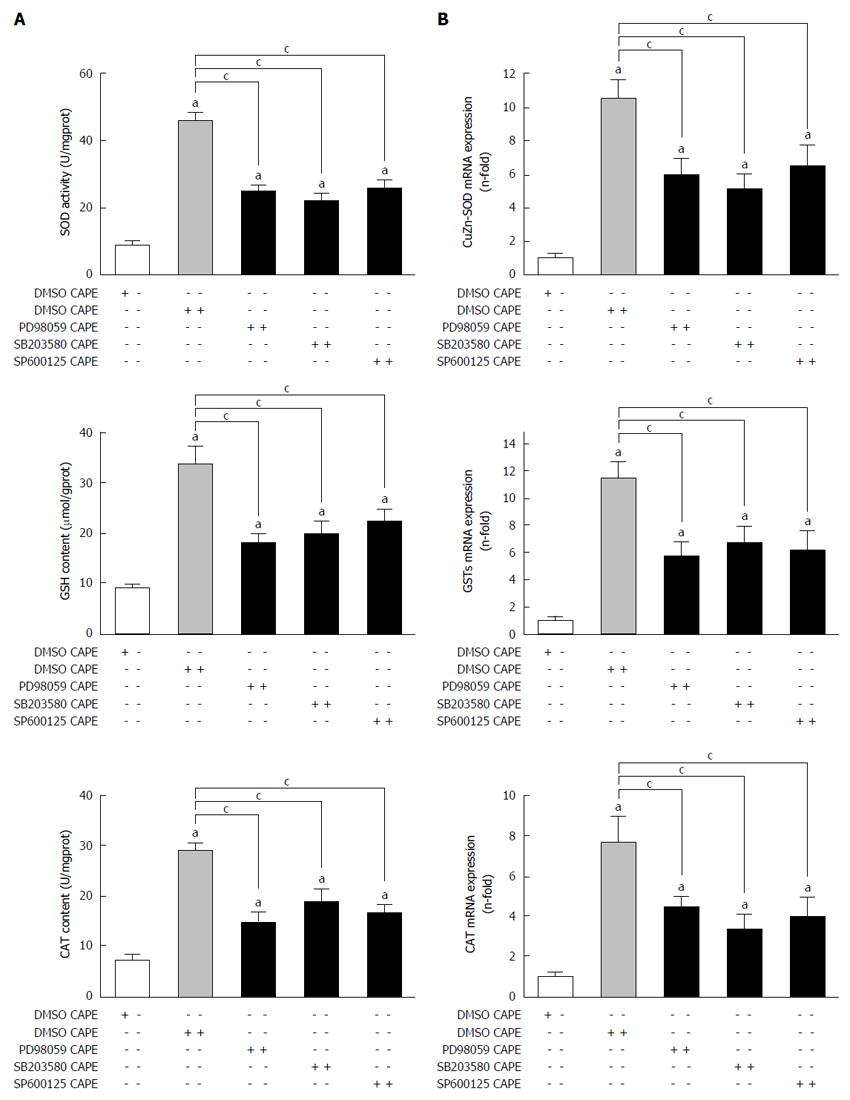
Gene and protein expression of SOD, CAT and GST was significantly decreased in HSC-T6 cells after incubation with the inhibitors of MAPKs and 15 μmol/L CAPE compared to the control group (P < 0.05, Figure 6A and B).
Previous studies have confirmed that CAPE has active biological antioxidant and anti-fibrosis properties[5,6,19,20]. Considering the fact that HSC proliferation and activation are key during liver fibrosis[21-23], it is interesting to know whether CAPE treatment can influence HSC proliferation and activation. Unfortunately, only one study has shown that CAPE inhibited HSC cell proliferation in vitro[24]. In this study, our data showed that the proliferation and activation of HSC-T6 cells were significantly inhibited and apoptosis was induced by CAPE in a dose-dependent manner. In addition, the expression of α-SMA and collegen-1 proteins was significantly reduced in HSC-T6 cells in response to CAPE. Taken together, these results suggested that CAPE inhibited HSC-T6 cell proliferation and activation, which is one of the key events initiating the occurrence and development of liver fibrosis.
CAPE has been confirmed to inhibit liver fibrosis in rats[8], in this study the results showed that CAPE increased the expression levels of SOD, CAT and GSH activities in HSC-T6 cells. Therefore, it is reasonable to suspect that CAPE may inhibit HSC cell proliferation and activation through its antioxidant effect. To confirm our hypothesis, the effect of CAPE on the expression of Nrf2, an upstream transcription factor regulating the expression of anti-oxidative stress factors, in HSC-T6 cells was investigated. Interestingly, we found that CAPE significantly increased Nrf2 gene expression in HSC-T6 cells. Moreover, CAPE treatment significantly promoted Nrf2 protein translocation from the cytosol to the nucleus in HSC-T6 cells. These results indicated that CAPE promotes the synthesis and activation of Nrf2 in HSC cells.
The precise mechanism by which CAPE regulates Nrf2 expression and activation in HSC cells is still unknown. However, previous studies have shown that MAPKs, including ERK, JNK, and p38, play a role in regulating Nrf2 expression[25-30]. Therefore, we investigated the effects of CAPE on MAPKs signaling pathways in HSC-T6 cells. Our study showed that the phosphorylation levels of ERK1/2, p38MARK and JNK1/2 were significantly increased in a dose-dependent manner in HSC-T6 cells after treatment with CAPE. Meanwhile, pretreatment of HSC-T6 cells with inhibitors significantly attenuated antioxidant enzyme expression. Moreover, all of the inhibitors partially decreased Nrf2 mRNA expression and nuclear/cytosol protein levels in HSC-T6 cells, suggesting that inhibition of MAPKs suppresses the translocation of Nrf2 protein in HSC-T6 cells. Taken together, our results are the first report that MAPKs are the key signaling pathways involved in the CAPE-induced anti-oxidative responses in cultured HSC-T6 cells.
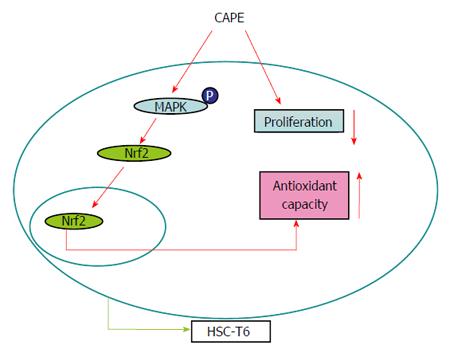
In conclusion, we demonstrated that CAPE inhibited cell proliferation, induced cell apoptosis, increased expression levels of SOD, CAT and GSH, and decreased α-SMA expression level in HSC-T6 cells by activation of the Nrf2-mediated MAPKs signaling pathways. We propose a working model of the antioxidative role and potential mechanism of CAPE in HSC-T6 cells (Figure 7). In this model, CAPE inhibits cell proliferation and activation and increases the expression levels of antioxidative enzymes in HSC-T6 cells, which might partly depend on an Nrf2-mediated MAPKs signaling pathway, and thereby is a potential anti-fibrosis agent for the treatment of human liver fibrosis.
Liver fibrosis is a pathological response to hepatocyte injury, including oxidative stress, which is a primary mechanism of liver damage. Oxidative stress can stimulate the activation of hepatic stellate cells (HSCs) through paracrine and autocrine, leading to the formation of liver fibrosis. Antioxidants play a pivotal role in the development of liver fibrosis. Caffeic acid phenethyl ester (CAPE) is a phenolic compound extracted from honeybee propolis that has strong biological properties in liver protection and as an antioxidant and anti-fibrosis agent. However, it is still largely unknown whether CAPE can reduce the expression of these factors via the Nrf2-mediated mitogen activated protein kinases (MAPKs) signaling pathway in HSC.
Previous studies proved that CAPE has active biological antioxidant and anti-fibrosis properties, also their previous studies have shown that CAPE inhibited liver fibrosis in rats.
In this study, the authors demonstrated that CAPE inhibited cell proliferation, induced cell apoptosis, increased expression levels of SOD, CAT and GSH, and decreased α-SMA expression level in HSC-T6 cells by activation of the Nrf2-mediated MAPKs signaling pathways. They propose a working model of the anti-oxidative role and potential mechanism of CAPE in HSC-T6 cells.
CAPE is a phenolic compound extracted from honeybee propolis that has strong biological properties in liver protection and as an antioxidant and anti-fibrosis agent. It has been used in the treatment of several diseases. These data also indicate that CAPE can up-regulate the antioxidant levels in HSC-T6 cells partly through the Nrf2-MAPKs signaling pathway and thereby is a potential anti-fibrosis agent for the treatment of human liver fibrosis in the future.
MAPK: a type of protein kinase that is specific to the amino acids serine, threonine, and tyrosine (i.e., a serine/threonine-specific protein kinase). MAPKs are involved in directing cellular responses to a diverse array of stimuli, such as mitogens, osmotic stress, heat shock, and proinflammatory cytokines. They regulate cell functions including proliferation, gene expression, differentiation, mitosis, cell survival, and apoptosis. CAPE: a phenolic compound extracted from honeybee propolis.
This is an interesting study showing that caffeic acid phenethyl ester up-regulates antioxidant levels in the hepatic stellate cell line. In this study, the authors investigated the antioxidation effect of caffeic acid phenethyl ester in hepatic stellate cells T6 cultured in vitro and the potential mechanisms of the effect. The effect on a-smooth muscle actin was shown using immunofluorescence. Gene and protein levels of Nrf2, including related factors and mitogen activated protein kinases, in HSC-T6 cells were detected using RT-PCR and Western blot, respectively. CAPE inhibited the proliferation and activation of HSC-T6 cells cultured in vitro. CAPE increased the antioxidant levels and the translocation of Nrf2 from the cytoplasm to the nucleus in HSC-T6 cells. Moreover, the phosphorylation of MAPKs in cells decreased in response to CAPE. Interestingly, CAPE-induced oxidative stress in the cells was significantly attenuated by pretreatment with MAPKs inhibitors. Overall, this study is well designed, and the results are interesting.
Manuscript source: Unsolicited manuscript
Specialty type: Gastroenterology and hepatology
Country of origin: China
Peer-review report classification
Grade A (Excellent): 0
Grade B (Very good): B, B
Grade C (Good): 0
Grade D (Fair): 0
Grade E (Poor): 0
P- Reviewer: Arredondo M, Kesavadevi J S- Editor: Qi Y L- Editor: Wang TQ E- Editor: Wang CH
| 1. | Mormone E, George J, Nieto N. Molecular pathogenesis of hepatic fibrosis and current therapeutic approaches. Chem Biol Interact. 2011;193:225-231. [RCA] [PubMed] [DOI] [Full Text] [Cited by in Crossref: 179] [Cited by in RCA: 198] [Article Influence: 14.1] [Reference Citation Analysis (0)] |
| 2. | Bansal R, Nagórniewicz B, Prakash J. Clinical Advancements in the Targeted Therapies against Liver Fibrosis. Mediators Inflamm. 2016;2016:7629724. [PubMed] |
| 3. | Vogel S, Piantedosi R, Frank J, Lalazar A, Rockey DC, Friedman SL, Blaner WS. An immortalized rat liver stellate cell line (HSC-T6): a new cell model for the study of retinoid metabolism in vitro. J Lipid Res. 2000;41:882-893. [PubMed] |
| 4. | He L, Li Z, Zhou D, Ding Y, Xu L, Chen Y, Fan J. Galanin receptor 2 mediates antifibrogenic effects of galanin on hepatic stellate cells. Exp Ther Med. 2016;12:3375-3380. [RCA] [PubMed] [DOI] [Full Text] [Cited by in Crossref: 7] [Cited by in RCA: 3] [Article Influence: 0.3] [Reference Citation Analysis (0)] |
| 5. | Márquez N, Sancho R, Macho A, Calzado MA, Fiebich BL, Muñoz E. Caffeic acid phenethyl ester inhibits T-cell activation by targeting both nuclear factor of activated T-cells and NF-kappaB transcription factors. J Pharmacol Exp Ther. 2004;308:993-1001. [RCA] [PubMed] [DOI] [Full Text] [Cited by in Crossref: 114] [Cited by in RCA: 110] [Article Influence: 5.2] [Reference Citation Analysis (0)] |
| 6. | Altuğ ME, Serarslan Y, Bal R, Kontaş T, Ekici F, Melek IM, Aslan H, Duman T. Caffeic acid phenethyl ester protects rabbit brains against permanent focal ischemia by antioxidant action: a biochemical and planimetric study. Brain Res. 2008;1201:135-142. [RCA] [PubMed] [DOI] [Full Text] [Cited by in RCA: 19] [Reference Citation Analysis (0)] |
| 7. | Shi Y, Guo L, Shi L, Yu J, Song M, Li Y. Caffeic Acid Phenethyl Ester inhibit Hepatic Fibrosis by Nitric Oxide Synthase and Cystathionine Gamma-Lyase in Rats. Med Sci Monit. 2015;21:2774-2780. [RCA] [PubMed] [DOI] [Full Text] [Full Text (PDF)] [Cited by in Crossref: 7] [Cited by in RCA: 8] [Article Influence: 0.8] [Reference Citation Analysis (0)] |
| 8. | Li M, Wang XF, Shi JJ, Li YP, Yang N, Zhai S, Dang SS. Caffeic acid phenethyl ester inhibits liver fibrosis in rats. World J Gastroenterol. 2015;21:3893-3903. [RCA] [PubMed] [DOI] [Full Text] [Full Text (PDF)] [Cited by in CrossRef: 44] [Cited by in RCA: 44] [Article Influence: 4.4] [Reference Citation Analysis (1)] |
| 9. | Ho YS, Xiong Y, Ma W, Spector A, Ho DS. Mice lacking catalase develop normally but show differential sensitivity to oxidant tissue injury. J Biol Chem. 2004;279:32804-32812. [RCA] [PubMed] [DOI] [Full Text] [Cited by in Crossref: 276] [Cited by in RCA: 277] [Article Influence: 13.2] [Reference Citation Analysis (0)] |
| 10. | Eggler AL, Gay KA, Mesecar AD. Molecular mechanisms of natural products in chemoprevention: induction of cytoprotective enzymes by Nrf2. Mol Nutr Food Res. 2008;52 Suppl 1:S84-S94. [RCA] [PubMed] [DOI] [Full Text] [Cited by in Crossref: 47] [Cited by in RCA: 87] [Article Influence: 5.1] [Reference Citation Analysis (0)] |
| 11. | Edeas M, Attaf D, Mailfert AS, Nasu M, Joubet R. Maillard reaction, mitochondria and oxidative stress: potential role of antioxidants. Pathol Biol (Paris). 2010;58:220-225. [RCA] [PubMed] [DOI] [Full Text] [Cited by in Crossref: 42] [Cited by in RCA: 41] [Article Influence: 2.6] [Reference Citation Analysis (0)] |
| 12. | Kim J, Cha YN, Surh YJ. A protective role of nuclear factor-erythroid 2-related factor-2 (Nrf2) in inflammatory disorders. Mutat Res. 2010;690:12-23. [RCA] [PubMed] [DOI] [Full Text] [Cited by in Crossref: 474] [Cited by in RCA: 559] [Article Influence: 34.9] [Reference Citation Analysis (1)] |
| 13. | Jain AK, Bloom DA, Jaiswal AK. Nuclear import and export signals in control of Nrf2. J Biol Chem. 2005;280:29158-29168. [RCA] [PubMed] [DOI] [Full Text] [Cited by in Crossref: 110] [Cited by in RCA: 112] [Article Influence: 5.6] [Reference Citation Analysis (0)] |
| 14. | Shi JJ, Jia XL, Li M, Yang N, Li YP, Zhang X, Gao N, Dang SS. Guggulsterone induces apoptosis of human hepatocellular carcinoma cells through intrinsic mitochondrial pathway. World J Gastroenterol. 2015;21:13277-13287. [RCA] [PubMed] [DOI] [Full Text] [Full Text (PDF)] [Cited by in CrossRef: 20] [Cited by in RCA: 19] [Article Influence: 1.9] [Reference Citation Analysis (0)] |
| 15. | Sun MZ, Dang SS, Wang WJ, Jia XL, Zhai S, Zhang X, Li M, Li YP, Xun M. Cytokeratin 8 is increased in hepatitis C virus cells and its ectopic expression induces apoptosis of SMMC7721 cells. World J Gastroenterol. 2013;19:6178-6187. [RCA] [PubMed] [DOI] [Full Text] [Full Text (PDF)] [Cited by in CrossRef: 5] [Cited by in RCA: 4] [Article Influence: 0.3] [Reference Citation Analysis (0)] |
| 16. | Dang SS, Sun MZ, Yang E, Xun M, Ma L, Jia ZS, Wang WJ, Jia XL. Prohibitin is overexpressed in Huh-7-HCV and Huh-7.5-HCV cells harboring in vitro transcribed full-length hepatitis C virus RNA. Virol J. 2011;8:424. [RCA] [PubMed] [DOI] [Full Text] [Full Text (PDF)] [Cited by in Crossref: 10] [Cited by in RCA: 11] [Article Influence: 0.8] [Reference Citation Analysis (0)] |
| 17. | Schmittgen TD, Livak KJ. Analyzing real-time PCR data by the comparative C(T) method. Nat Protoc. 2008;3:1101-1108. [PubMed] |
| 18. | Bradford MM. A rapid and sensitive method for the quantitation of microgram quantities of protein utilizing the principle of protein-dye binding. Anal Biochem. 1976;72:248-254. [PubMed] |
| 19. | Zhao WX, Zhao J, Liang CL, Zhao B, Pang RQ, Pan XH. Effect of caffeic acid phenethyl ester on proliferation and apoptosis of hepatic stellate cells in vitro. World J Gastroenterol. 2003;9:1278-1281. [RCA] [PubMed] [DOI] [Full Text] [Full Text (PDF)] [Cited by in CrossRef: 12] [Cited by in RCA: 12] [Article Influence: 0.5] [Reference Citation Analysis (0)] |
| 20. | Jia CH, Wang XY, Qi JF, Hong ST, Lee KT. Antioxidant Properties of Caffeic acid Phenethyl Ester and 4-Vinylcatechol in Stripped Soybean Oil. J Food Sci. 2016;81:C35-C41. [RCA] [PubMed] [DOI] [Full Text] [Cited by in Crossref: 11] [Cited by in RCA: 12] [Article Influence: 1.2] [Reference Citation Analysis (0)] |
| 21. | Rockey DC. The cell and molecular biology of hepatic fibrogenesis. Clinical and therapeutic implications. Clin Liver Dis. 2000;4:319-355. [RCA] [PubMed] [DOI] [Full Text] [Cited by in RCA: 1] [Reference Citation Analysis (0)] |
| 22. | Fagone P, Mangano K, Mammana S, Pesce A, Pesce A, Caltabiano R, Giorlandino A, Portale TR, Cavalli E, Lombardo GA. Identification of novel targets for the diagnosis and treatment of liver fibrosis. Int J Mol Med. 2015;36:747-752. [PubMed] |
| 23. | Romanelli RG, Stasi C. Recent Advancements in Diagnosis and Therapy of Liver Cirrhosis. Curr Drug Targets. 2016;17:1804-1817. [RCA] [PubMed] [DOI] [Full Text] [Cited by in Crossref: 73] [Cited by in RCA: 70] [Article Influence: 7.8] [Reference Citation Analysis (0)] |
| 24. | Roos TU, Heiss EH, Schwaiberger AV, Schachner D, Sroka IM, Oberan T, Vollmar AM, Dirsch VM. Caffeic acid phenethyl ester inhibits PDGF-induced proliferation of vascular smooth muscle cells via activation of p38 MAPK, HIF-1α, and heme oxygenase-1. J Nat Prod. 2011;74:352-356. [RCA] [PubMed] [DOI] [Full Text] [Cited by in Crossref: 31] [Cited by in RCA: 35] [Article Influence: 2.5] [Reference Citation Analysis (0)] |
| 25. | Kang ES, Woo IS, Kim HJ, Eun SY, Paek KS, Kim HJ, Chang KC, Lee JH, Lee HT, Kim JH. Up-regulation of aldose reductase expression mediated by phosphatidylinositol 3-kinase/Akt and Nrf2 is involved in the protective effect of curcumin against oxidative damage. Free Radic Biol Med. 2007;43:535-545. [RCA] [PubMed] [DOI] [Full Text] [Cited by in Crossref: 86] [Cited by in RCA: 81] [Article Influence: 4.5] [Reference Citation Analysis (0)] |
| 26. | Lubet RA, Yao R, Grubbs CJ, You M, Wang Y. Induced expression of drug metabolizing enzymes by preventive agents: role of the antioxidant response element. Chem Biol Interact. 2009;182:22-28. [RCA] [PubMed] [DOI] [Full Text] [Cited by in Crossref: 10] [Cited by in RCA: 11] [Article Influence: 0.7] [Reference Citation Analysis (0)] |
| 27. | Chen CY, Jang JH, Li MH, Surh YJ. Resveratrol upregulates heme oxygenase-1 expression via activation of NF-E2-related factor 2 in PC12 cells. Biochem Biophys Res Commun. 2005;331:993-1000. [PubMed] |
| 28. | Hyung JH, Ahn CB, Il Kim B, Kim K, Je JY. Involvement of Nrf2-mediated heme oxygenase-1 expression in anti-inflammatory action of chitosan oligosaccharides through MAPK activation in murine macrophages. Eur J Pharmacol. 2016;793:43-48. [RCA] [PubMed] [DOI] [Full Text] [Cited by in RCA: 22] [Reference Citation Analysis (0)] |
| 29. | Kadam PD, Chuan HH. Erratum to: Rectocutaneous fistula with transmigration of the suture: a rare delayed complication of vault fixation with the sacrospinous ligament. Int Urogynecol J. 2016;27:505. [PubMed] |
| 30. | Ahn CB, Je JY, Kim YS, Park SJ, Kim BI. Induction of Nrf2-mediated phase II detoxifying/antioxidant enzymes in vitro by chitosan-caffeic acid against hydrogen peroxide-induced hepatotoxicity through JNK/ERK pathway. Mol Cell Biochem. 2017;424:79-86. [RCA] [PubMed] [DOI] [Full Text] [Cited by in Crossref: 21] [Cited by in RCA: 24] [Article Influence: 2.7] [Reference Citation Analysis (0)] |


