Copyright
©The Author(s) 2017.
World J Gastroenterol. Feb 21, 2017; 23(7): 1203-1214
Published online Feb 21, 2017. doi: 10.3748/wjg.v23.i7.1203
Published online Feb 21, 2017. doi: 10.3748/wjg.v23.i7.1203
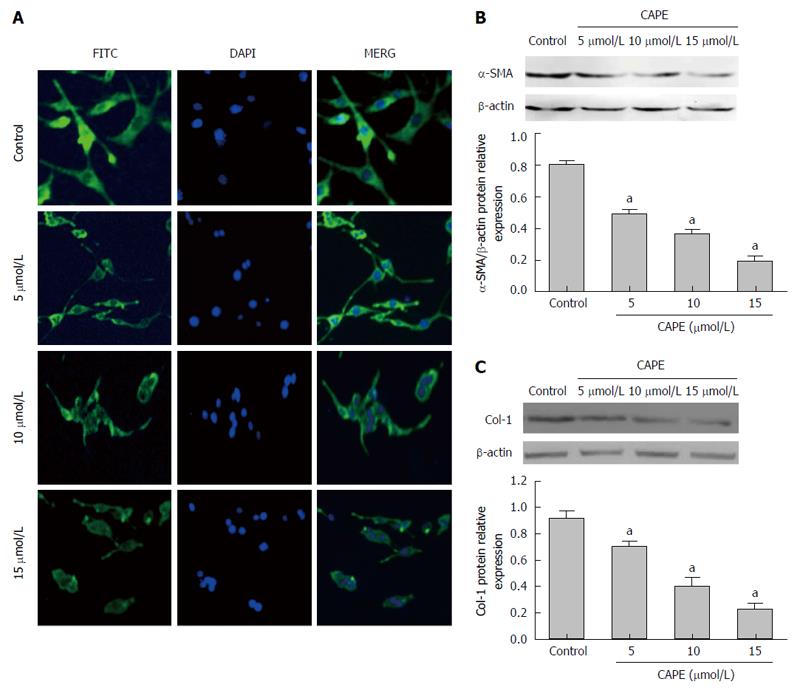
Figure 2 α-SMA and collegen-1 protein expression in hepatic stellate cell-T6 cells.
After HSC-T6 cells were treated with 5 μmol/L, 10 μmol/L and 15 μmol/L CAPE for 24 h, indirect immunofluorescence (× 200) analysis of α-SMA protein expression (A) were undertaken. Western blot analysis of α-SMA and collegen-1 protein expression was also performed. Gray levels were normalized against those of the corresponding β-actin and the results are expressed relative to control (B and C). The data are the mean ± SD of three independent experiments. aP < 0.05 vs control. CAPE: Caffeic acid phenethyl ester.
- Citation: Yang N, Shi JJ, Wu FP, Li M, Zhang X, Li YP, Zhai S, Jia XL, Dang SS. Caffeic acid phenethyl ester up-regulates antioxidant levels in hepatic stellate cell line T6 via an Nrf2-mediated mitogen activated protein kinases pathway. World J Gastroenterol 2017; 23(7): 1203-1214
- URL: https://www.wjgnet.com/1007-9327/full/v23/i7/1203.htm
- DOI: https://dx.doi.org/10.3748/wjg.v23.i7.1203


