
















Copyright: ©Author(s) 2026.
World J Gastroenterol. Jan 21, 2027; 33(3): 125206
Published online Jan 21, 2027. doi: 10.3748/wjg.125206
Published online Jan 21, 2027. doi: 10.3748/wjg.125206
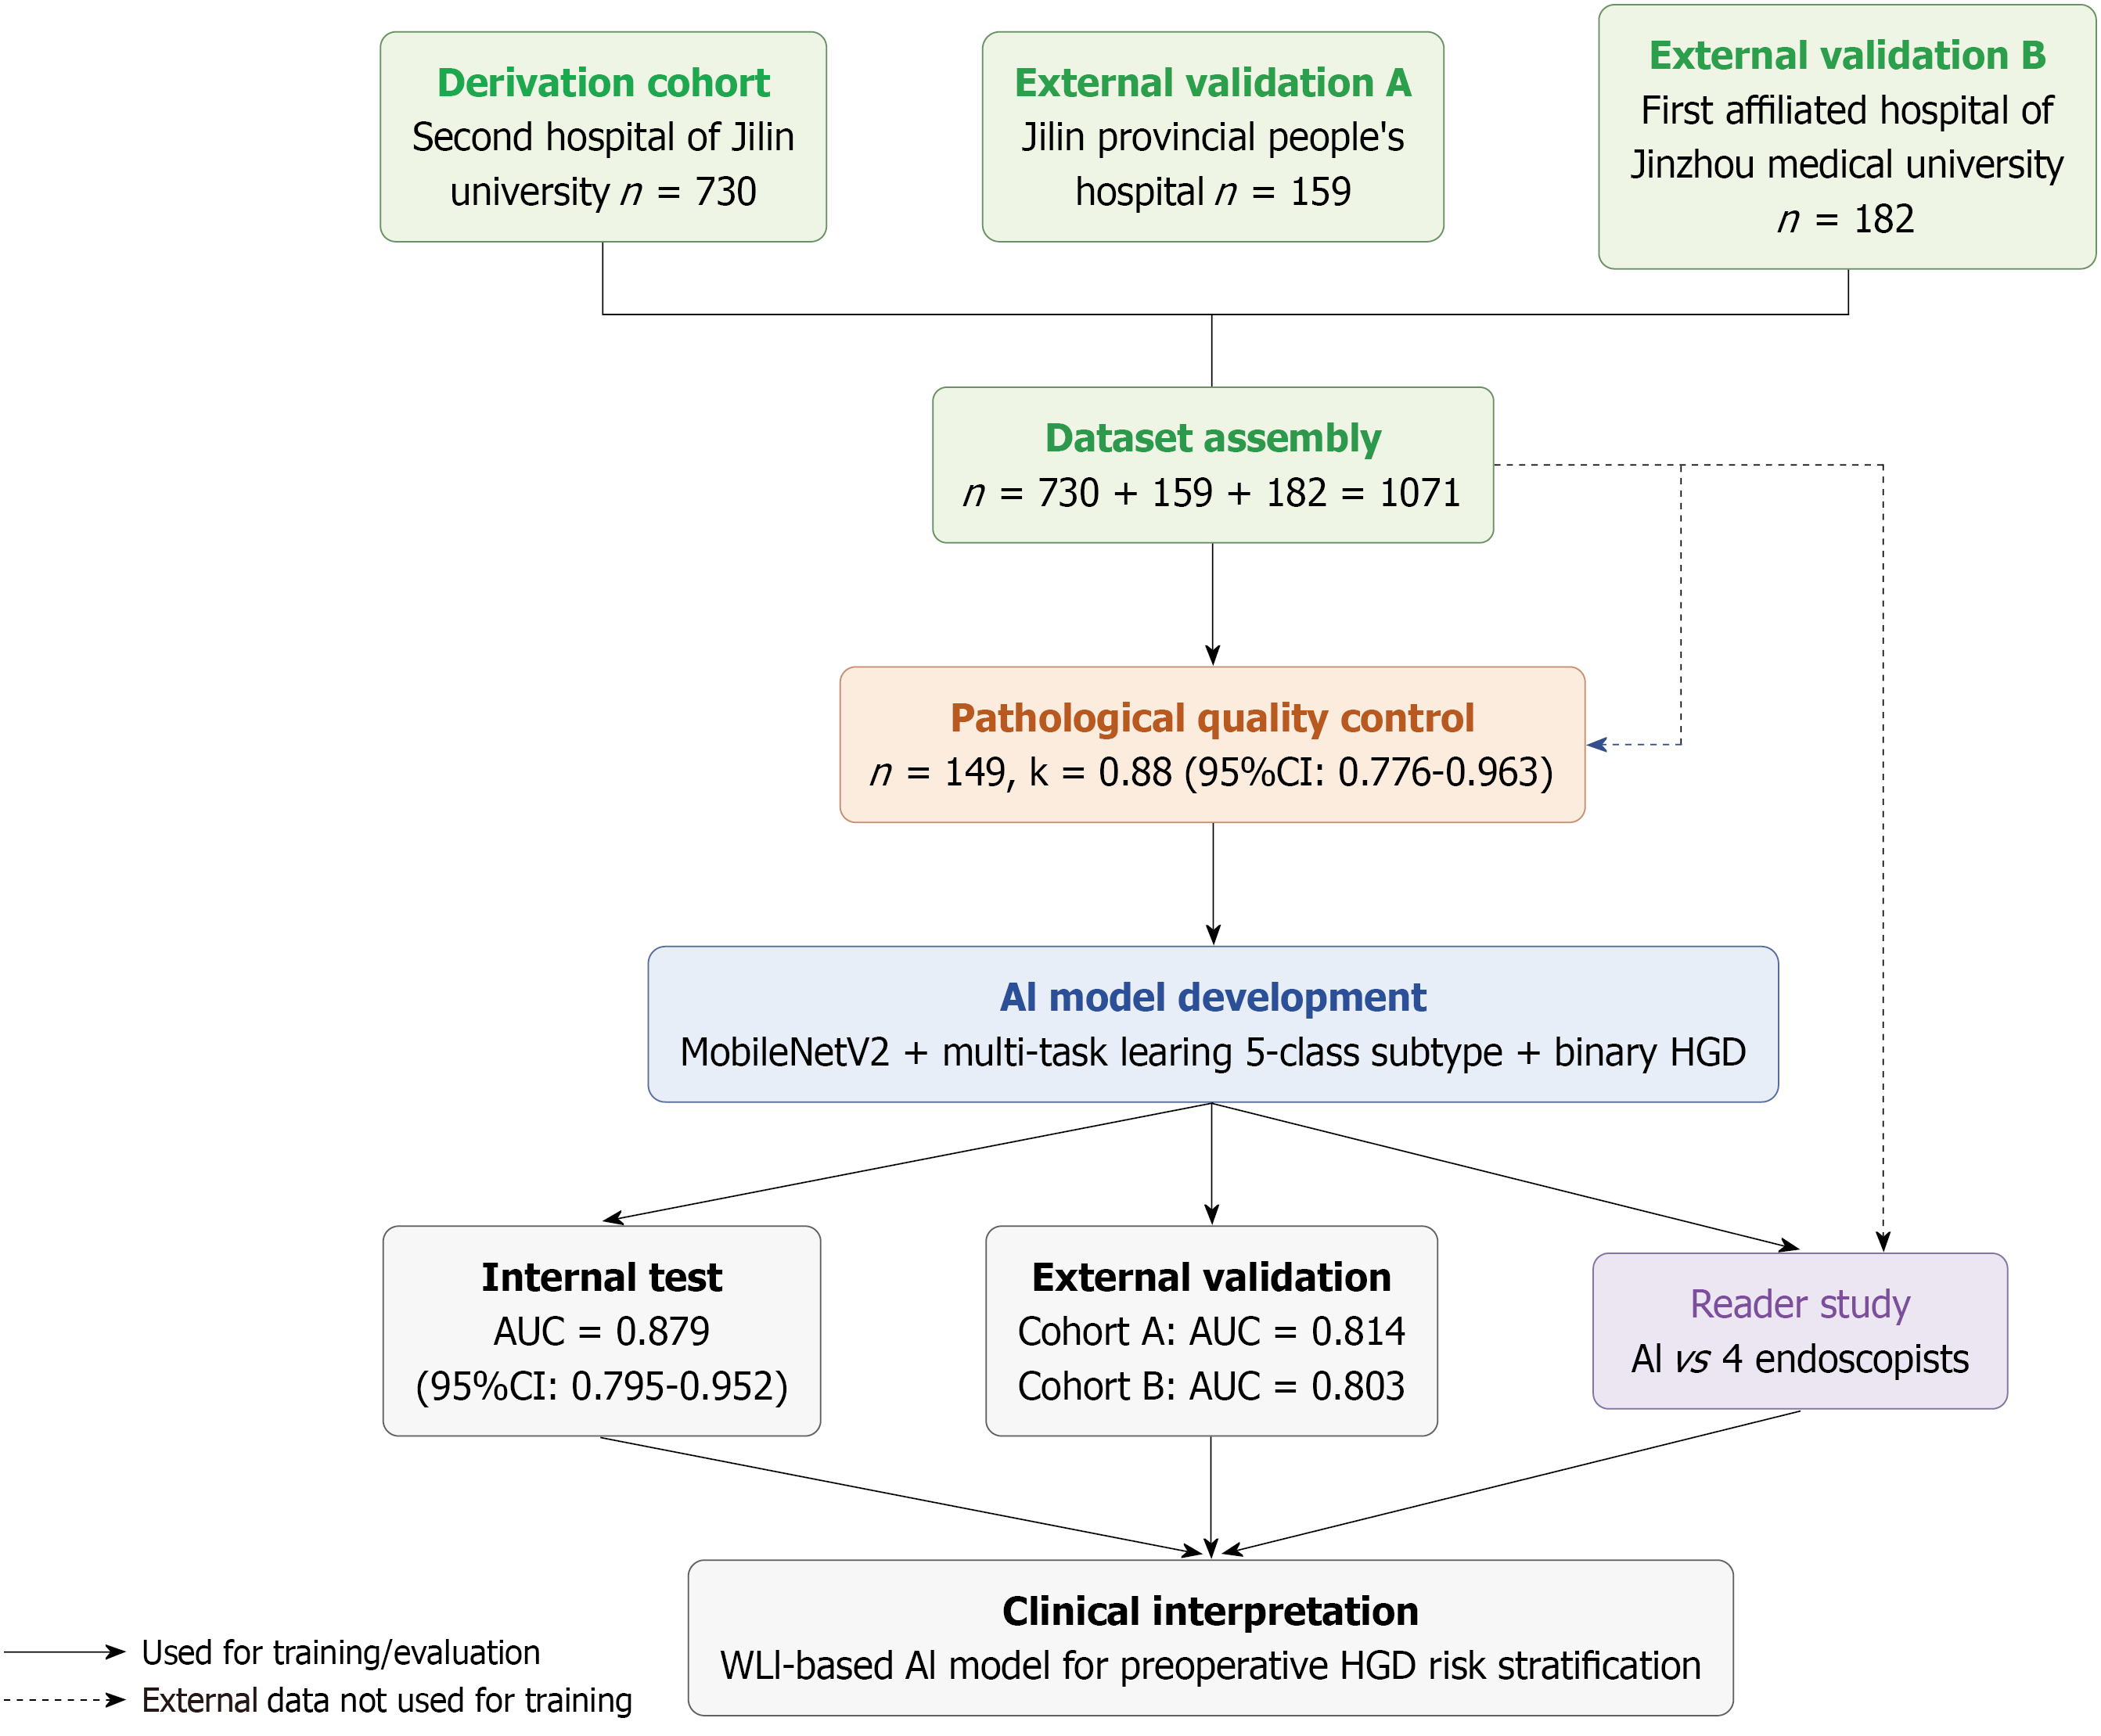
Figure 1 Overall study workflow.
The study comprised six phases: (1) Data collection from three participating centers (derivation cohort, n = 730; external validation cohort A, n = 159; and external validation cohort B, n = 182); (2) Dataset assembly (n = 1071); (3) Pathological quality control review (n = 149, κ = 0.88, 95% confidence interval: 0.776-0.963); (4) Artificial intelligence model development using MobileNetV2 with multi-task learning (5-class subtype classification and binary high-grade dysplasia prediction); (5) Model evaluation including internal testing, external validation, and a reader study comparing artificial intelligence with four endoscopists; and (6) Clinical interpretation of the white-light imaging-based model for preoperative high-grade dysplasia risk stratification. Dashed arrows indicate external validation data that were not used for model development or training. CI: Confidence interval; HGD: High-grade dysplasia; AUC: Area under the curve; AI: Artificial intelligence; WLI: White-light imaging.
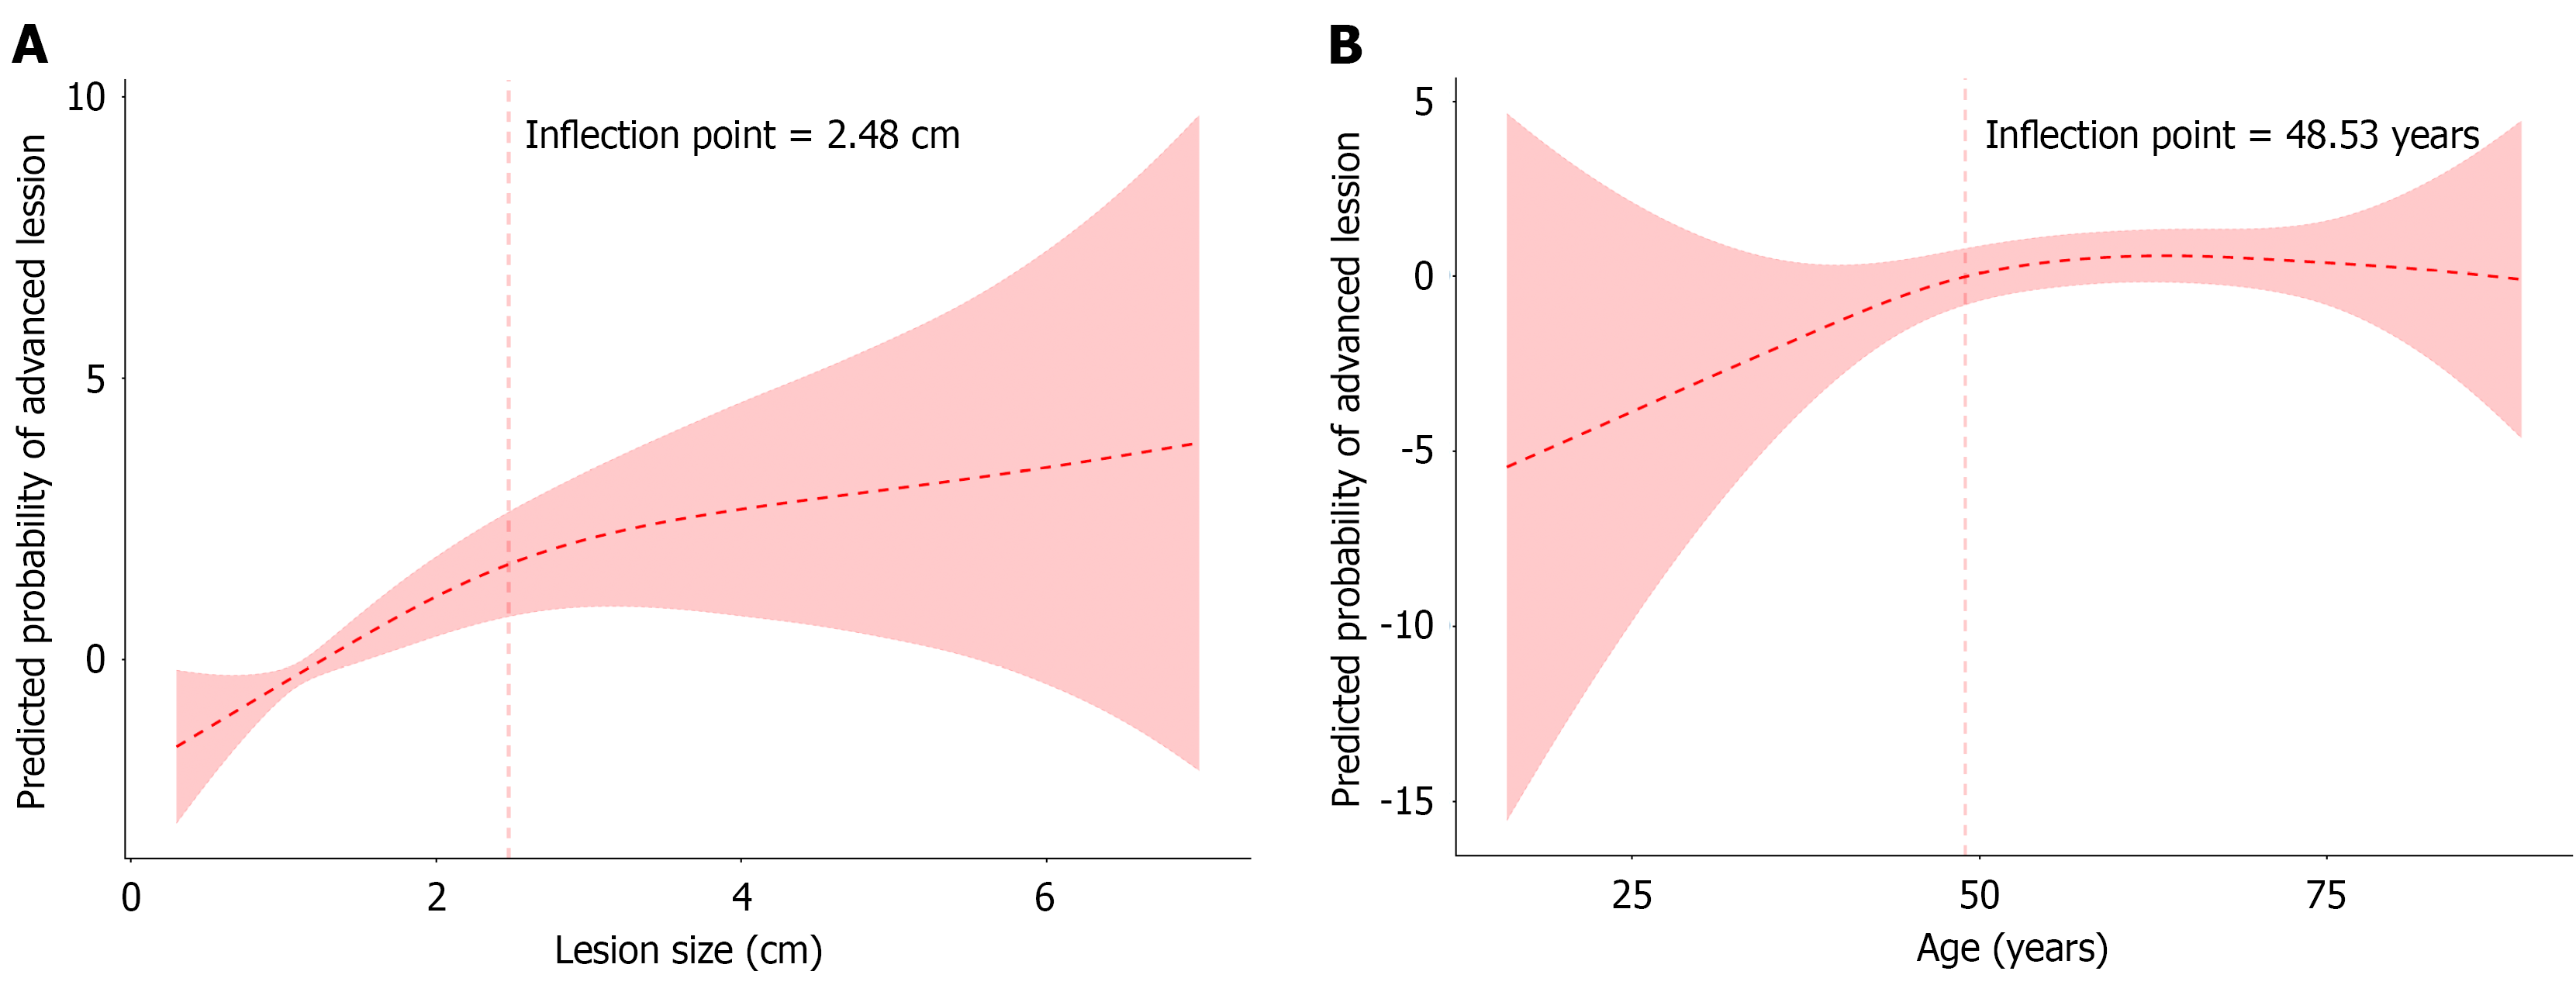
Figure 2 Non-linear associations between lesion size, age, and lesions with high-grade dysplasia.
A: Lesion size; B: Age. Two-piecewise regression models demonstrated inflection points at 2.48 cm for lesion size and 48.53 years for age, indicating threshold effects in high-grade dysplasia risk. Solid lines represent the fitted two-piecewise regression curves; shaded areas represent 95% confidence intervals.
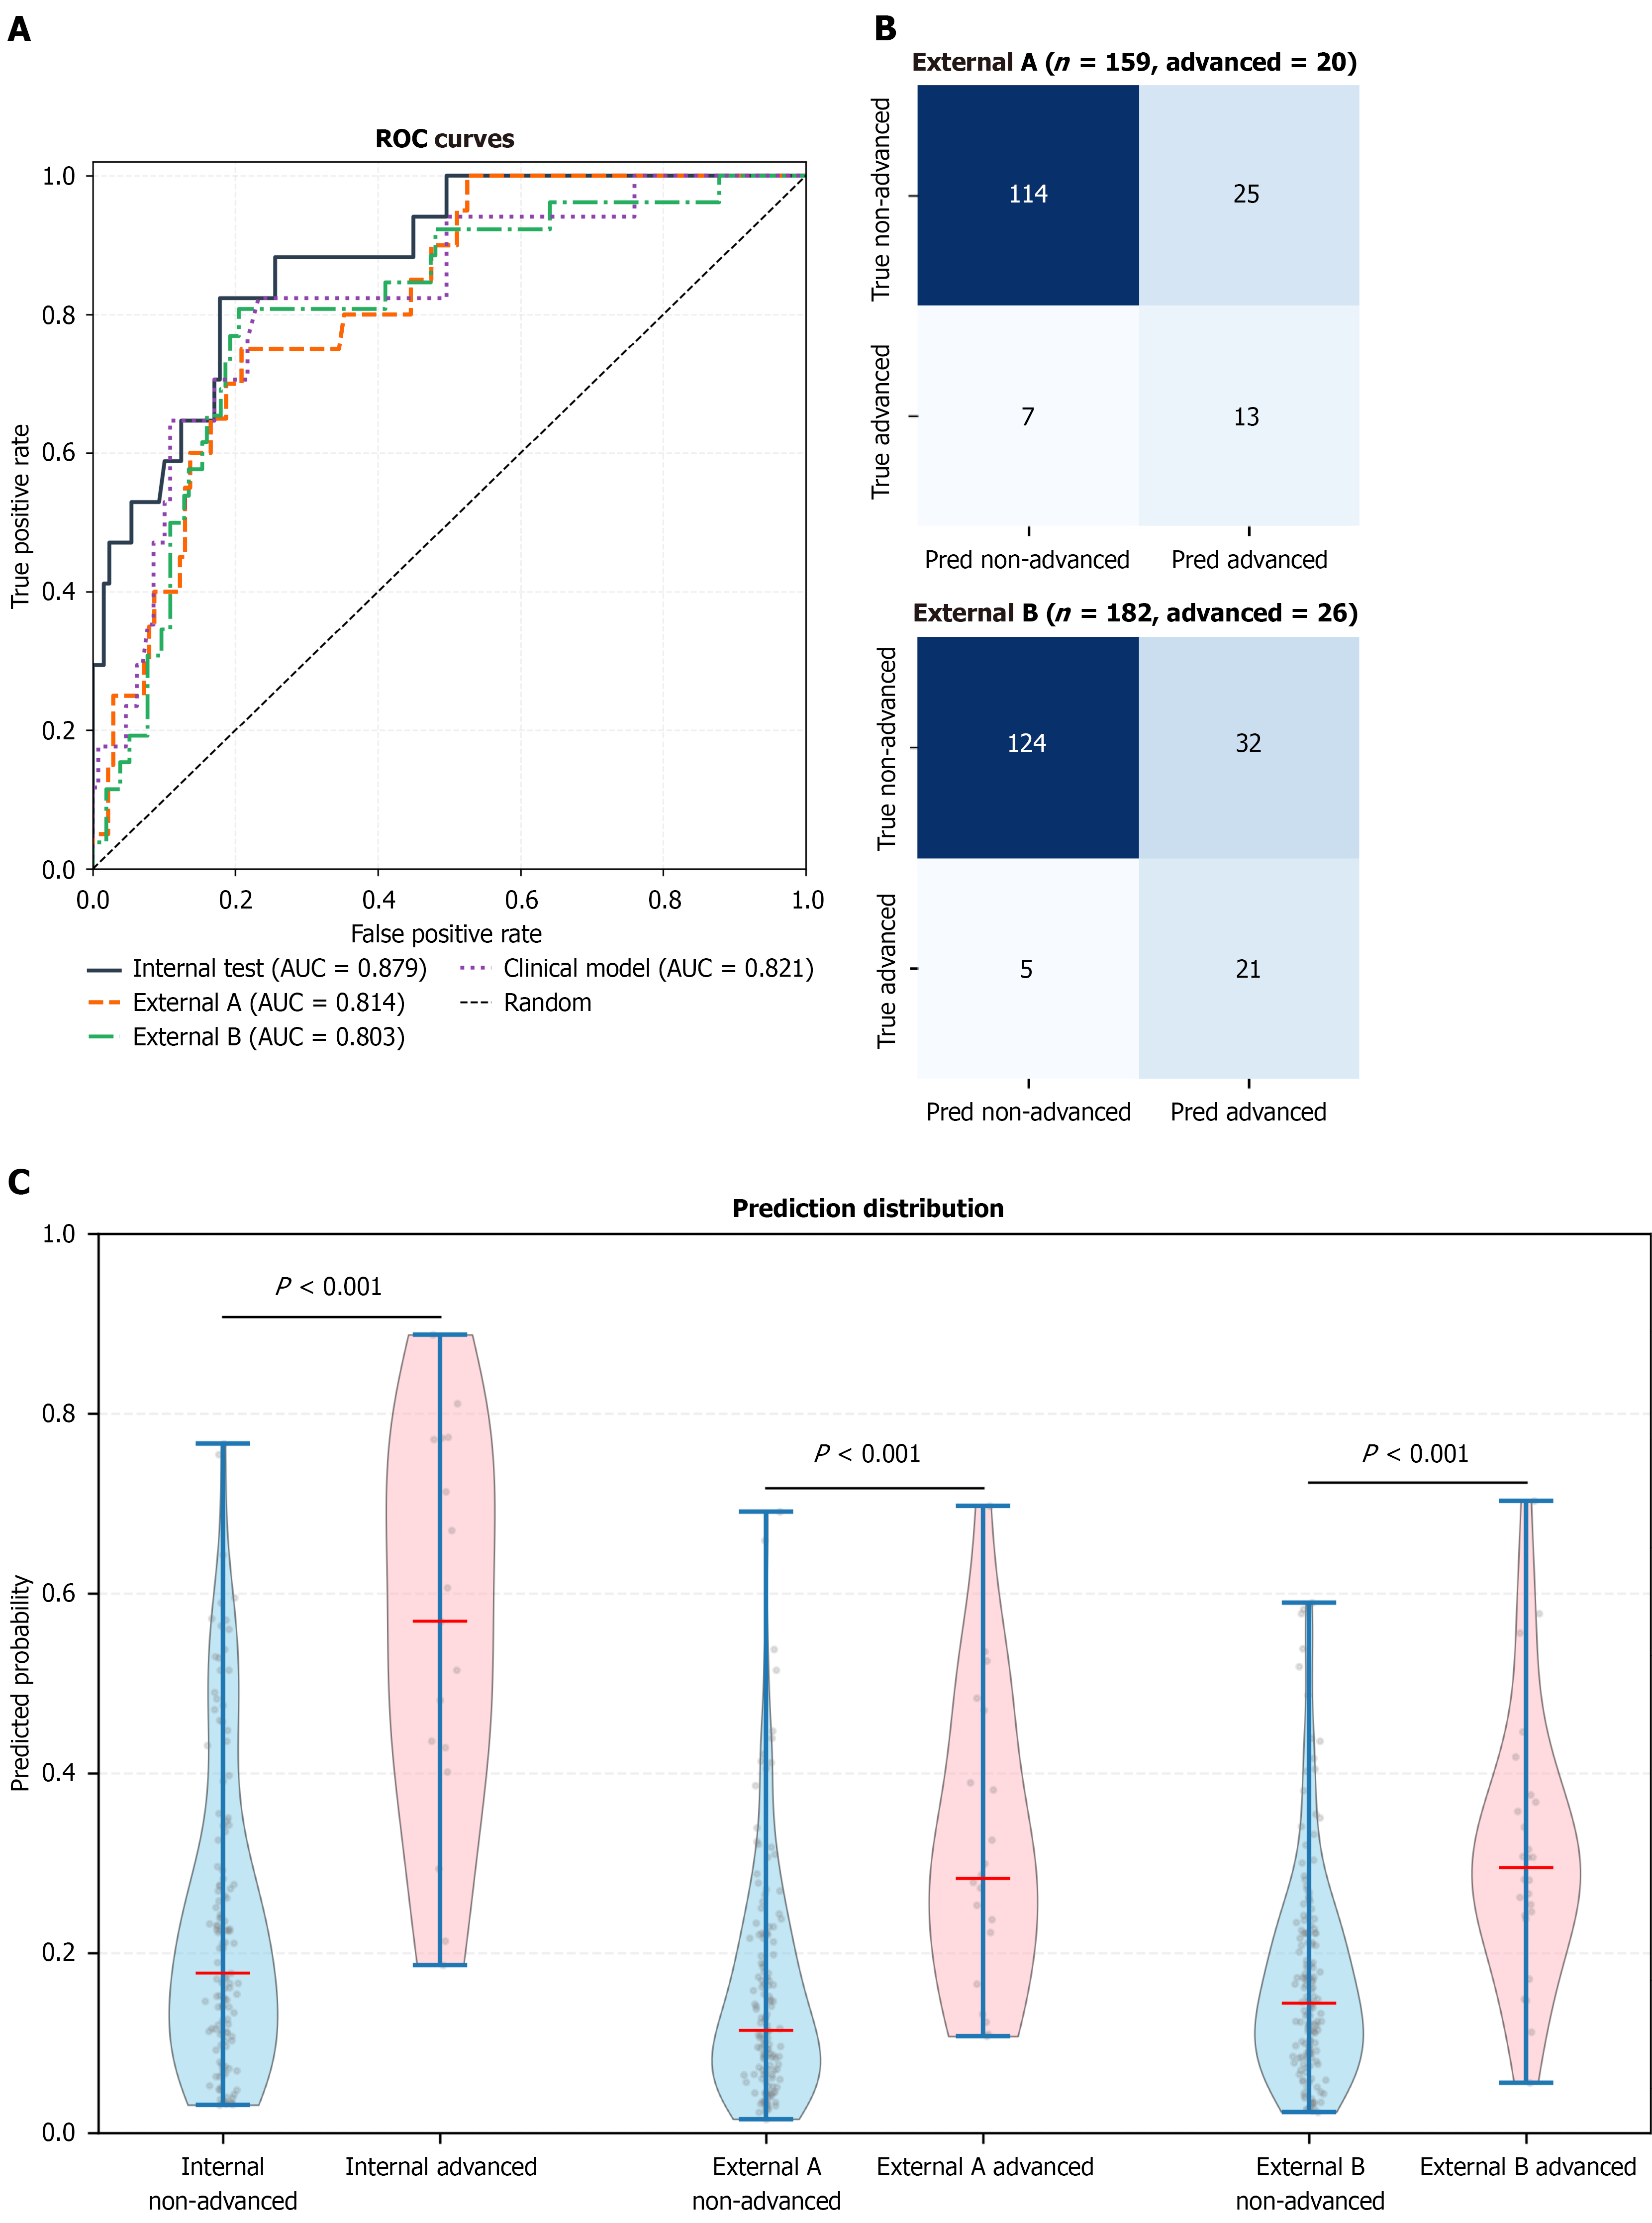
Figure 3 Model performance in the internal test and external validation cohorts.
A: Receiver operating characteristic curves showing discrimination of the white-light imaging-based model in the internal test cohort (area under the curve 0.879), external validation cohort A (area under the curve 0.814), and external validation cohort B (area under the curve 0.803). The diagonal dashed line represents the performance of a random classifier; B: Confusion matrices for external validation cohort A and external validation cohort B at the prespecified threshold of 0.2381; C: Predicted probability distributions showing separation between advanced and non-advanced lesions in the internal test cohort and both external validation cohorts (all P < 0.001, Mann-Whitney U test). Boxes represent interquartile ranges; whiskers represent 1.5 × interquartile range; horizontal lines indicate medians. ROC: Receiver operating characteristic; AUC: Area under the curve.
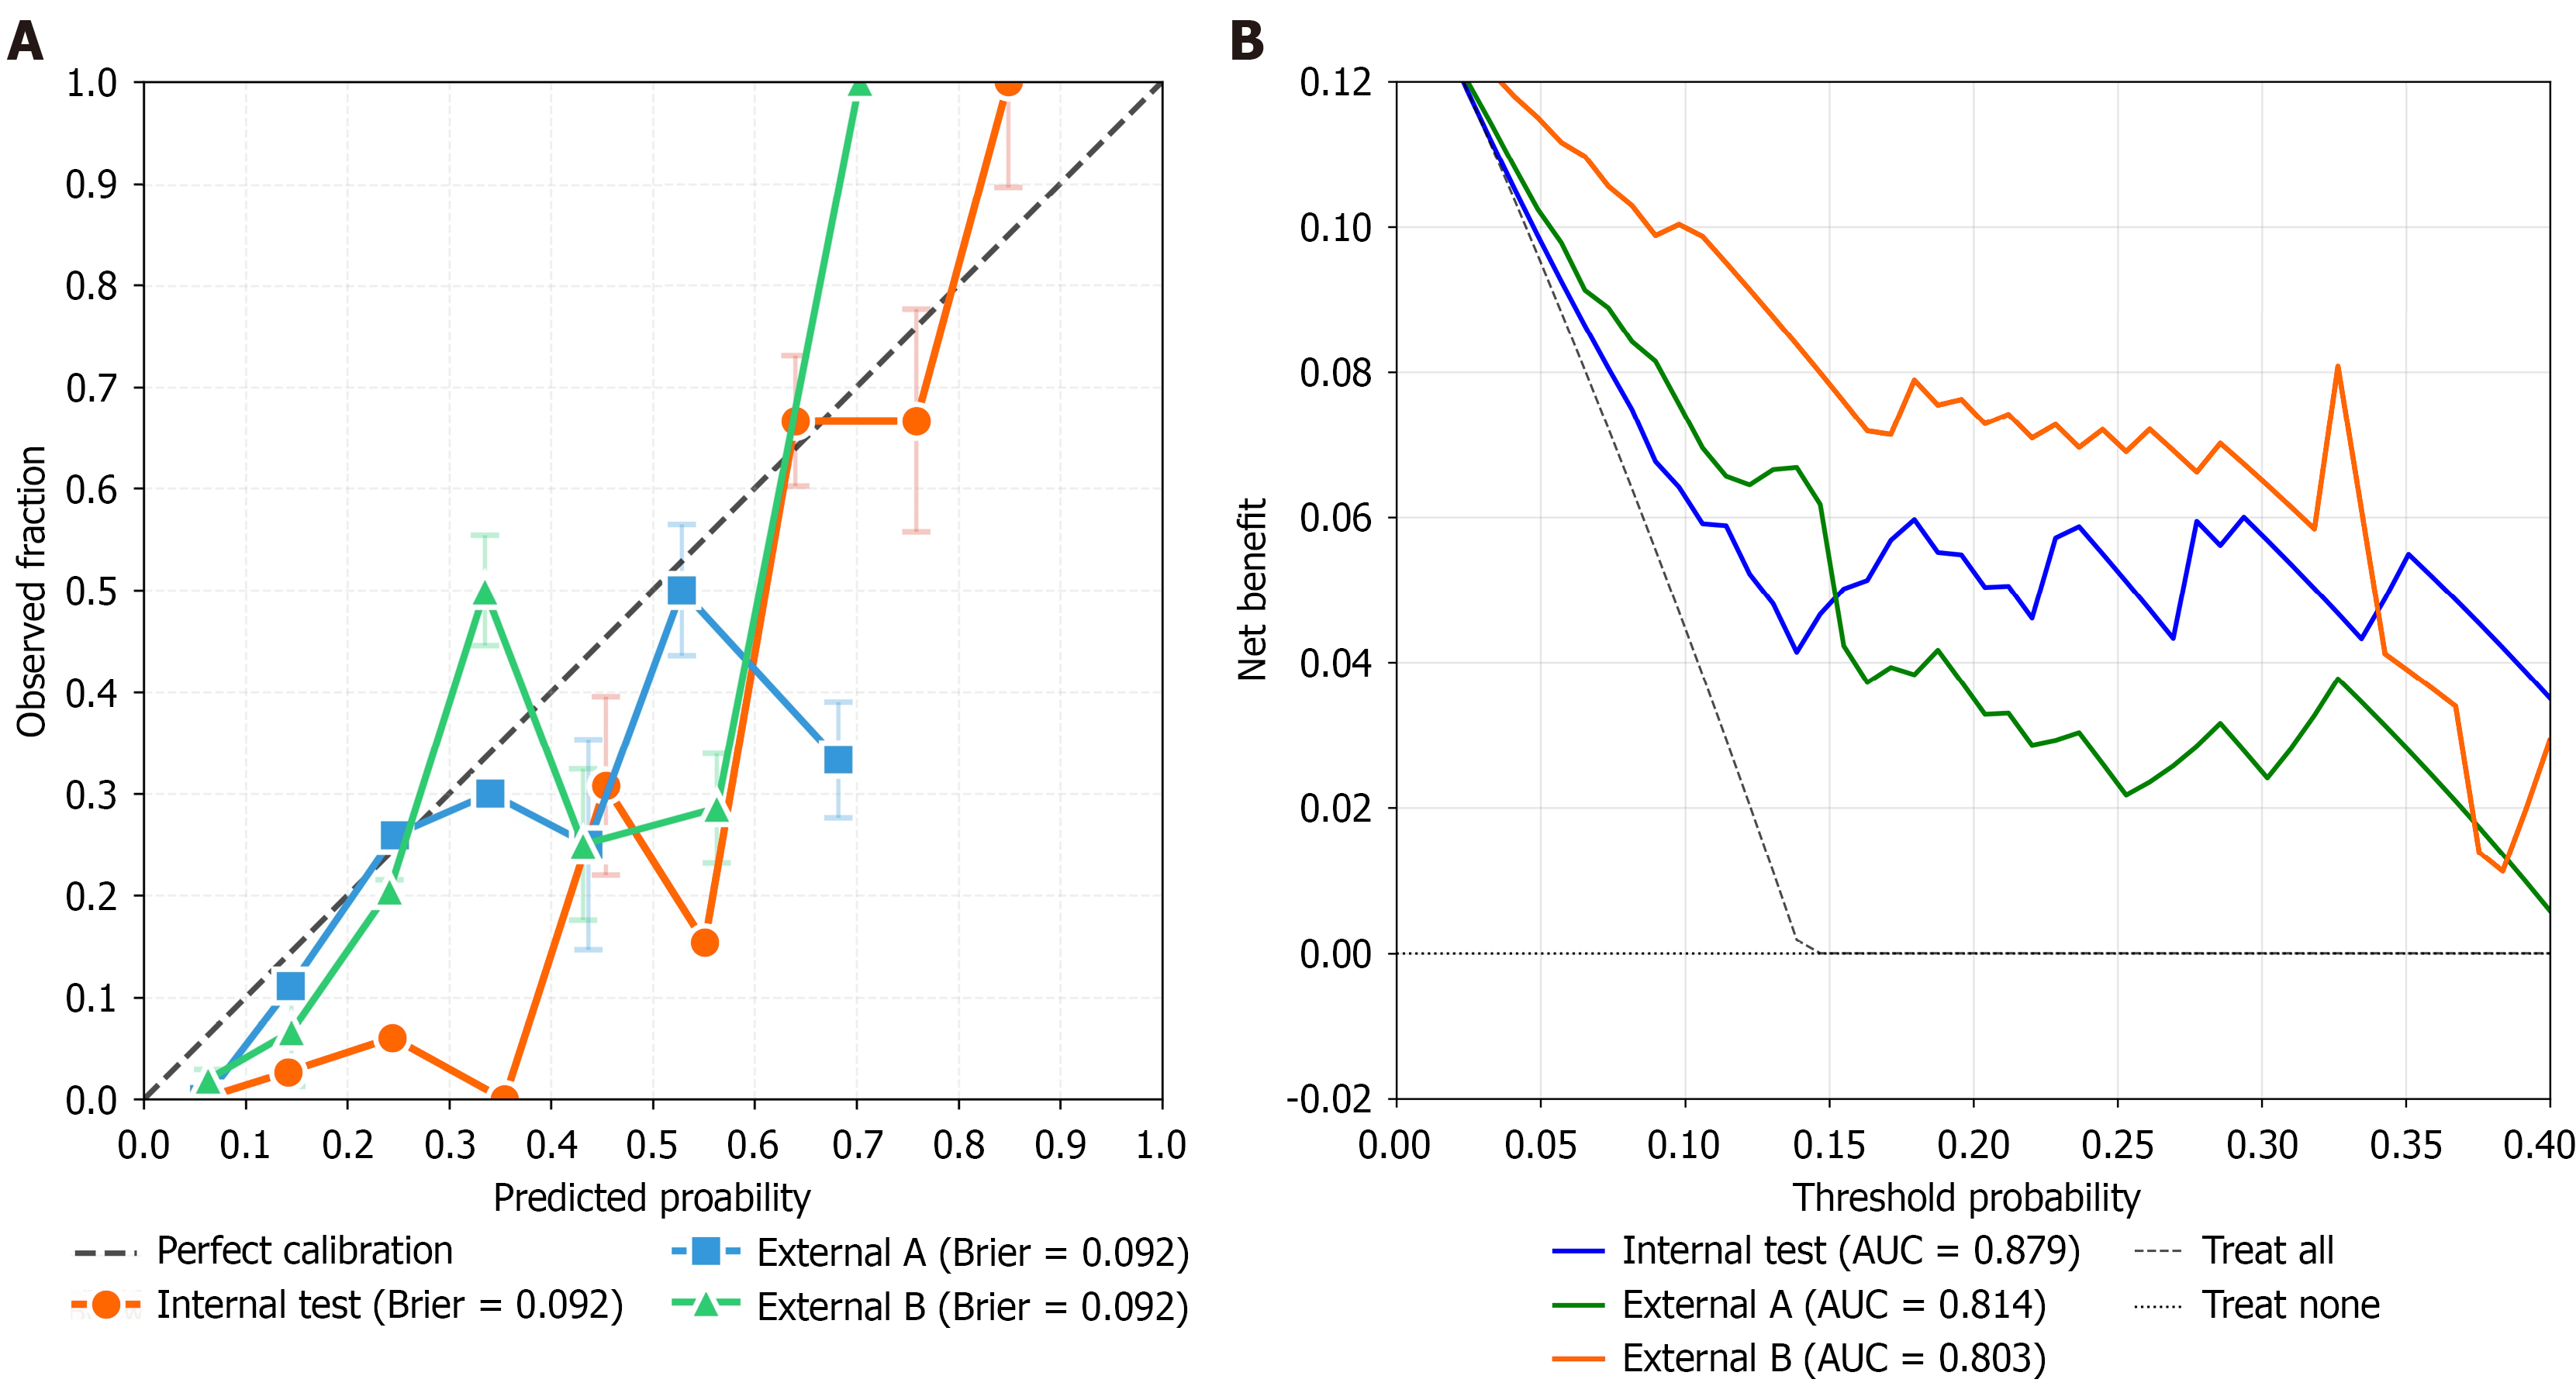
Figure 4 Calibration and clinical utility assessment of the white-light imaging-based artificial intelligence model for high-grade dysplasia risk prediction.
A: Calibration curves of the white-light imaging-based artificial intelligence model in the internal test cohort and two external validation cohorts. The calibration plots demonstrate the agreement between predicted probabilities and observed high-grade dysplasia risks. The diagonal dashed line represents perfect calibration. The corresponding Brier scores were 0.092, 0.081, and 0.082 for the internal test cohort, external validation cohort A, and external validation cohort B, respectively; B: Decision curve analysis of the white-light imaging-based artificial intelligence model across clinically relevant threshold probabilities. The net benefit curves demonstrate the potential clinical utility of the model compared with the strategies of treating all patients and treating none. AUC: Area under the curve.
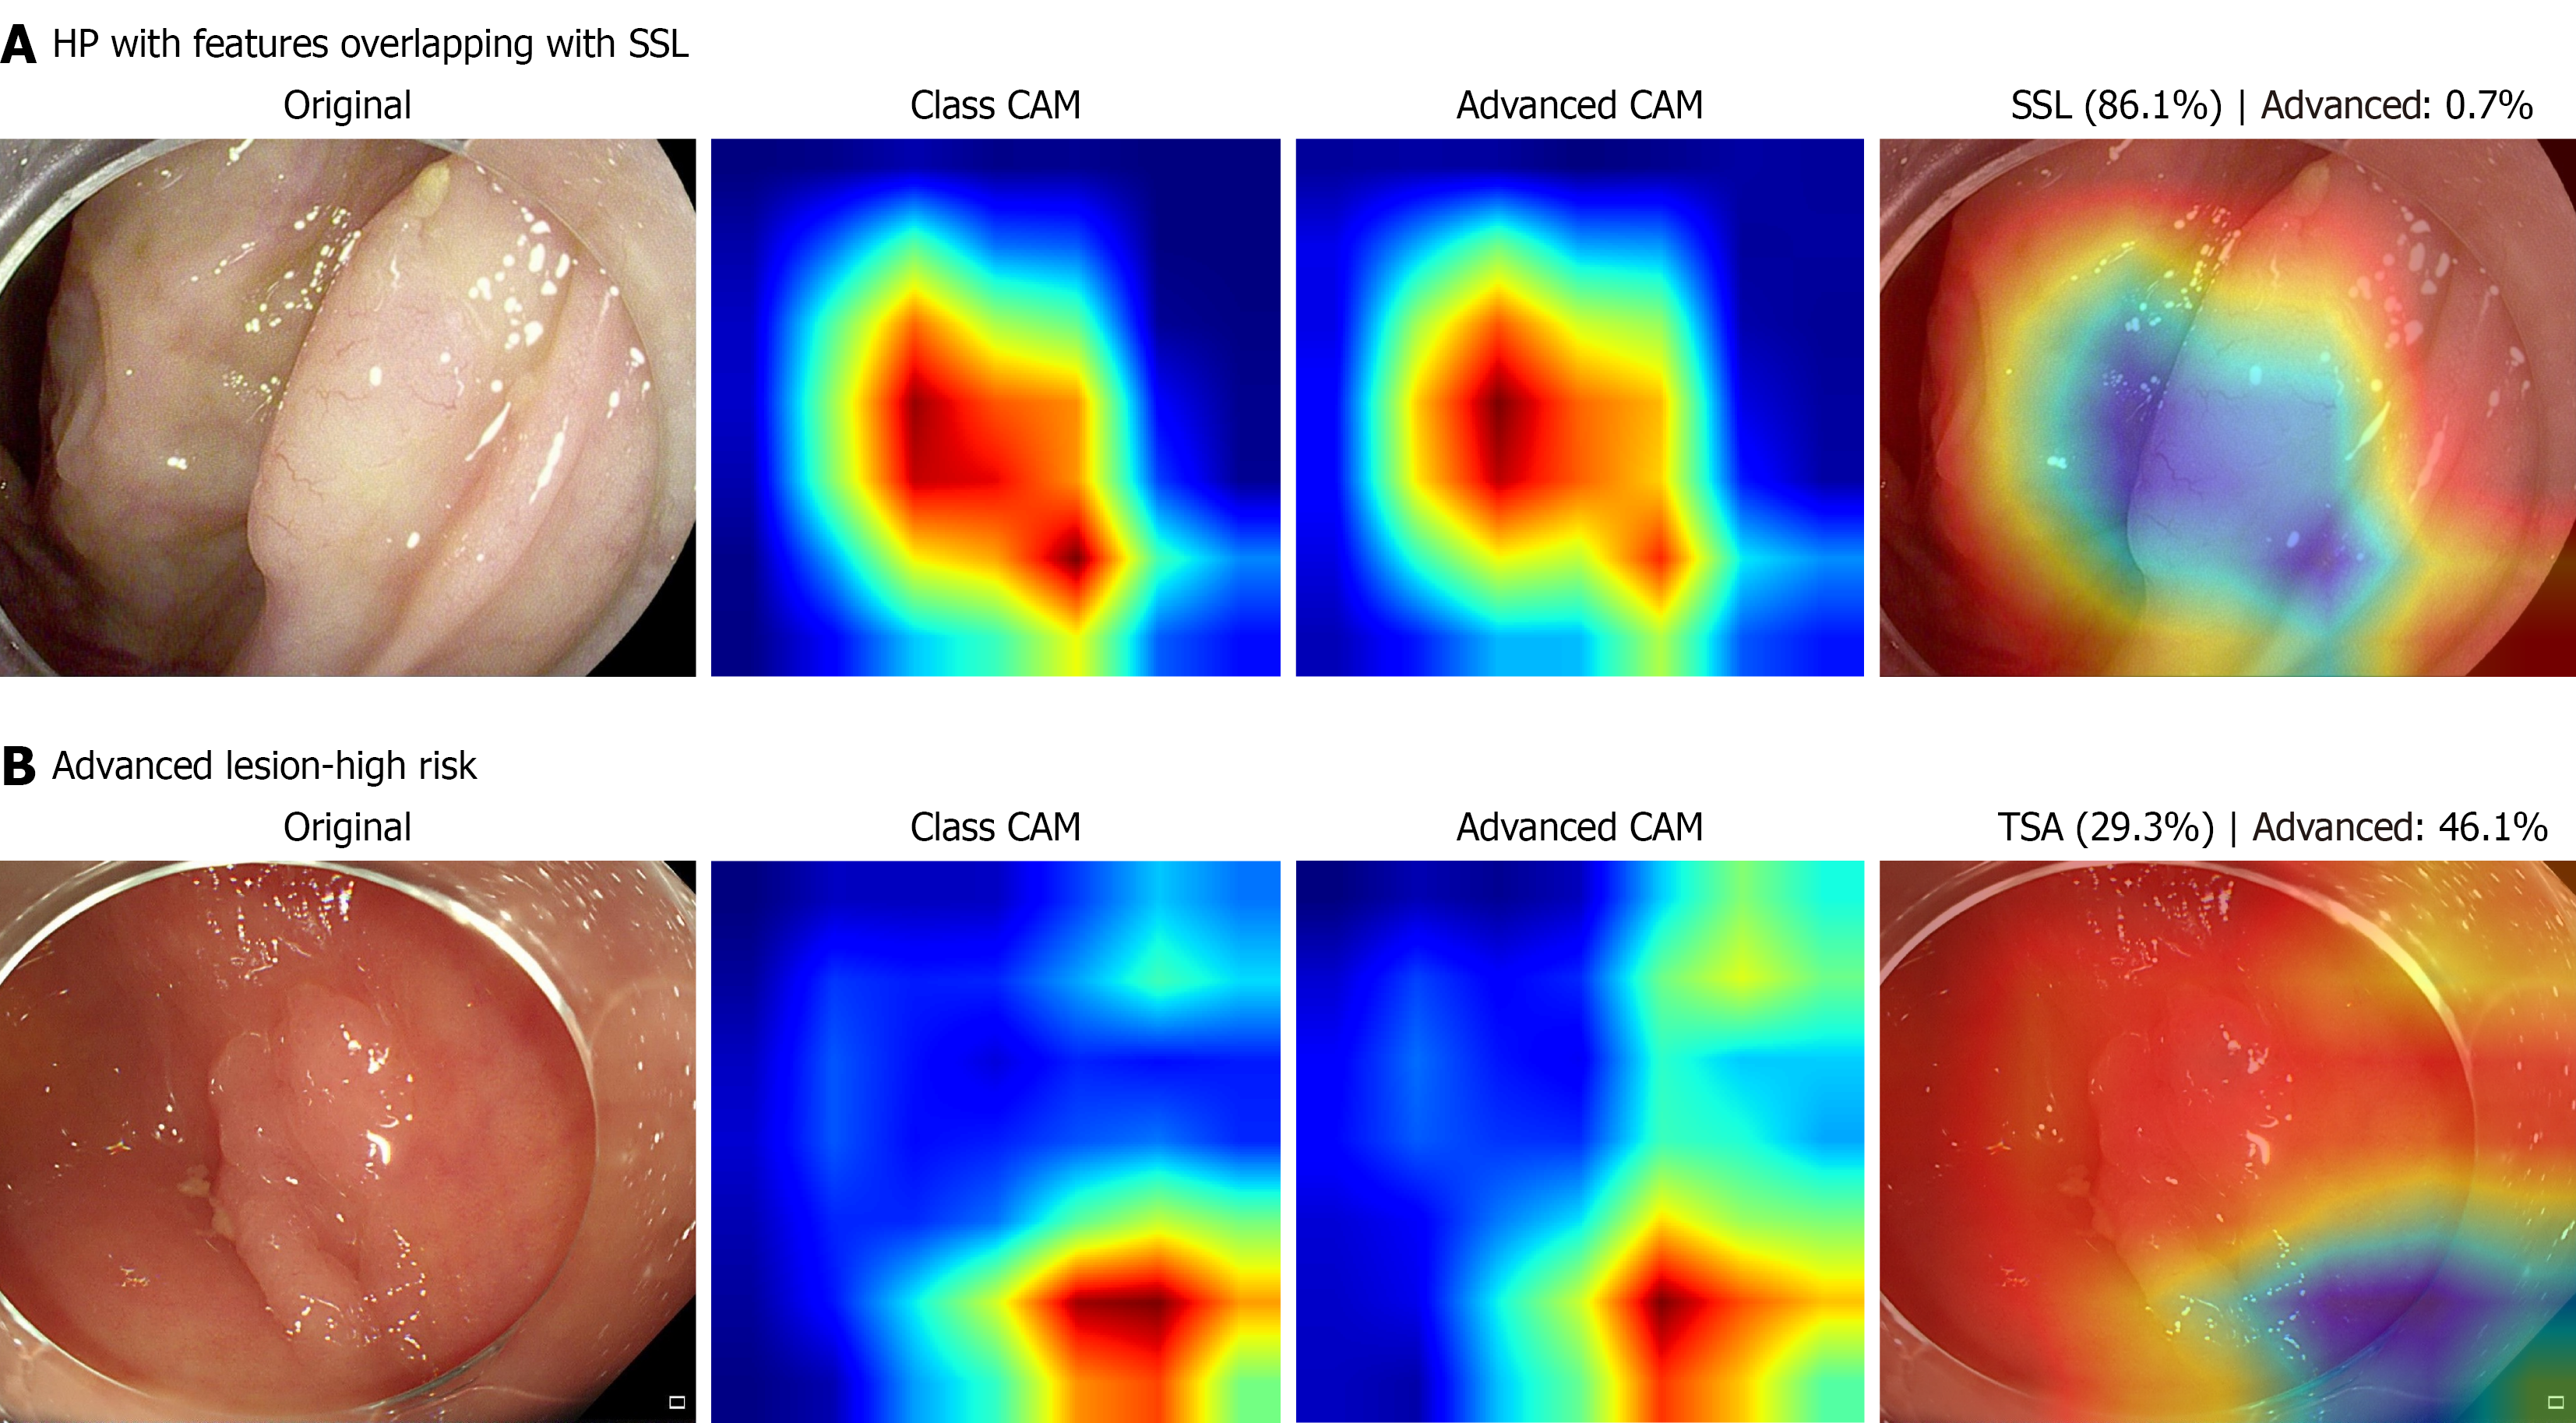
Figure 5 Gradient-weighted class activation mapping visualization of representative model predictions.
A: A hyperplastic polyp misclassified as a sessile serrated lesion, showing relatively increased gradient-weighted class activation mapping (Grad-CAM) activation over localized surface irregularities; B: A lesion with high-grade dysplasia correctly classified as high risk, showing focal Grad-CAM activation over the lesion region. For each case, the original white-light image, class activation map, high-grade dysplasia-risk activation map, and overlay image are shown from left to right. Warmer colors indicate areas with higher Grad-CAM activation. These visualizations are intended to provide qualitative insight into model behavior and should not be interpreted as definitive evidence of pathological relevance. HP: Hyperplastic polyp; SSL: Sessile serrated lesion; CAM: Class activation mapping; TSA: Traditional serrated adenoma.
- Citation: Zhang Y, Yan S, Li YJ, Li QX, Wei LJ. Deep learning for predicting high-grade dysplasia in colorectal polyps using white-light endoscopy. World J Gastroenterol 2027; 33(3): 125206
- URL: https://www.wjgnet.com/1007-9327/full/v33/i3/125206.htm
- DOI: https://dx.doi.org/10.3748/wjg.125206