
















Copyright: ©Author(s) 2026.
World J Gastroenterol. Jan 21, 2027; 33(3): 125206
Published online Jan 21, 2027. doi: 10.3748/wjg.125206
Published online Jan 21, 2027. doi: 10.3748/wjg.125206
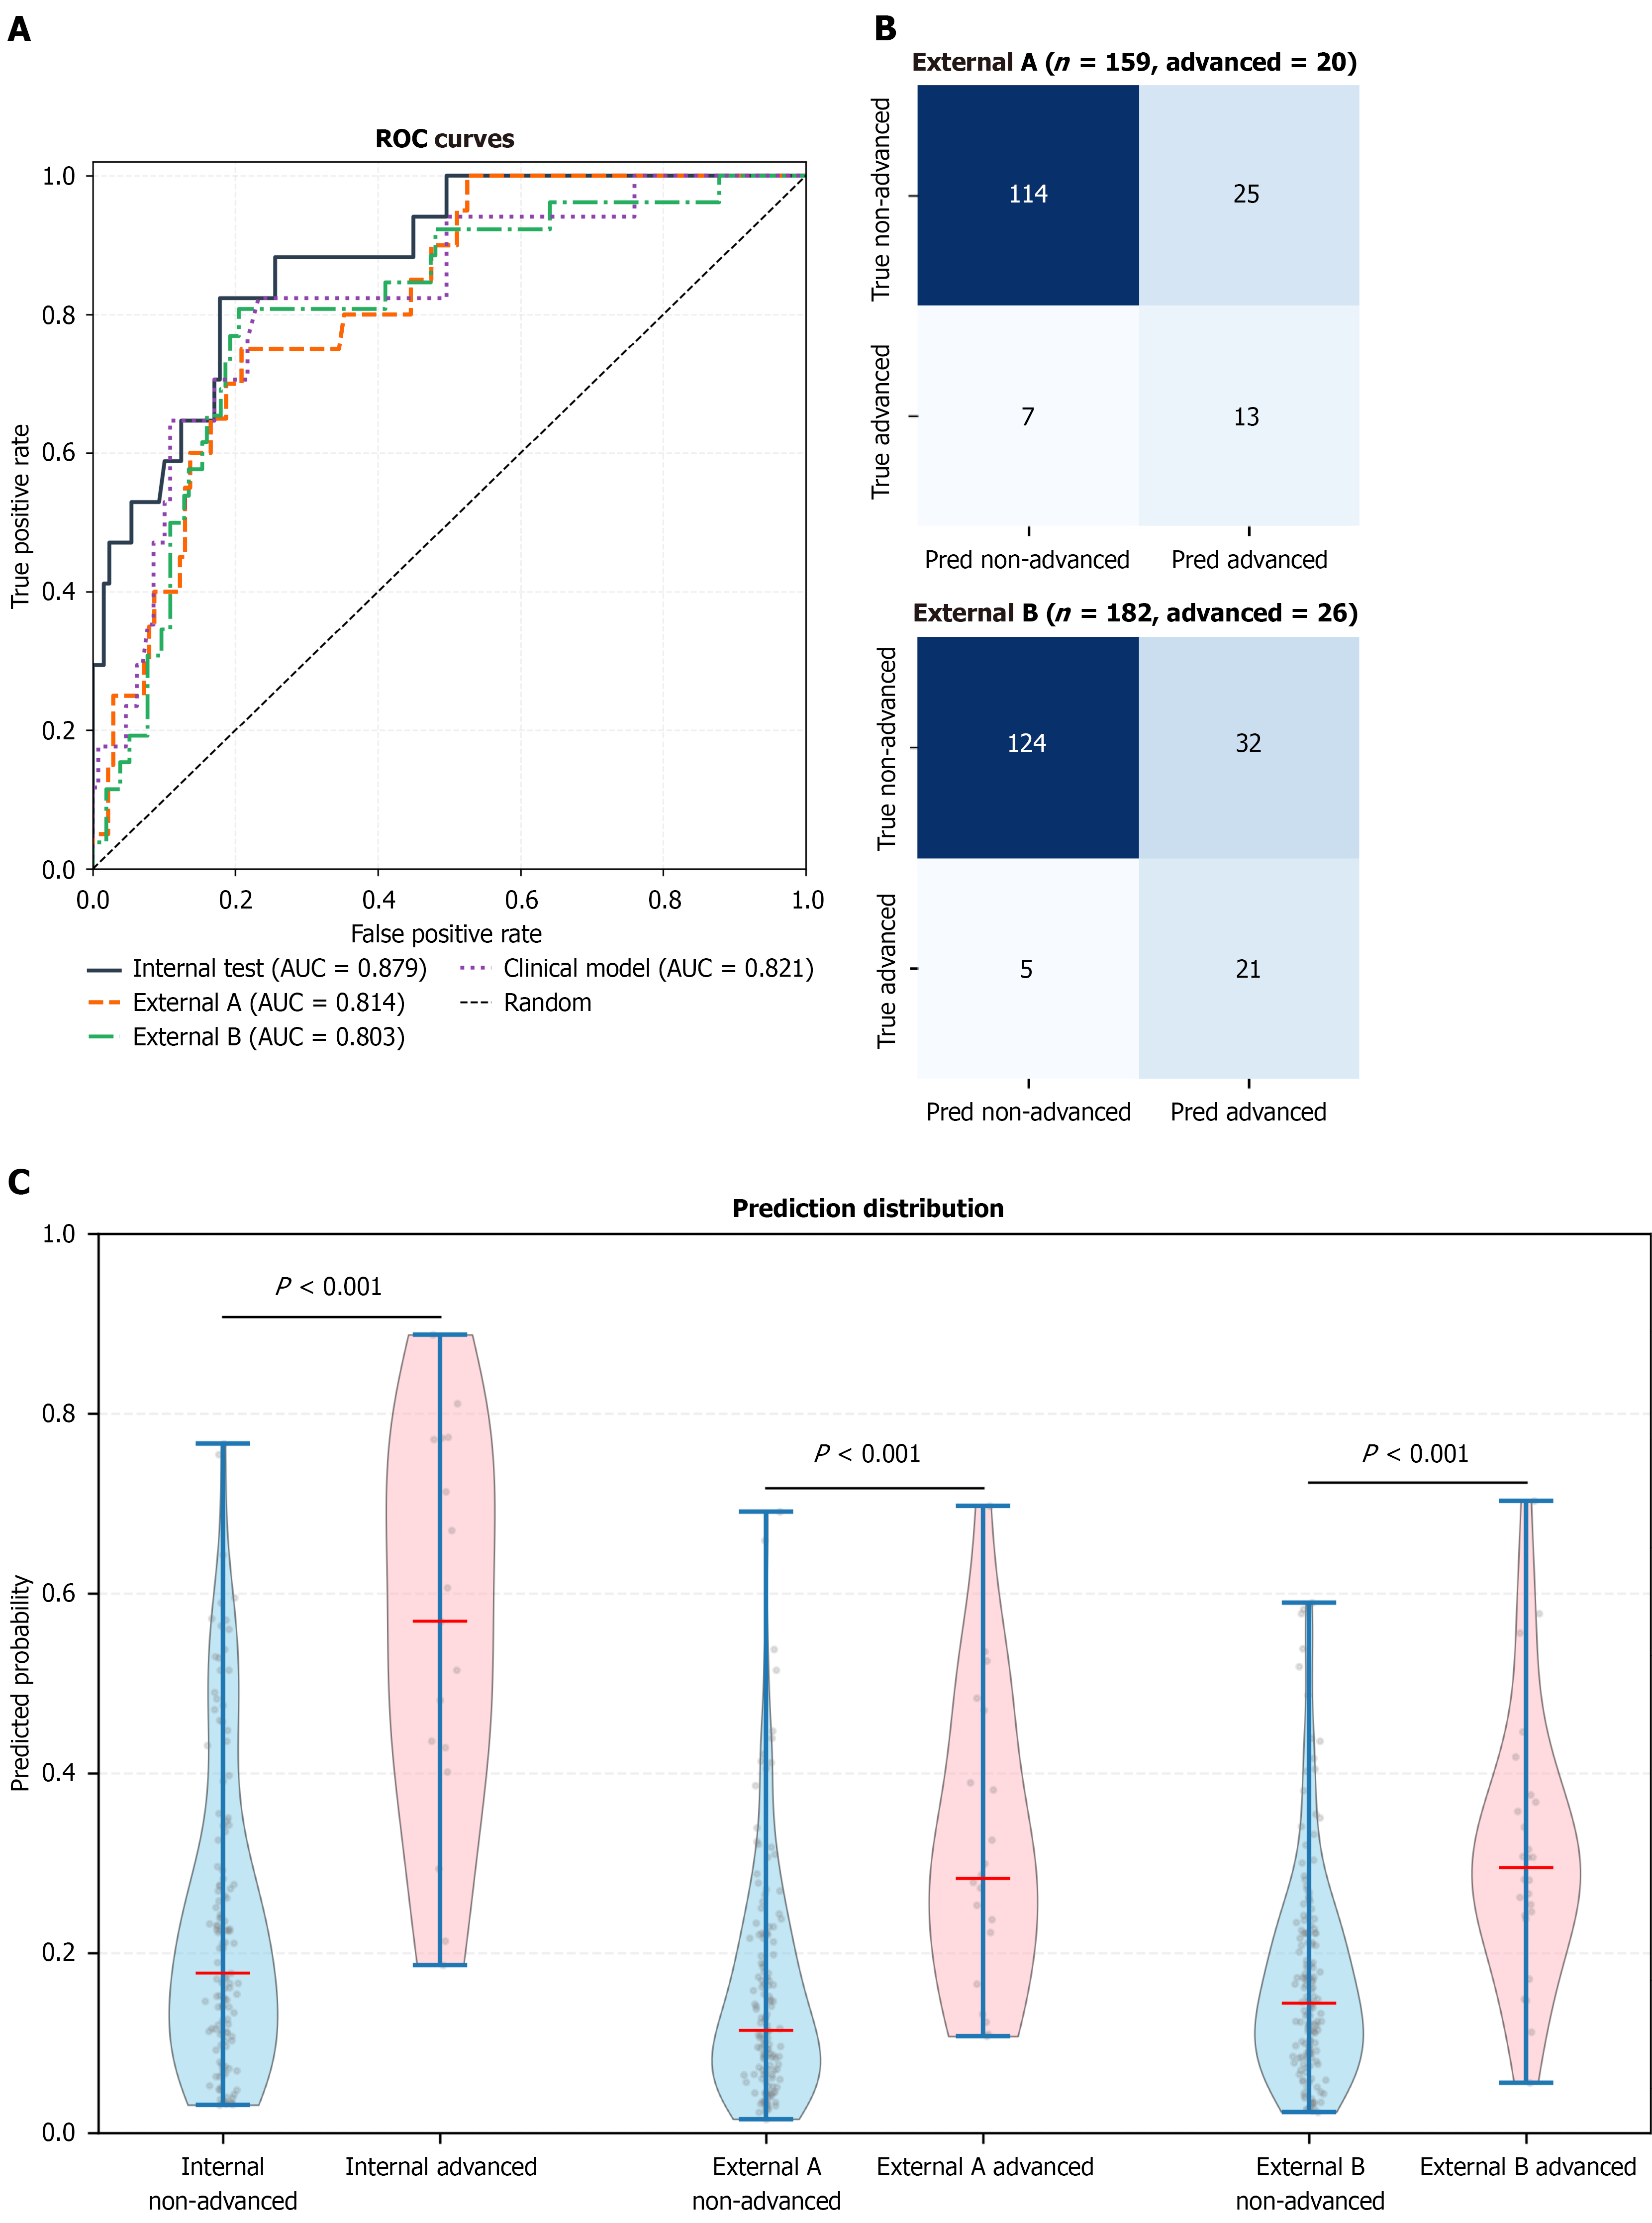
Figure 3 Model performance in the internal test and external validation cohorts.
A: Receiver operating characteristic curves showing discrimination of the white-light imaging-based model in the internal test cohort (area under the curve 0.879), external validation cohort A (area under the curve 0.814), and external validation cohort B (area under the curve 0.803). The diagonal dashed line represents the performance of a random classifier; B: Confusion matrices for external validation cohort A and external validation cohort B at the prespecified threshold of 0.2381; C: Predicted probability distributions showing separation between advanced and non-advanced lesions in the internal test cohort and both external validation cohorts (all P < 0.001, Mann-Whitney U test). Boxes represent interquartile ranges; whiskers represent 1.5 × interquartile range; horizontal lines indicate medians. ROC: Receiver operating characteristic; AUC: Area under the curve.
- Citation: Zhang Y, Yan S, Li YJ, Li QX, Wei LJ. Deep learning for predicting high-grade dysplasia in colorectal polyps using white-light endoscopy. World J Gastroenterol 2027; 33(3): 125206
- URL: https://www.wjgnet.com/1007-9327/full/v33/i3/125206.htm
- DOI: https://dx.doi.org/10.3748/wjg.125206