
















Copyright: ©Author(s) 2026.
World J Gastroenterol. Nov 28, 2026; 32(44): 122956
Published online Nov 28, 2026. doi: 10.3748/wjg.122956
Published online Nov 28, 2026. doi: 10.3748/wjg.122956
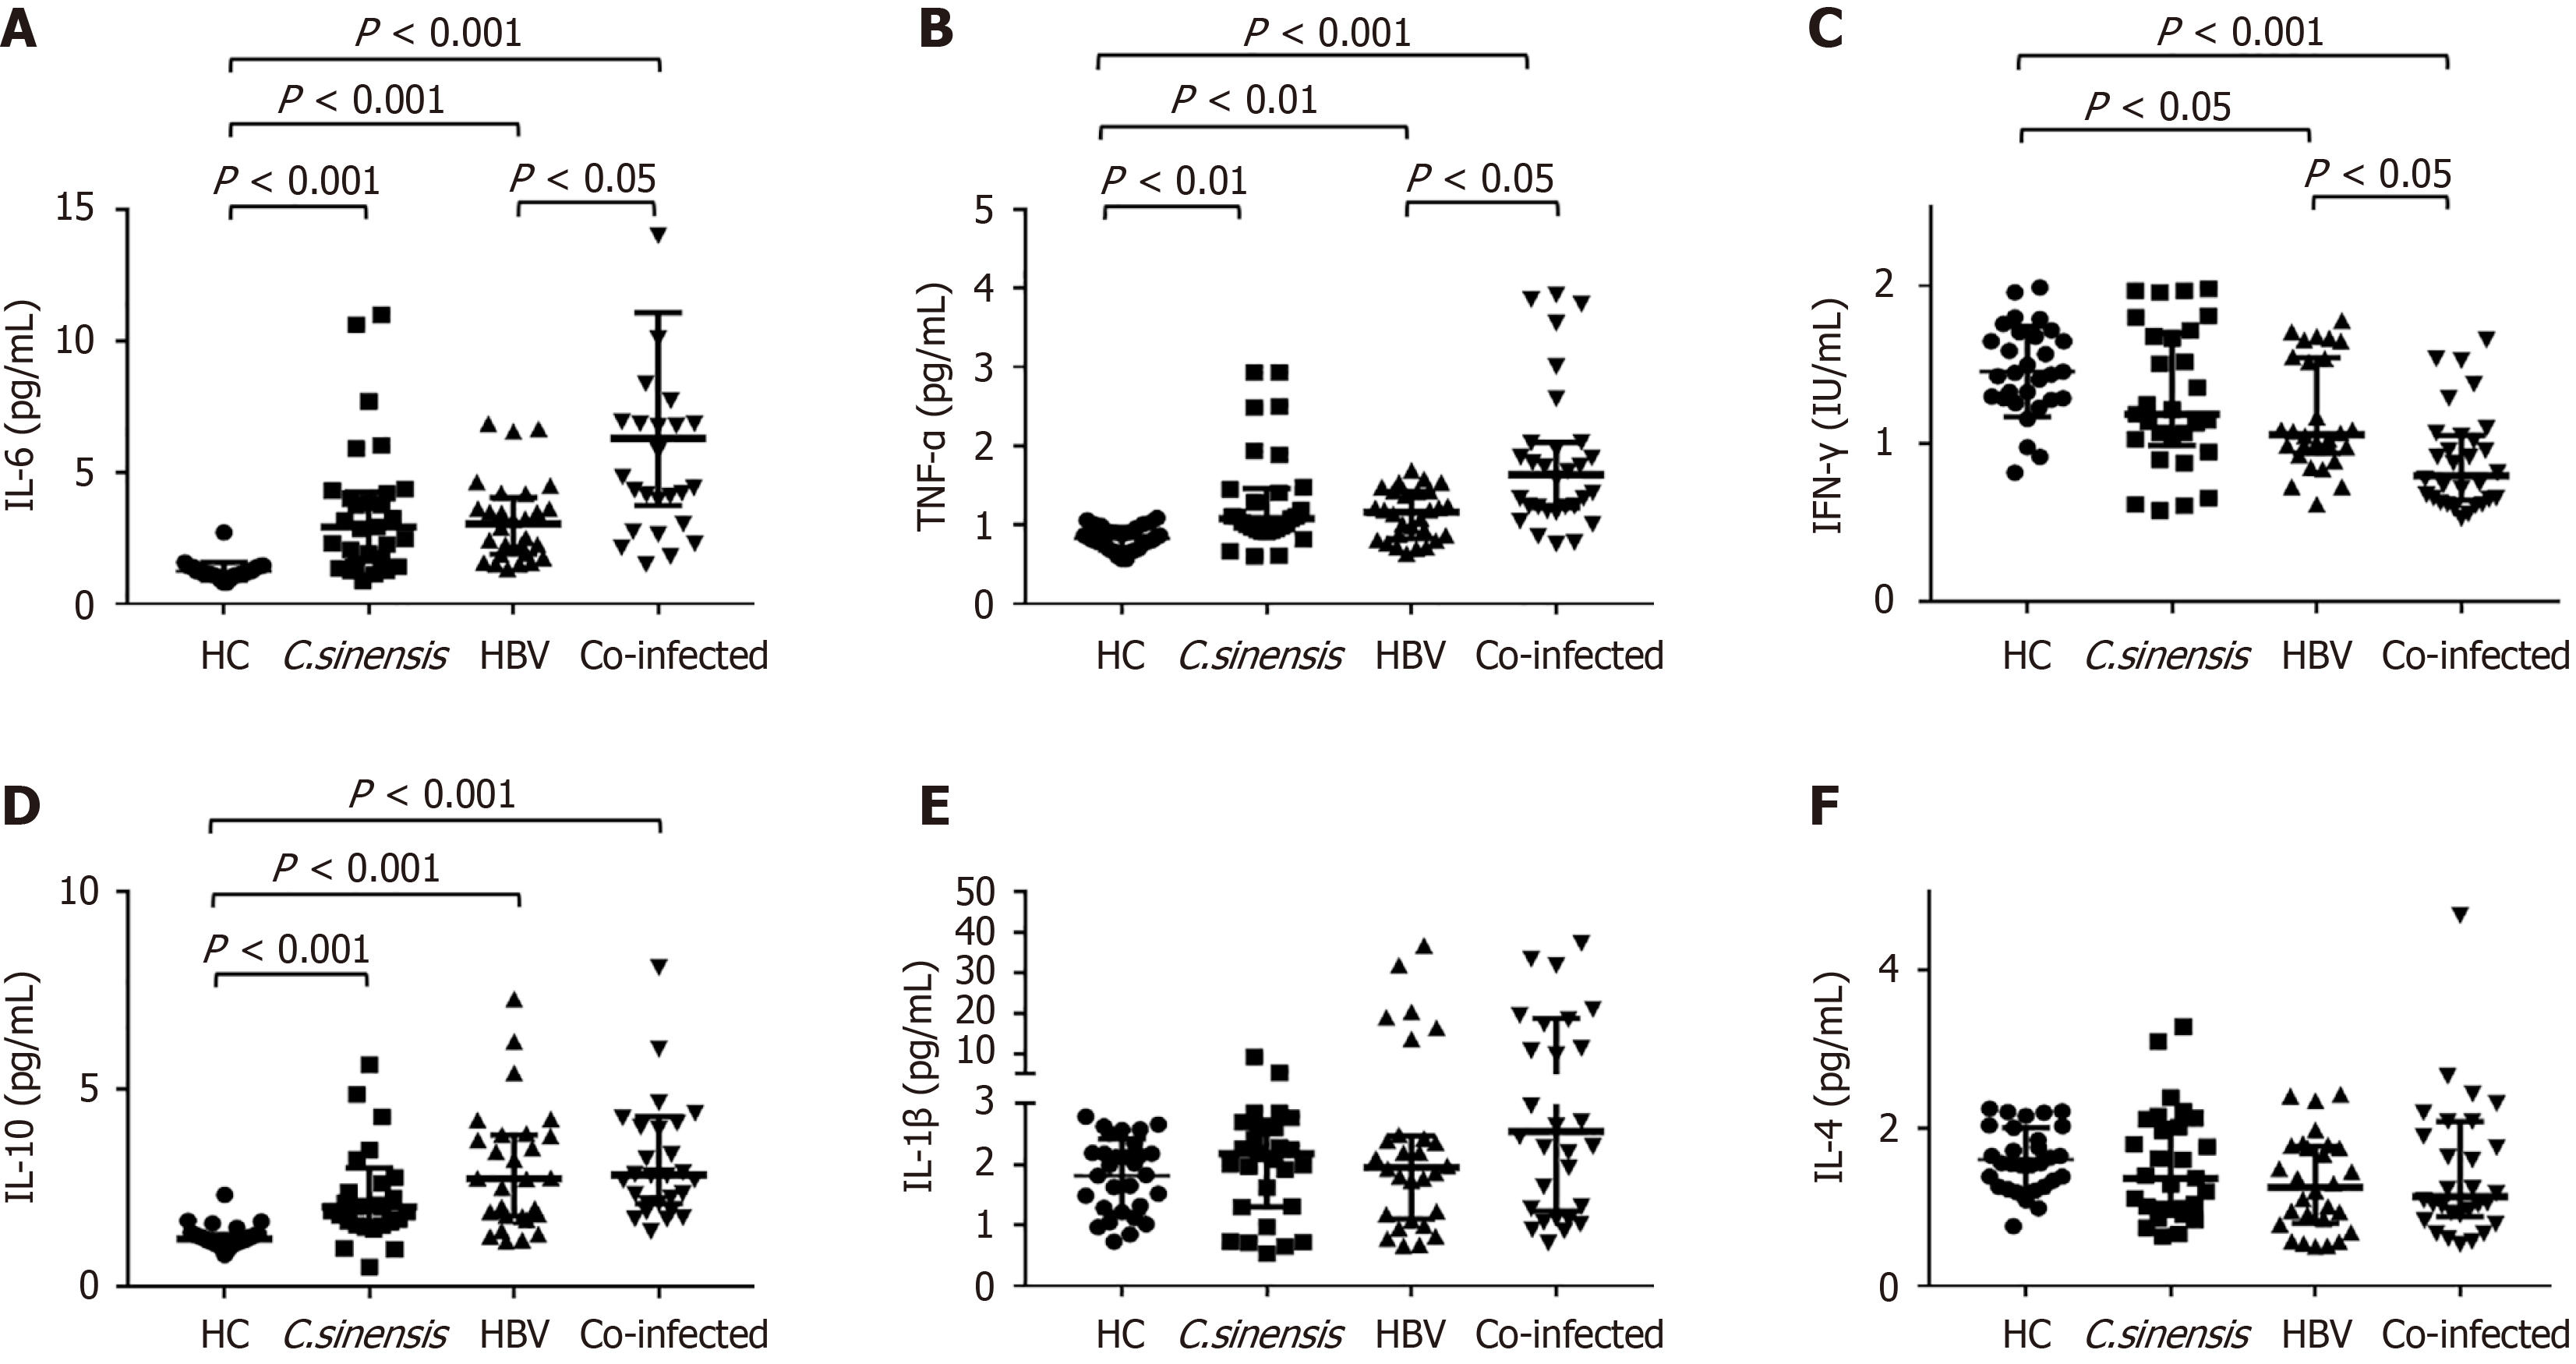
Figure 1 Serum cytokine levels in the four groups.
Scatter plots show serum concentrations. A: Interleukin-6; B Tumor necrosis factor-α; C: Interferon-γ; D: Interleukin-10; E: Interleukin-1β; F: Interleukin-4. HC: Healthy controls; C. sinensis: Clonorchis sinensis mono-infected participants; HBV: Hepatitis B virus mono-infected participants; Co-infected: Co-infected participants; IL: Interleukin; TNF-α: Tumor necrosis factor-α; IFN-γ: Interferon-γ.
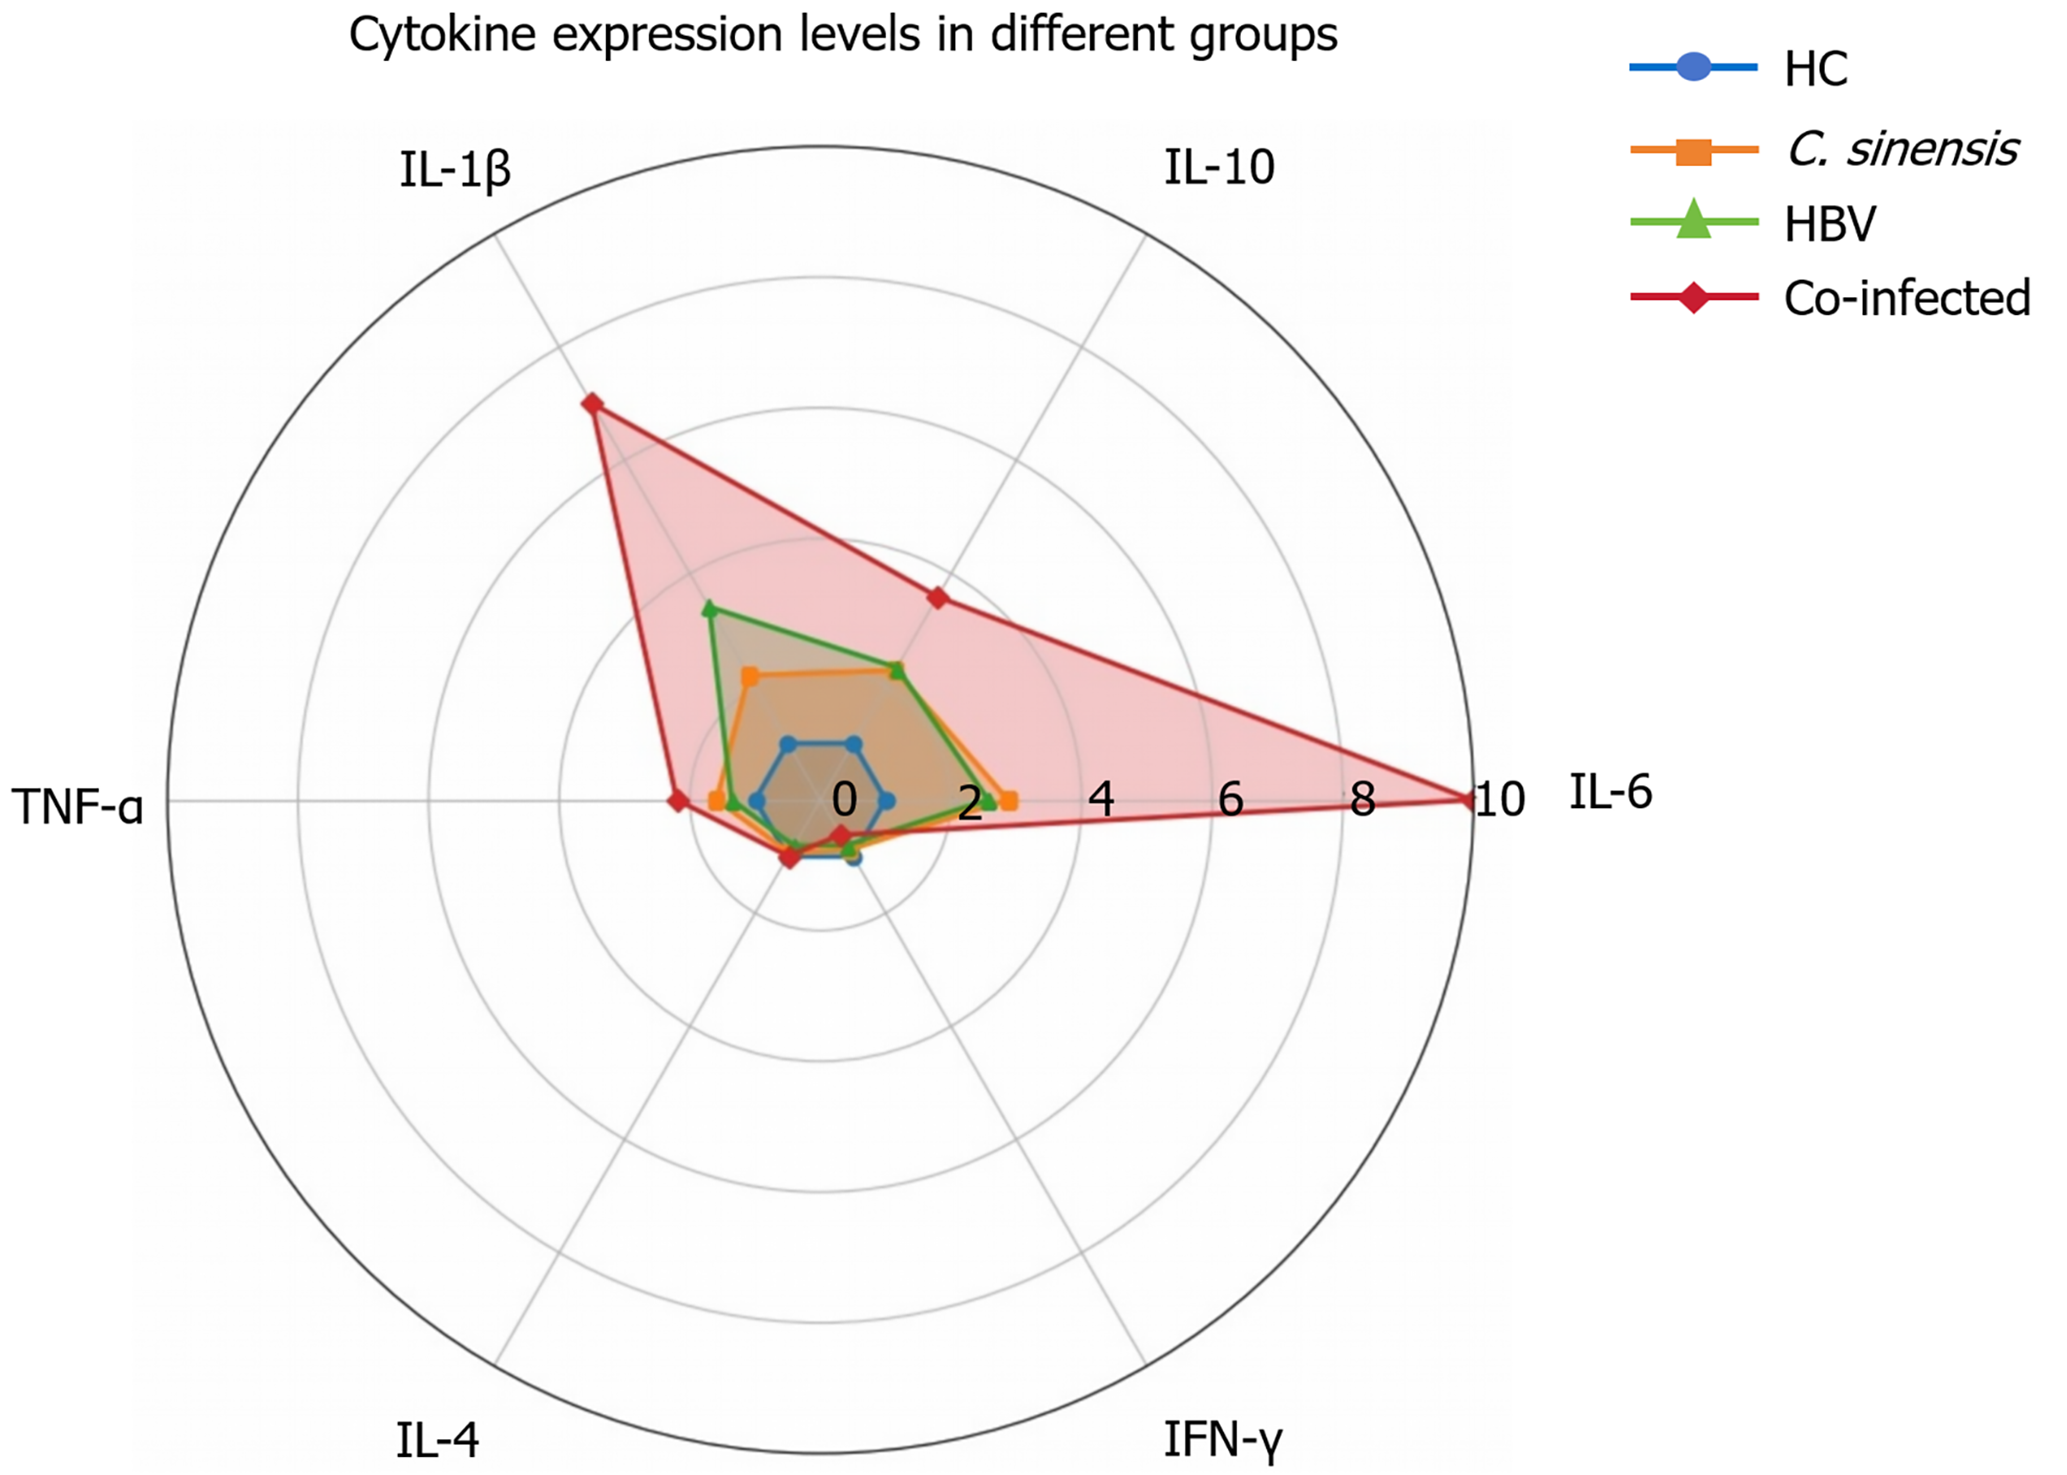
Figure 2 Radar chart of cytokine levels among the four groups.
Relative levels of interleukin-6, tumor necrosis factor-α, interferon-γ, interleukin-10, interleukin-1β, and interleukin-4 are shown after normalization to the healthy controls group (set to 1). Each axis represents one cytokine; the area covered by each group reflects its overall cytokine profile. HC: Healthy controls; C. sinensis: Clonorchis sinensis mono-infected participants; HBV: Hepatitis B virus mono-infected participants; Co-infected: Co-infected participants; IL: Interleukin; TNF-α: Tumor necrosis factor-α; IFN-γ: Interferon-γ.
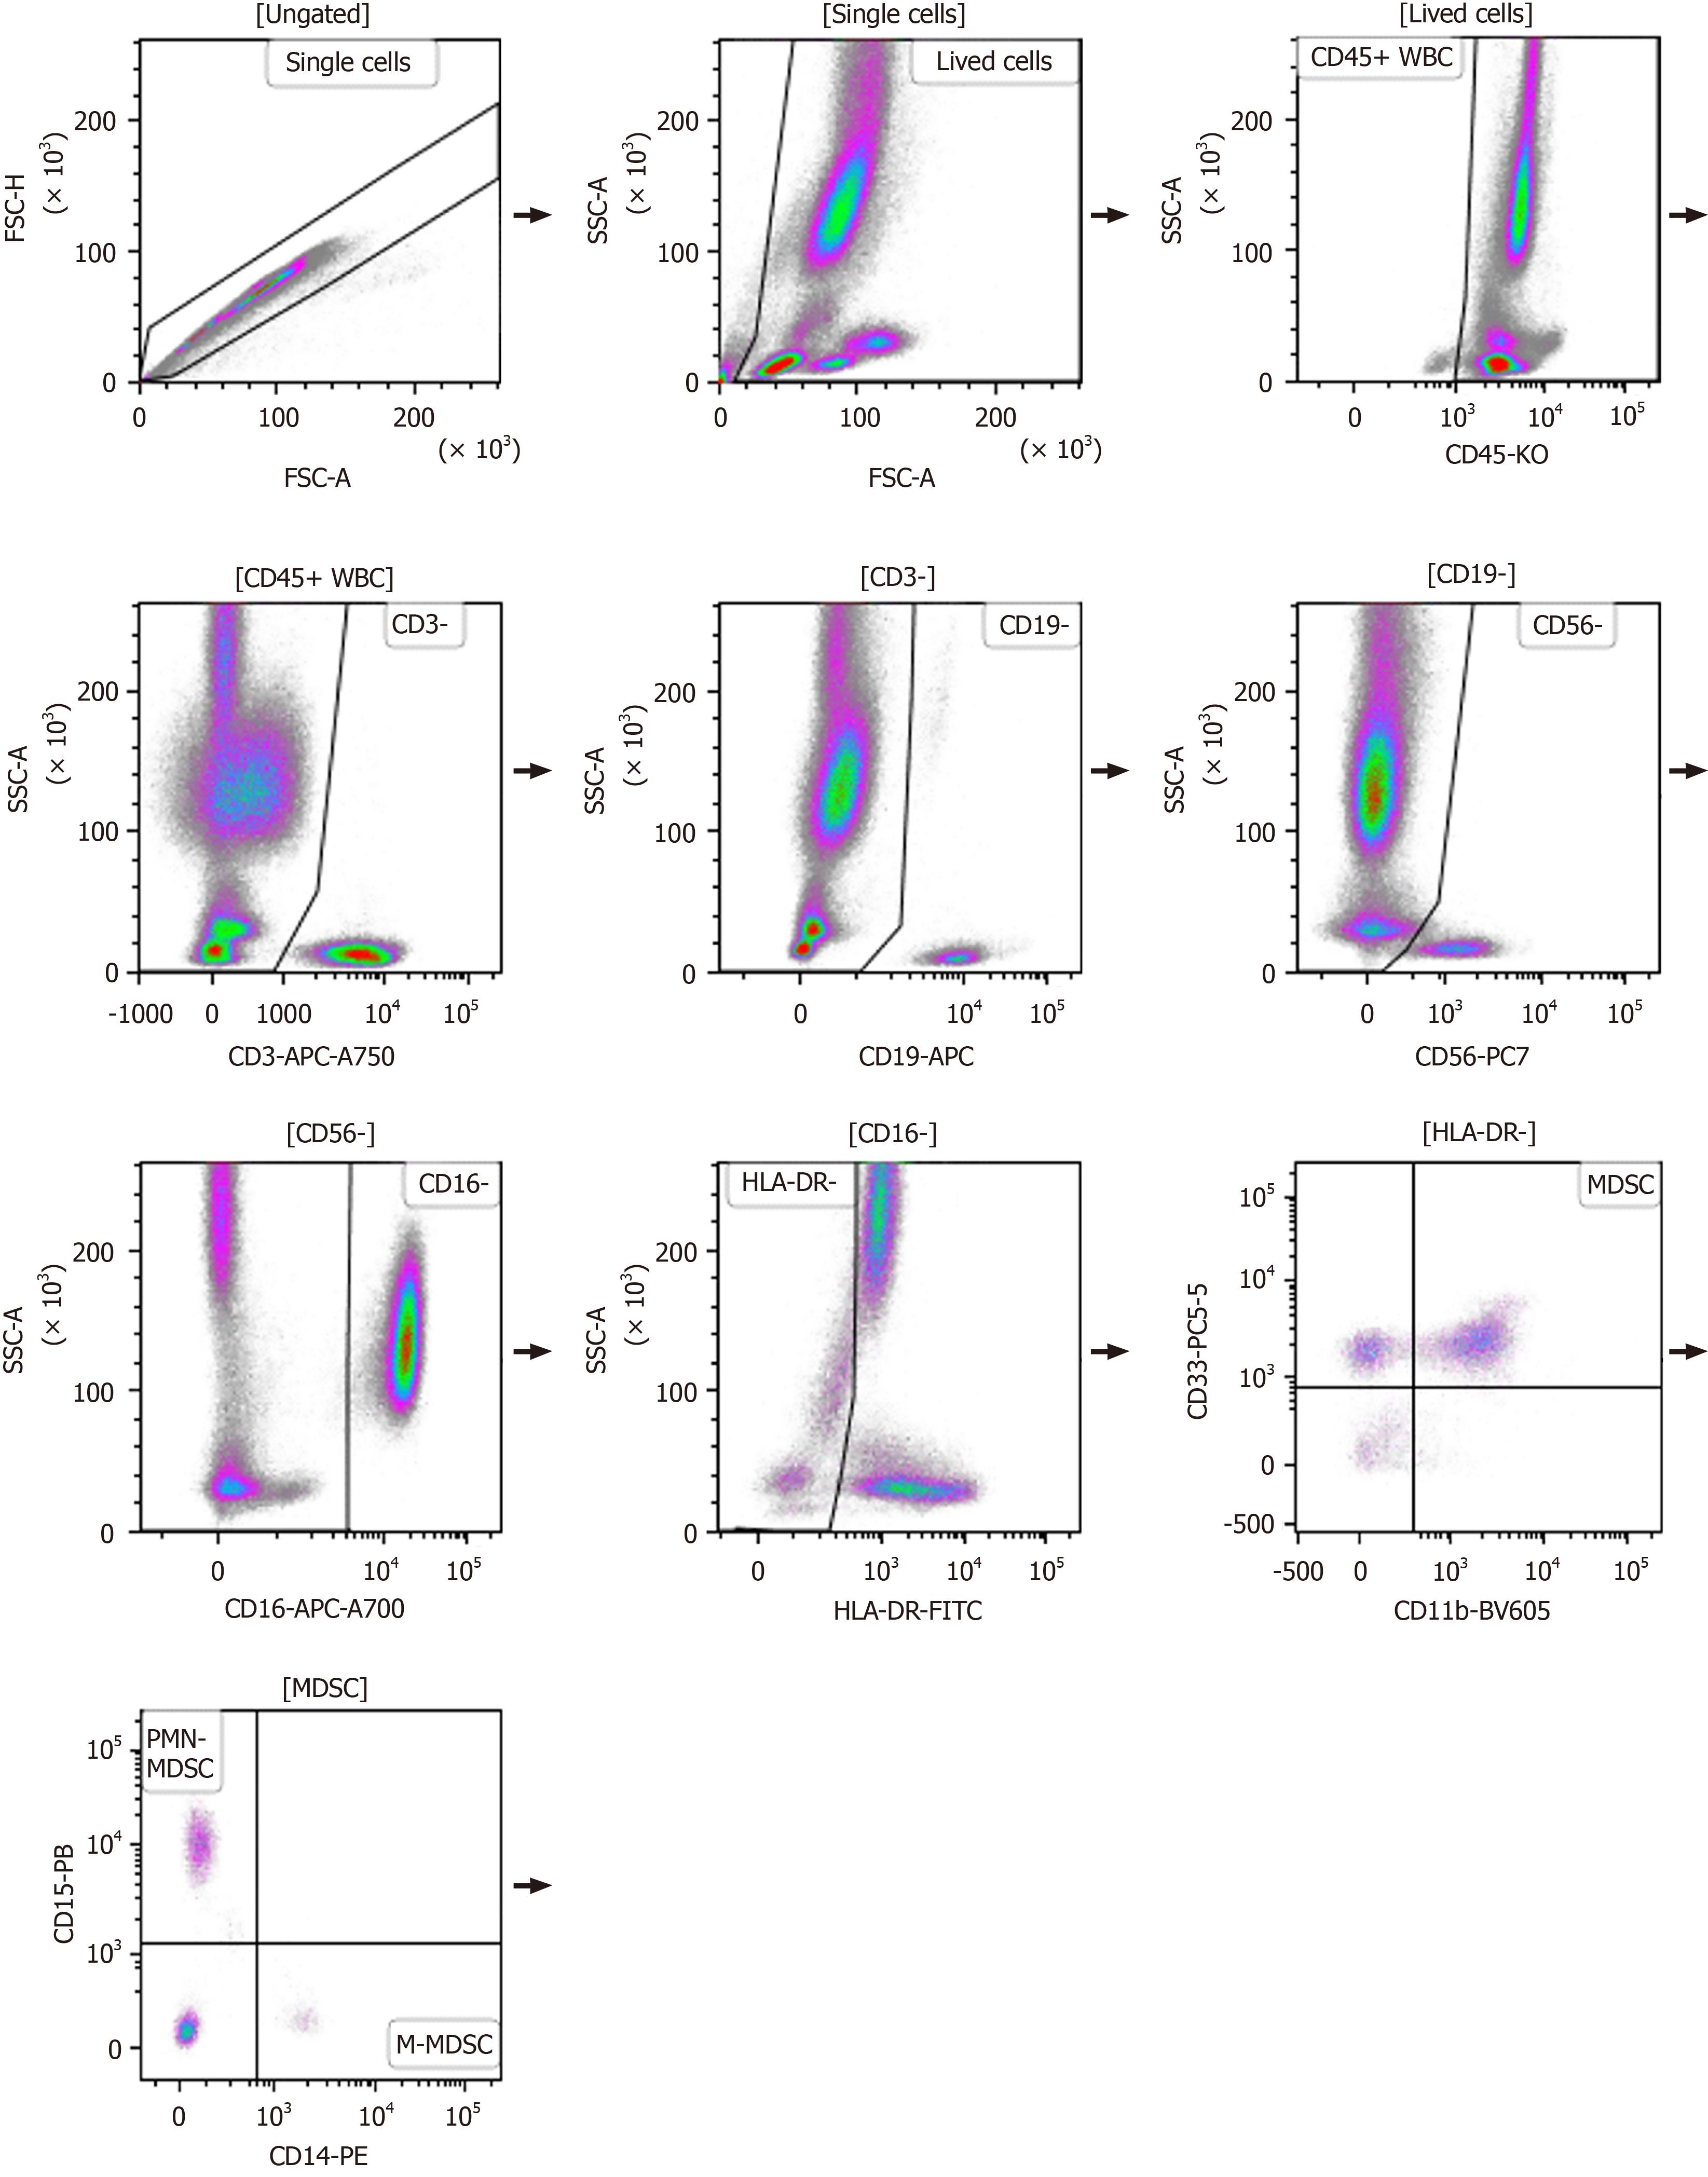
Figure 3 Gating strategy for myeloid-derived suppressor cell and lymphocyte subsets.
Total myeloid-derived suppressor cells (MDSCs) were defined as CD45+CD3-CD19-CD56-CD16-HLA-DR-CD33+CD11b+ cells. Within this gate, CD14+ cells are monocytic MDSCs and CD15+ cells are polymorphonuclear MDSCs. Lymphocyte subsets: CD3+ (T cells), CD3-CD19+ (B cells), CD3-CD56+ (natural killer cells), and CD3+CD56+ (natural killer T cells). MDSC: Myeloid-derived suppressor cells; FSC-H: Forward scatter-height; SSC-A: Side scatter-area; WBC: White blood cell; APC: Allophycocyanin; HLA: Human leukocyte antigen; FITC: Fluorescein isothiocyanate; PMN-MDSC: Polymorphonuclear myeloid-derived suppressor cells; M-MDSC: Monocytic myeloid-derived suppressor cells; PE: Phycoerythrin.
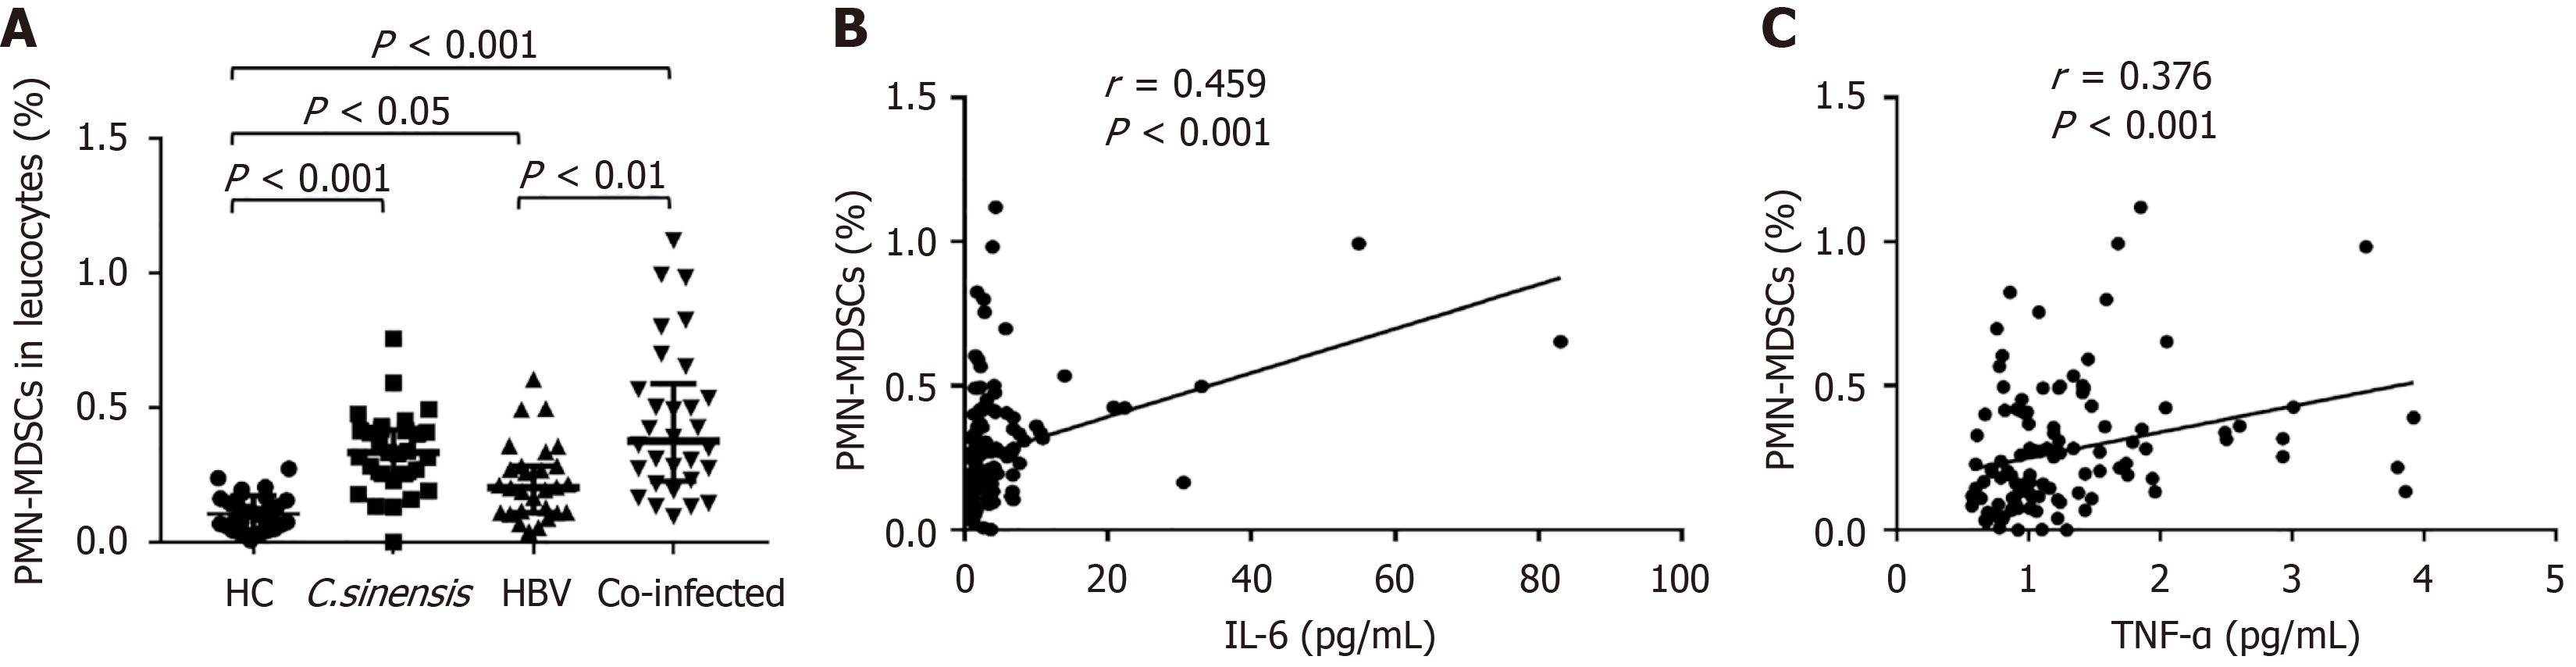
Figure 4 Polymorphonuclear myeloid-derived suppressor cells expansion and its correlations with pro-inflammatory cytokines in the four groups.
A: Frequency of circulating polymorphonuclear myeloid-derived suppressor cells (PMN-MDSCs); B: Correlation between PMN-MDSC frequency and serum interleukin-6 concentration; C: Correlation between PMN-MDSC frequency and serum tumor necrosis factor-α concentration. Spearman’s correlation coefficient (r) and P values are indicated. PMN-MDSC: Polymorphonuclear myeloid-derived suppressor cells; HC: Healthy controls; C. sinensis: Clonorchis sinensis mono-infected participants; HBV: Hepatitis B virus mono-infected participants; Co-infected: Co-infected participants; IL: Interleukin; TNF-α: Tumor necrosis factor-α.
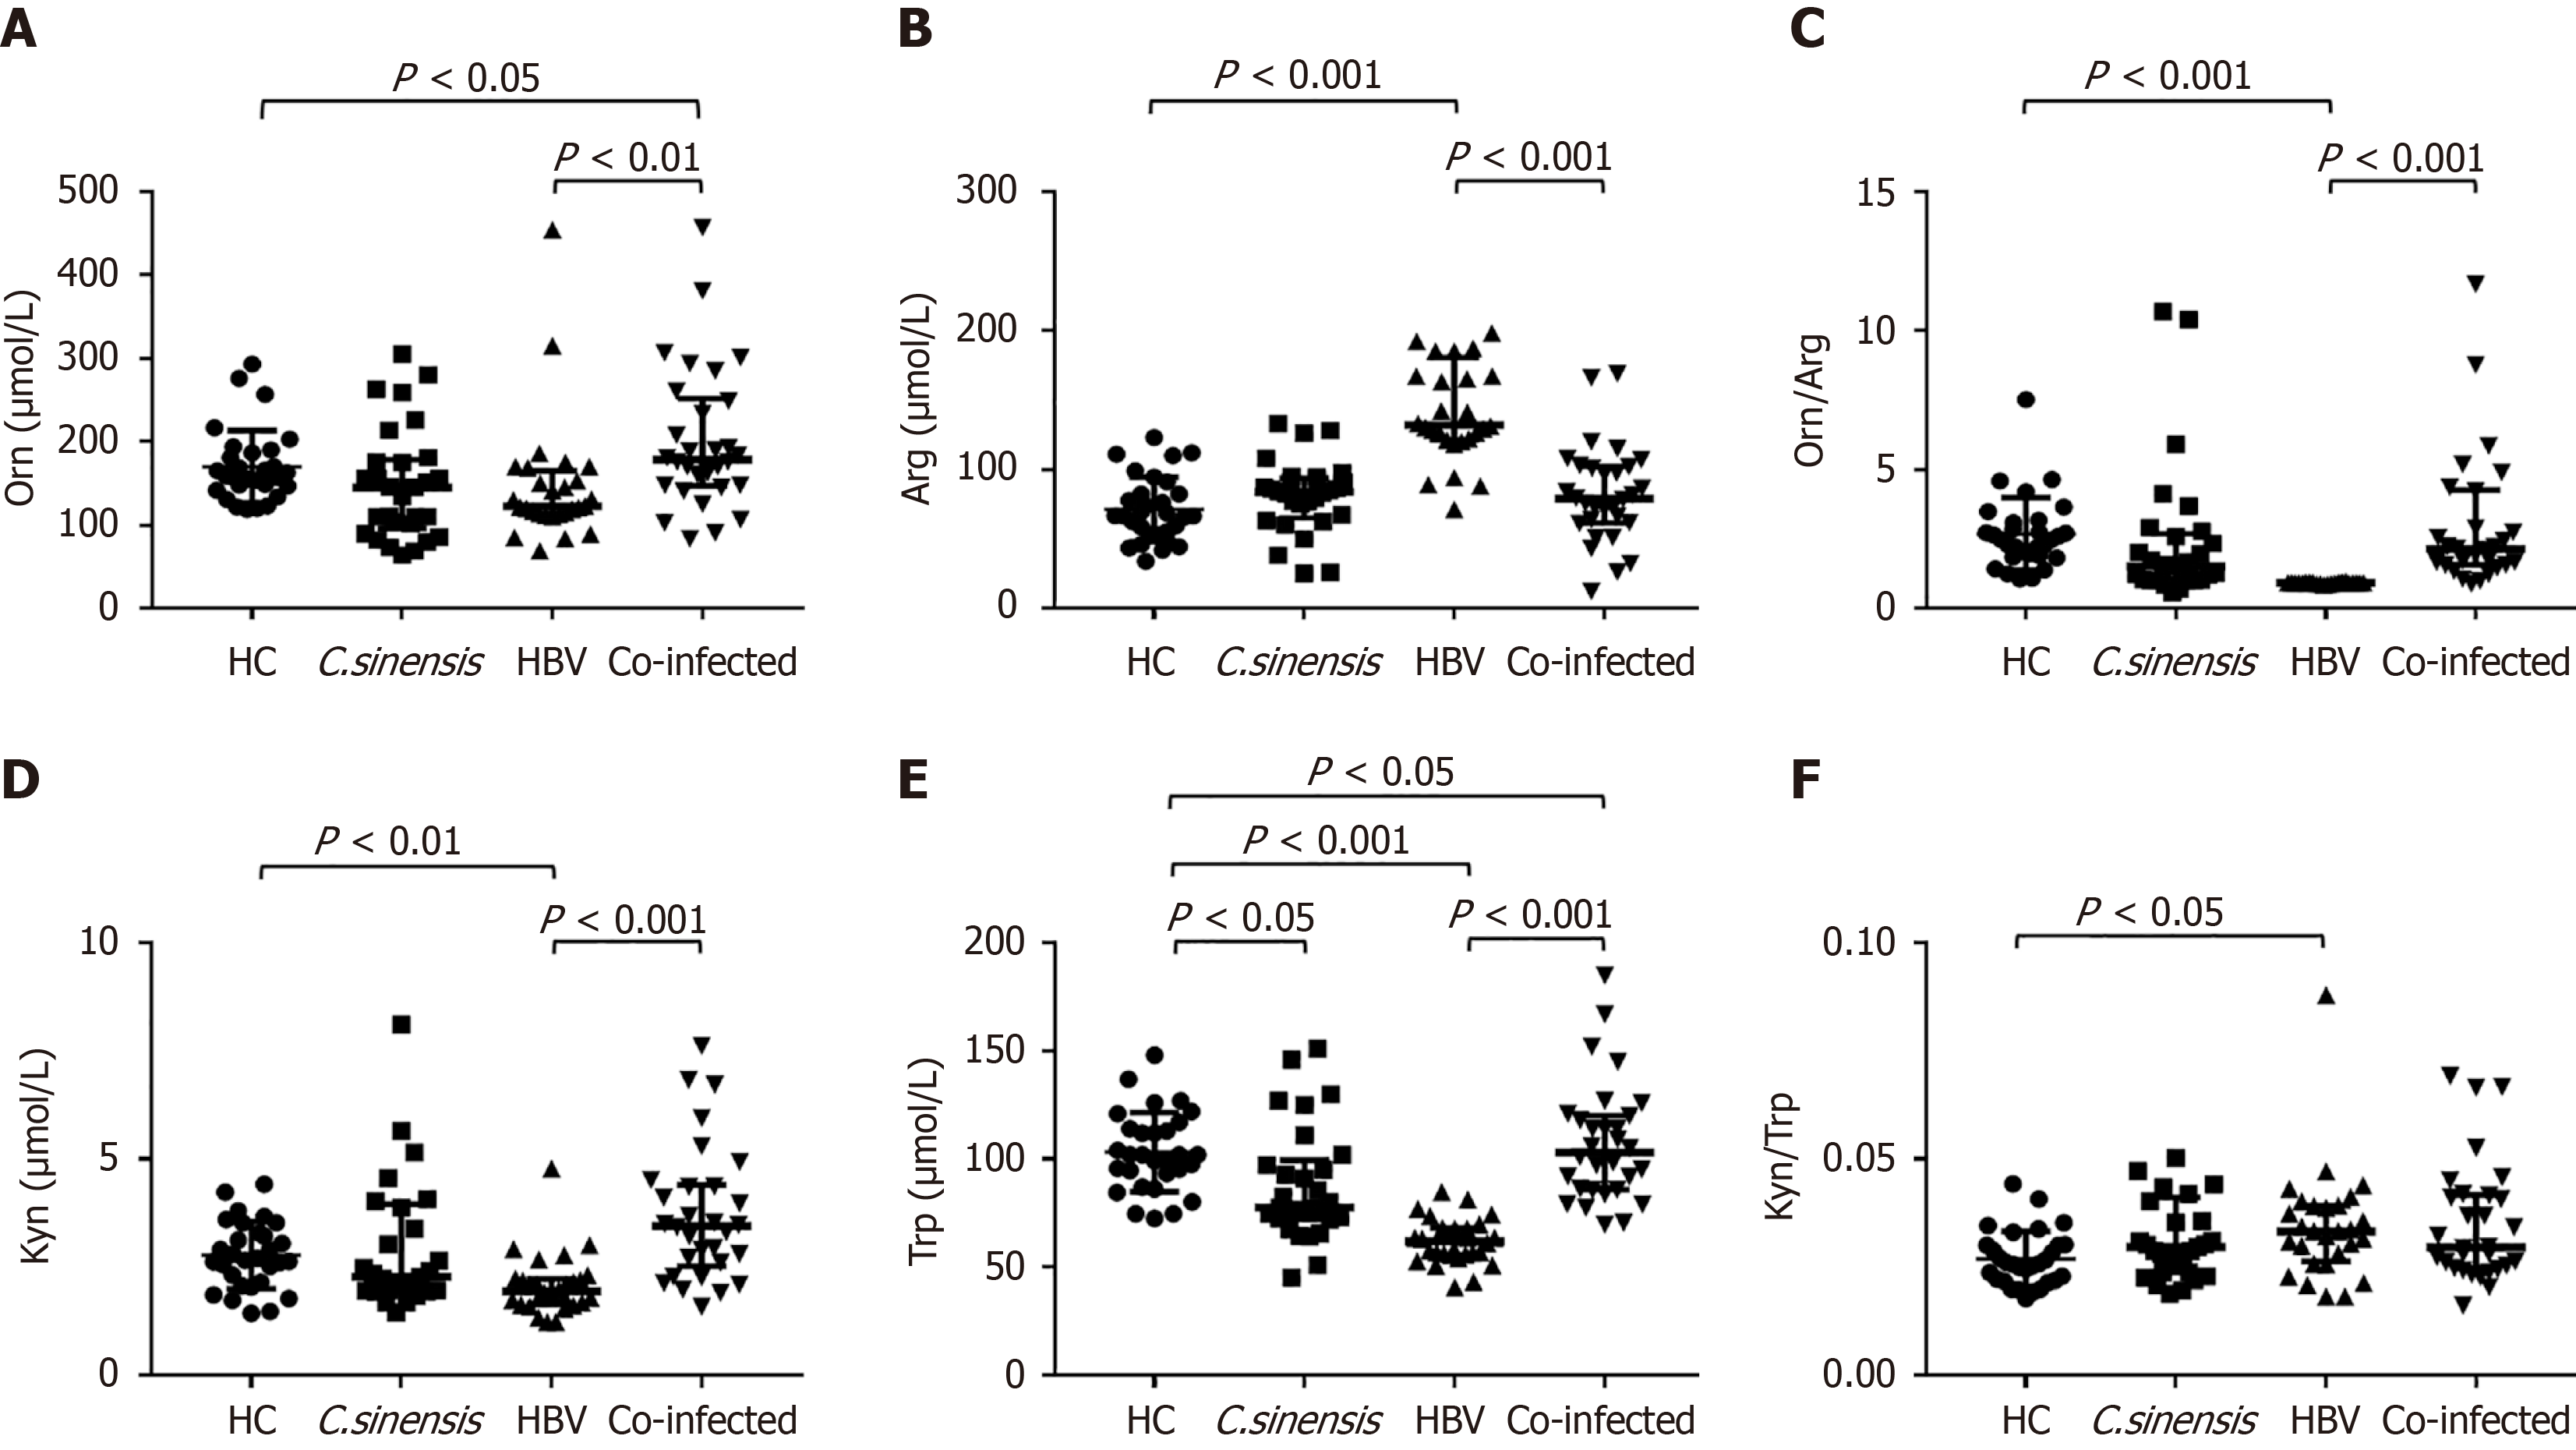
Figure 5 Comparison of serum metabolites in the arginine-ornithine and kynurenine-tryptophan pathways among the four groups.
A: Ornithine; B: Arginine; C: Ornithine-to-arginine ratio; D: Kynurenine; E: Tryptophan; F: Kynurenine-to-tryptophan ratio. Horizontal bars indicate medians. The co-infected group exhibited a markedly elevated ornithine/arginine ratio compared with the hepatitis B virus group (3.46 vs 0.92, P < 0.001; Kruskal-Wallis H test with Dunn’s correction). Orn: Ornithine; Arg: Arginine; Kyn: Kynurenine; Trp: Tryptophan; HC: Healthy controls; C. sinensis: Clonorchis sinensis mono-infected participants; HBV: Hepatitis B virus mono-infected participants; Co-infected: Co-infected participants.
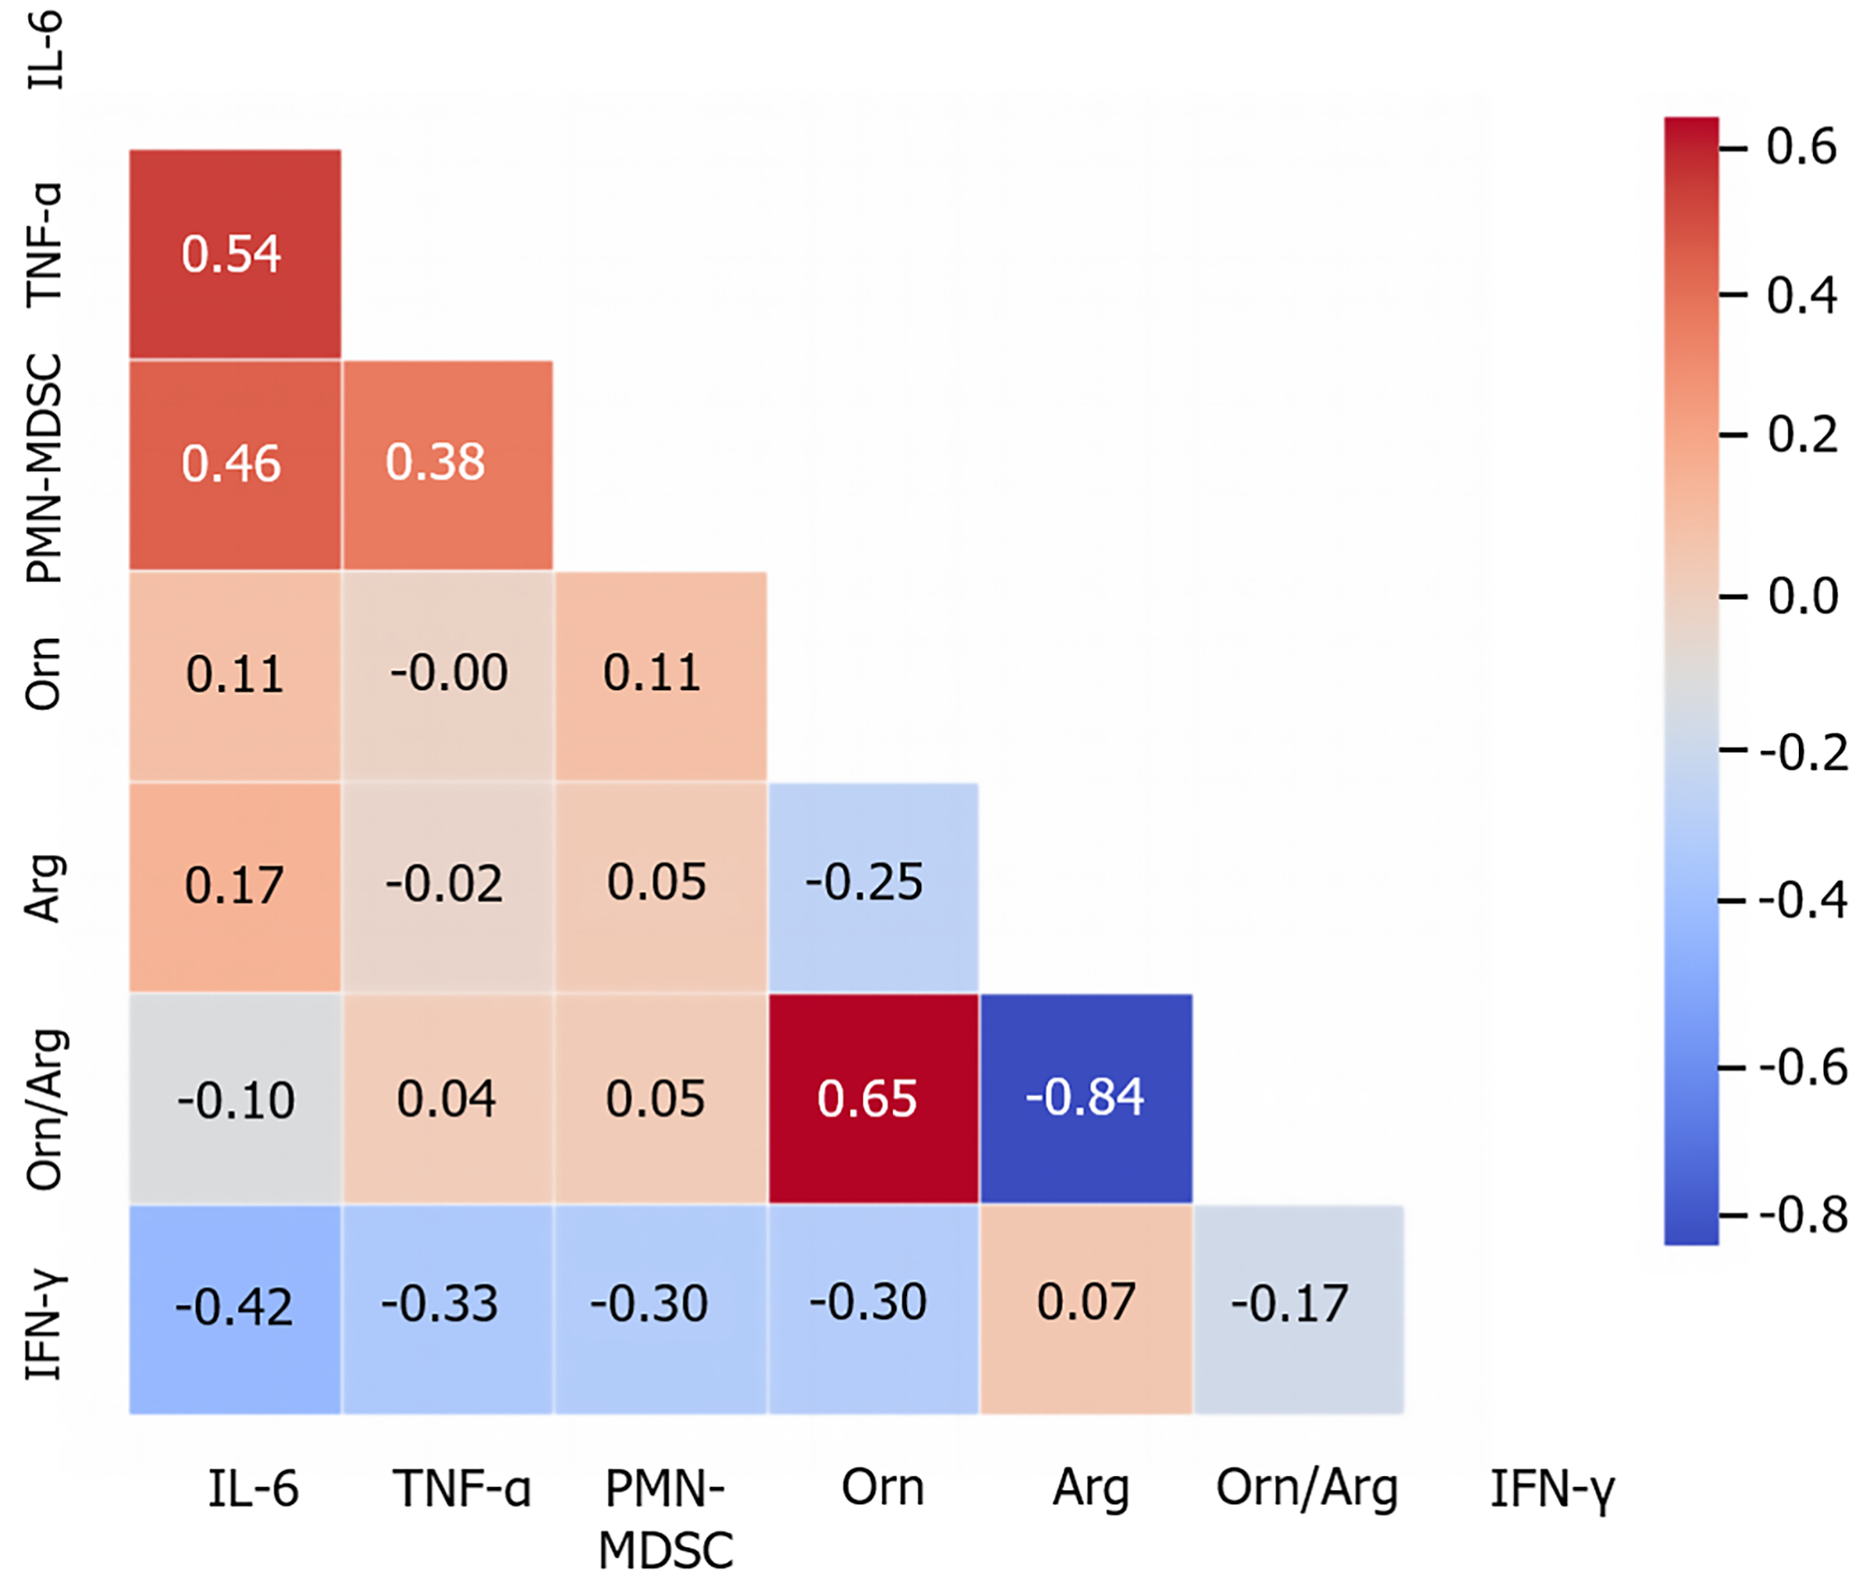
Figure 6 Spearman correlation heatmap of immune and metabolic indicators.
The heatmap illustrates the correlations among polymorphonuclear myeloidderived suppressor cells, cytokines (interleukin-6, tumor necrosis factor-α, interferon-γ), and amino acid metabolites (ornithine, arginine, ornithine/arginine ratio). Red indicates positive correlation; blue indicates negative correlation. P < 0.05 (two-sided; Spearman correlation). IL: Interleukin; TNF-α: Tumor necrosis factor-α; PMN-MDSC: Polymorphonuclear myeloid-derived suppressor cells; Orn: Ornithine; Arg: Arginine; IFN-γ: Interferon-γ.
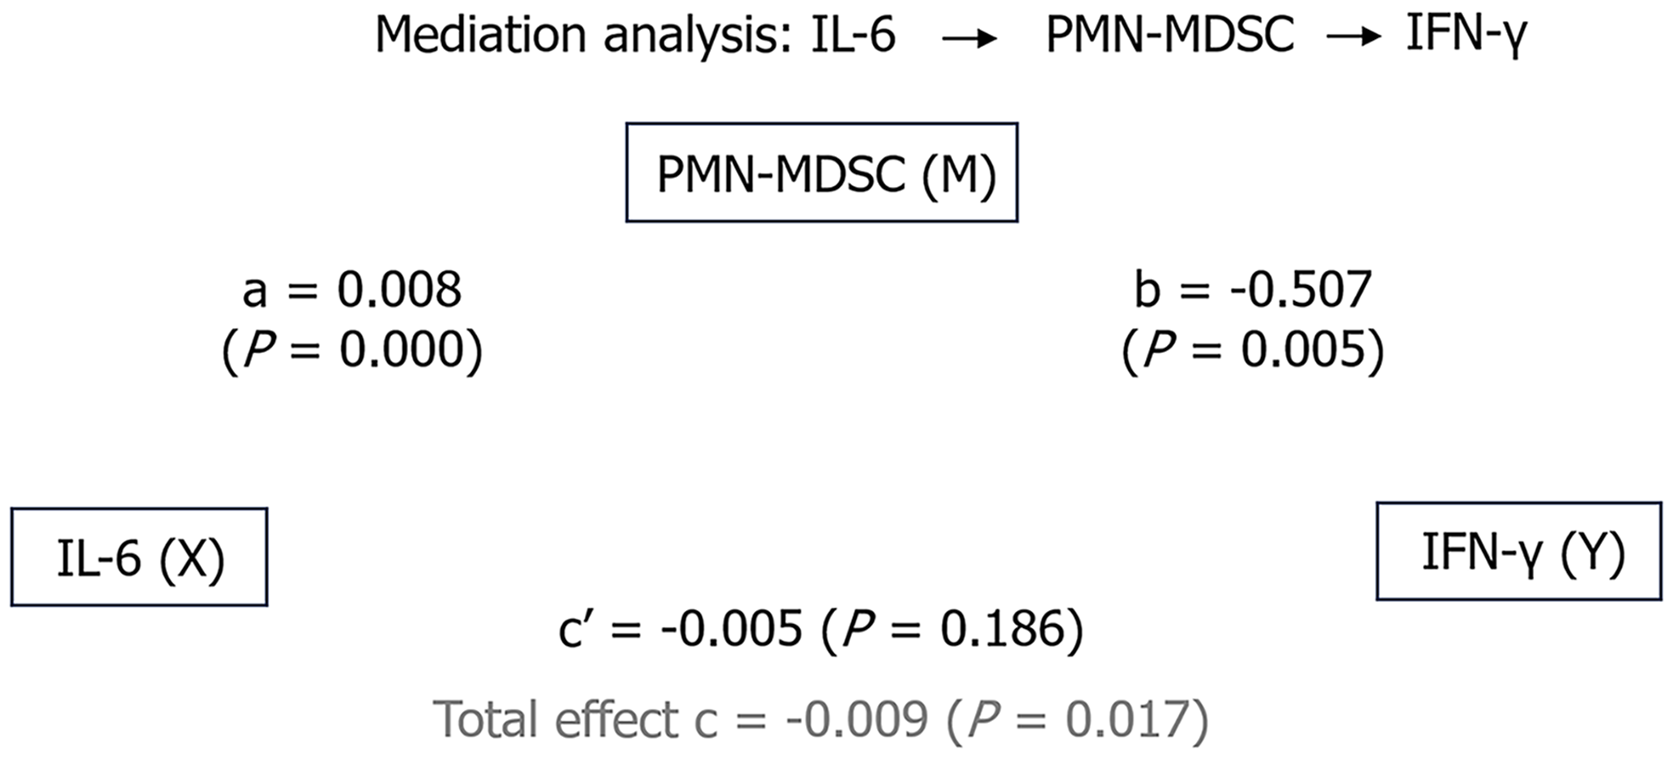
Figure 7 Mediation analysis of the association between interleukin-6 and interferon-γ through polymorphonuclear myeloid-derived suppressor cells.
The path model demonstrates that interleukin-6 (IL-6) promotes polymorphonuclear myeloid-derived suppressor cells (PMN-MDSC) expansion (a = 0.008, P < 0.001), and PMN-MDSCs in turn suppress interferon-γ (IFN-γ) (b = -0.507, P = 0.005). After adjusting for PMN-MDSCs, the direct effect of IL-6 on IFN-γ was attenuated and no longer significant (c’ = -0.005, P = 0.186), whereas the indirect effect via PMN-MDSCs remained significant. The total effect of IL-6 on IFN-γ was -0.009 (P = 0.017), with PMN-MDSCs mediating approximately 45% of this effect. IL-6: Interleukin-6; IFN-γ: Interferon-γ; PMN-MDSC: Polymorphonuclear myeloidderived suppressor cell.
- Citation: Qiu JR, Zhang HB, Shang M, Xu J, Fu YC, Liao Y, Hu B, Dong HM. Clonorchis sinensis co-infection potentiates polymorphonuclear-myeloid-derived suppressor cells expansion and metabolic reprogramming in chronic hepatitis B patients. World J Gastroenterol 2026; 32(44): 122956
- URL: https://www.wjgnet.com/1007-9327/full/v32/i44/122956.htm
- DOI: https://dx.doi.org/10.3748/wjg.122956