
















Copyright: ©Author(s) 2026.
World J Gastroenterol. Nov 28, 2026; 32(44): 122956
Published online Nov 28, 2026. doi: 10.3748/wjg.122956
Published online Nov 28, 2026. doi: 10.3748/wjg.122956
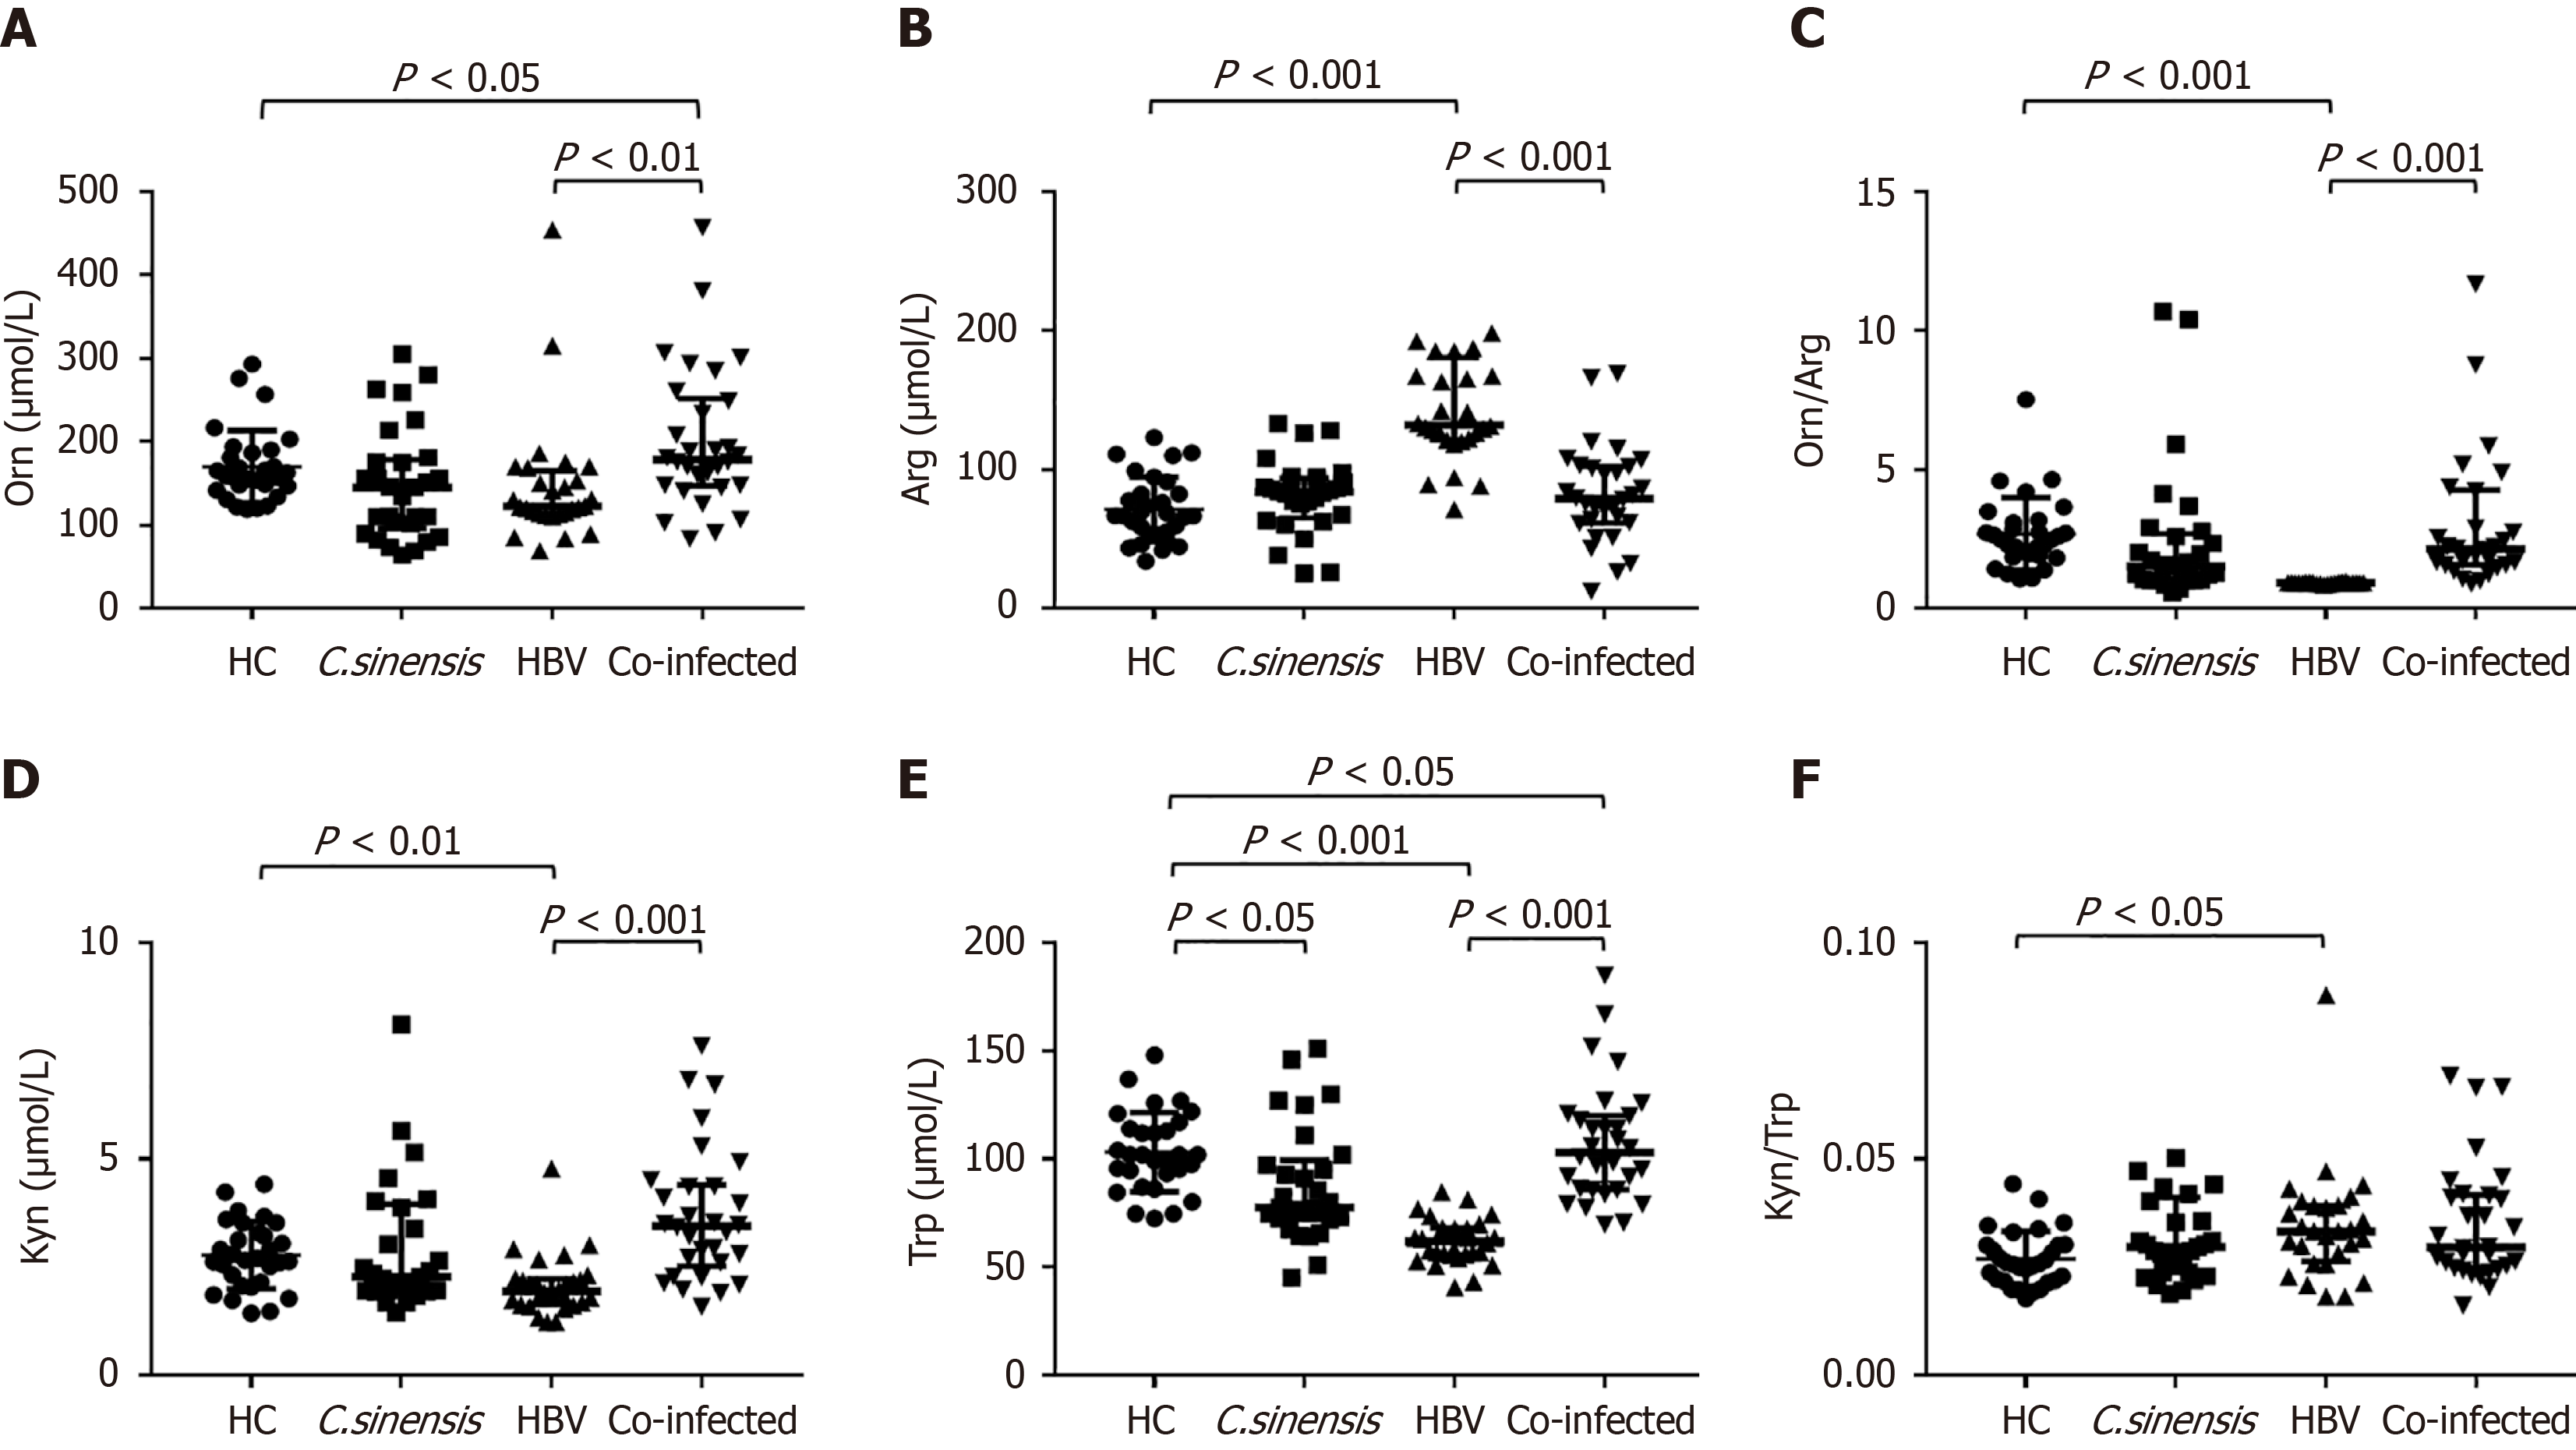
Figure 5 Comparison of serum metabolites in the arginine-ornithine and kynurenine-tryptophan pathways among the four groups.
A: Ornithine; B: Arginine; C: Ornithine-to-arginine ratio; D: Kynurenine; E: Tryptophan; F: Kynurenine-to-tryptophan ratio. Horizontal bars indicate medians. The co-infected group exhibited a markedly elevated ornithine/arginine ratio compared with the hepatitis B virus group (3.46 vs 0.92, P < 0.001; Kruskal-Wallis H test with Dunn’s correction). Orn: Ornithine; Arg: Arginine; Kyn: Kynurenine; Trp: Tryptophan; HC: Healthy controls; C. sinensis: Clonorchis sinensis mono-infected participants; HBV: Hepatitis B virus mono-infected participants; Co-infected: Co-infected participants.
- Citation: Qiu JR, Zhang HB, Shang M, Xu J, Fu YC, Liao Y, Hu B, Dong HM. Clonorchis sinensis co-infection potentiates polymorphonuclear-myeloid-derived suppressor cells expansion and metabolic reprogramming in chronic hepatitis B patients. World J Gastroenterol 2026; 32(44): 122956
- URL: https://www.wjgnet.com/1007-9327/full/v32/i44/122956.htm
- DOI: https://dx.doi.org/10.3748/wjg.122956