
















Copyright: ©Author(s) 2026.
World J Gastroenterol. Nov 28, 2026; 32(44): 122956
Published online Nov 28, 2026. doi: 10.3748/wjg.122956
Published online Nov 28, 2026. doi: 10.3748/wjg.122956
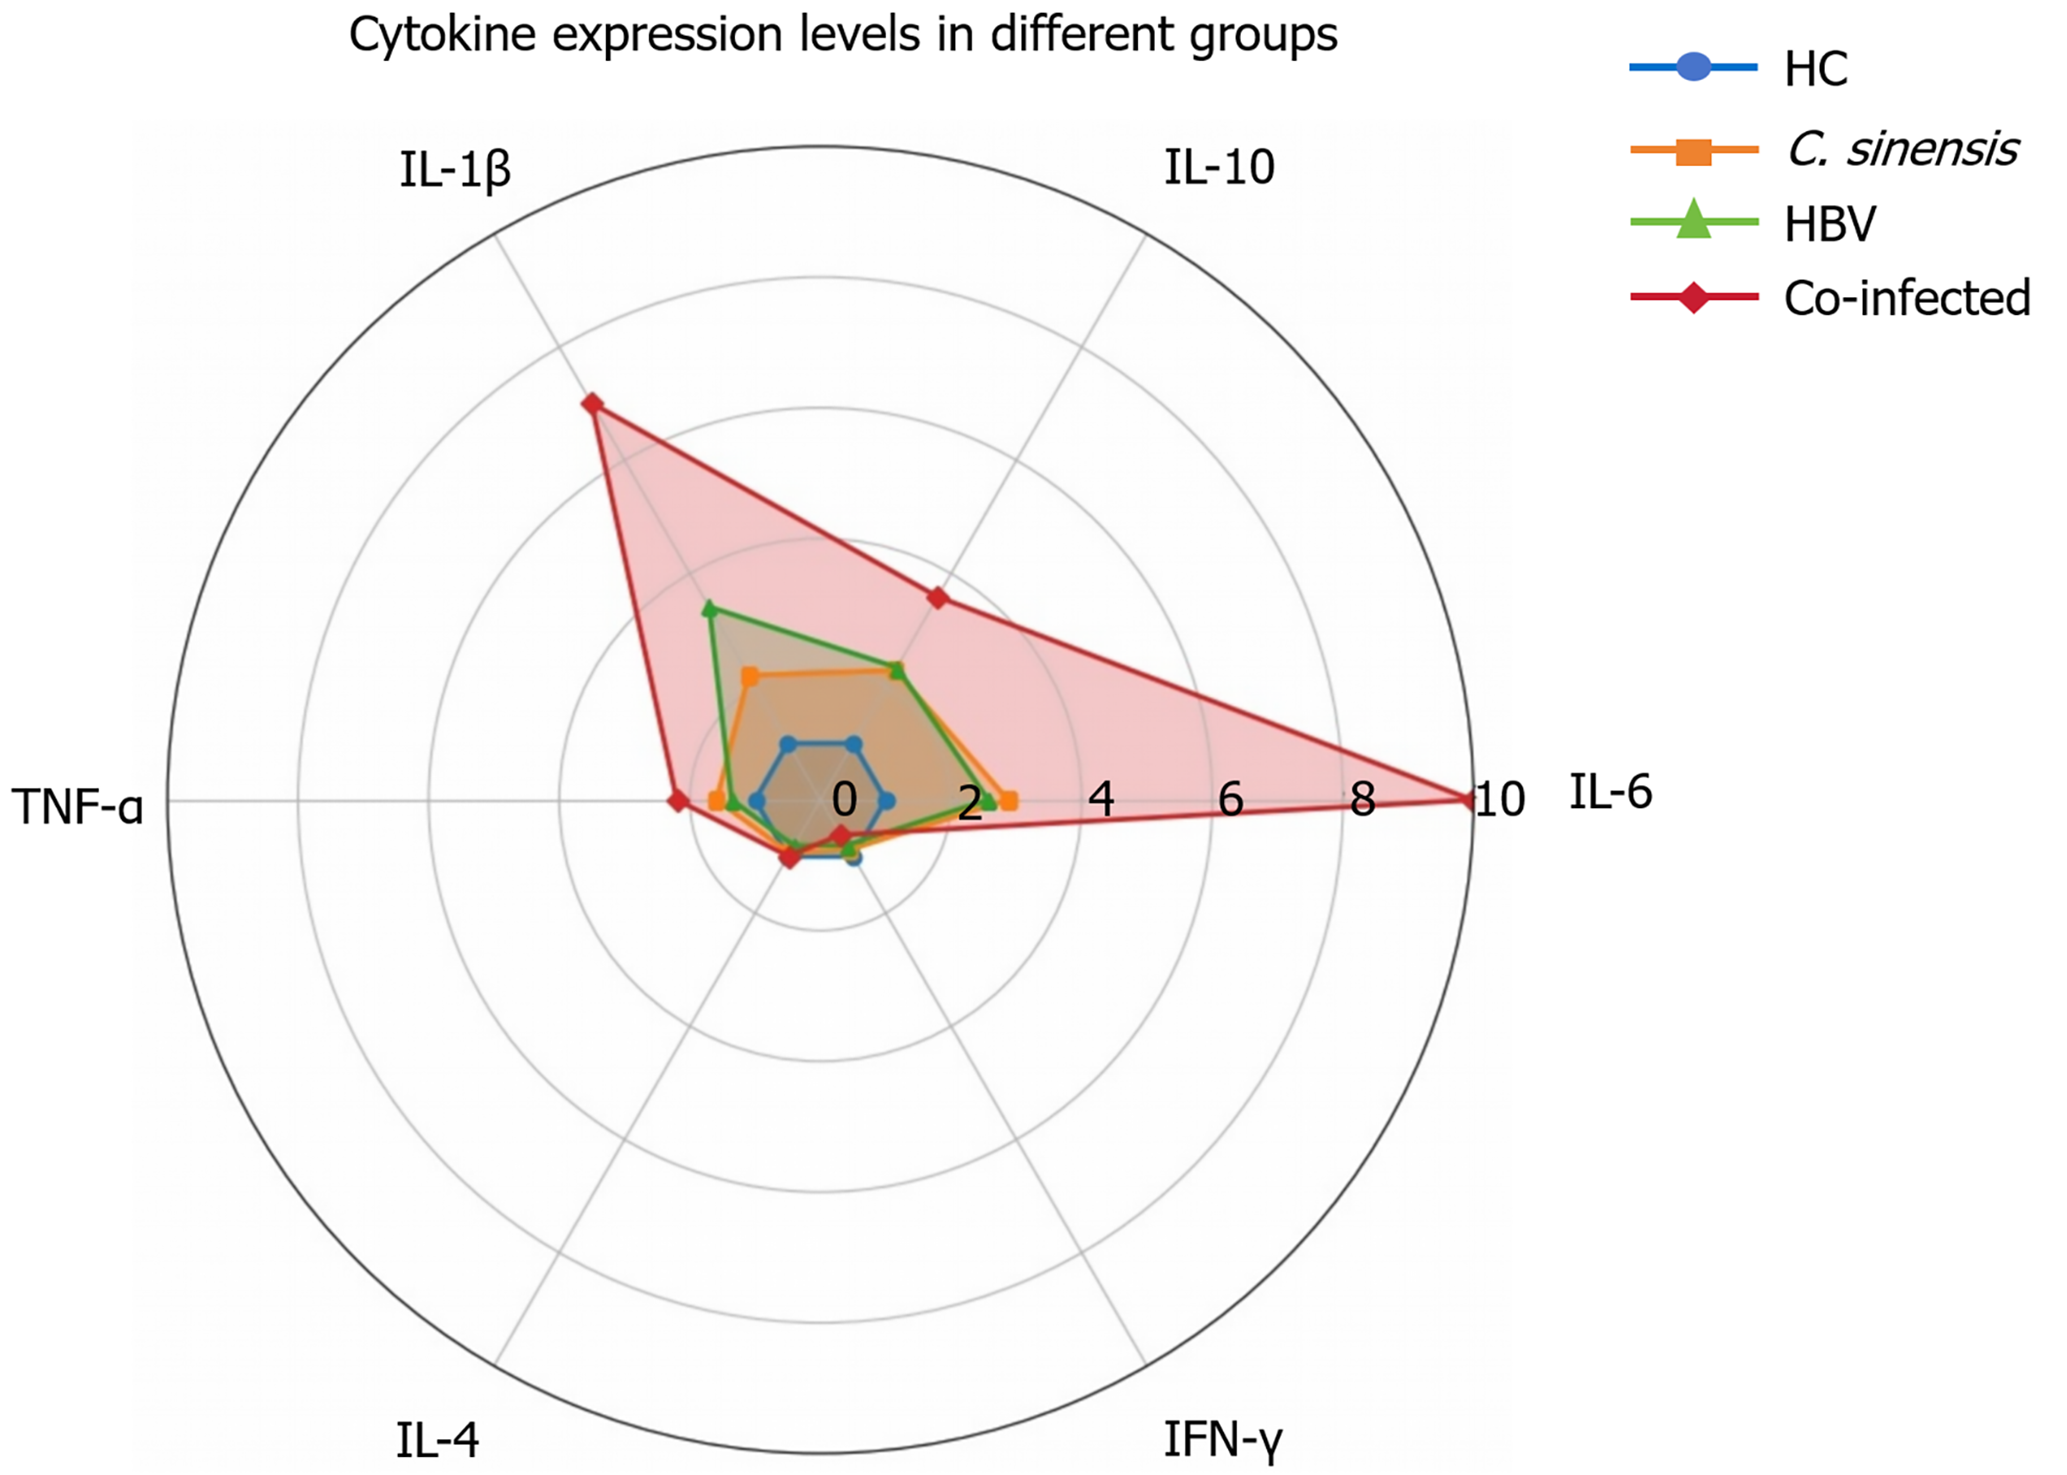
Figure 2 Radar chart of cytokine levels among the four groups.
Relative levels of interleukin-6, tumor necrosis factor-α, interferon-γ, interleukin-10, interleukin-1β, and interleukin-4 are shown after normalization to the healthy controls group (set to 1). Each axis represents one cytokine; the area covered by each group reflects its overall cytokine profile. HC: Healthy controls; C. sinensis: Clonorchis sinensis mono-infected participants; HBV: Hepatitis B virus mono-infected participants; Co-infected: Co-infected participants; IL: Interleukin; TNF-α: Tumor necrosis factor-α; IFN-γ: Interferon-γ.
- Citation: Qiu JR, Zhang HB, Shang M, Xu J, Fu YC, Liao Y, Hu B, Dong HM. Clonorchis sinensis co-infection potentiates polymorphonuclear-myeloid-derived suppressor cells expansion and metabolic reprogramming in chronic hepatitis B patients. World J Gastroenterol 2026; 32(44): 122956
- URL: https://www.wjgnet.com/1007-9327/full/v32/i44/122956.htm
- DOI: https://dx.doi.org/10.3748/wjg.122956