
















Copyright: ©Author(s) 2026.
World J Gastroenterol. Nov 28, 2026; 32(44): 122438
Published online Nov 28, 2026. doi: 10.3748/wjg.122438
Published online Nov 28, 2026. doi: 10.3748/wjg.122438
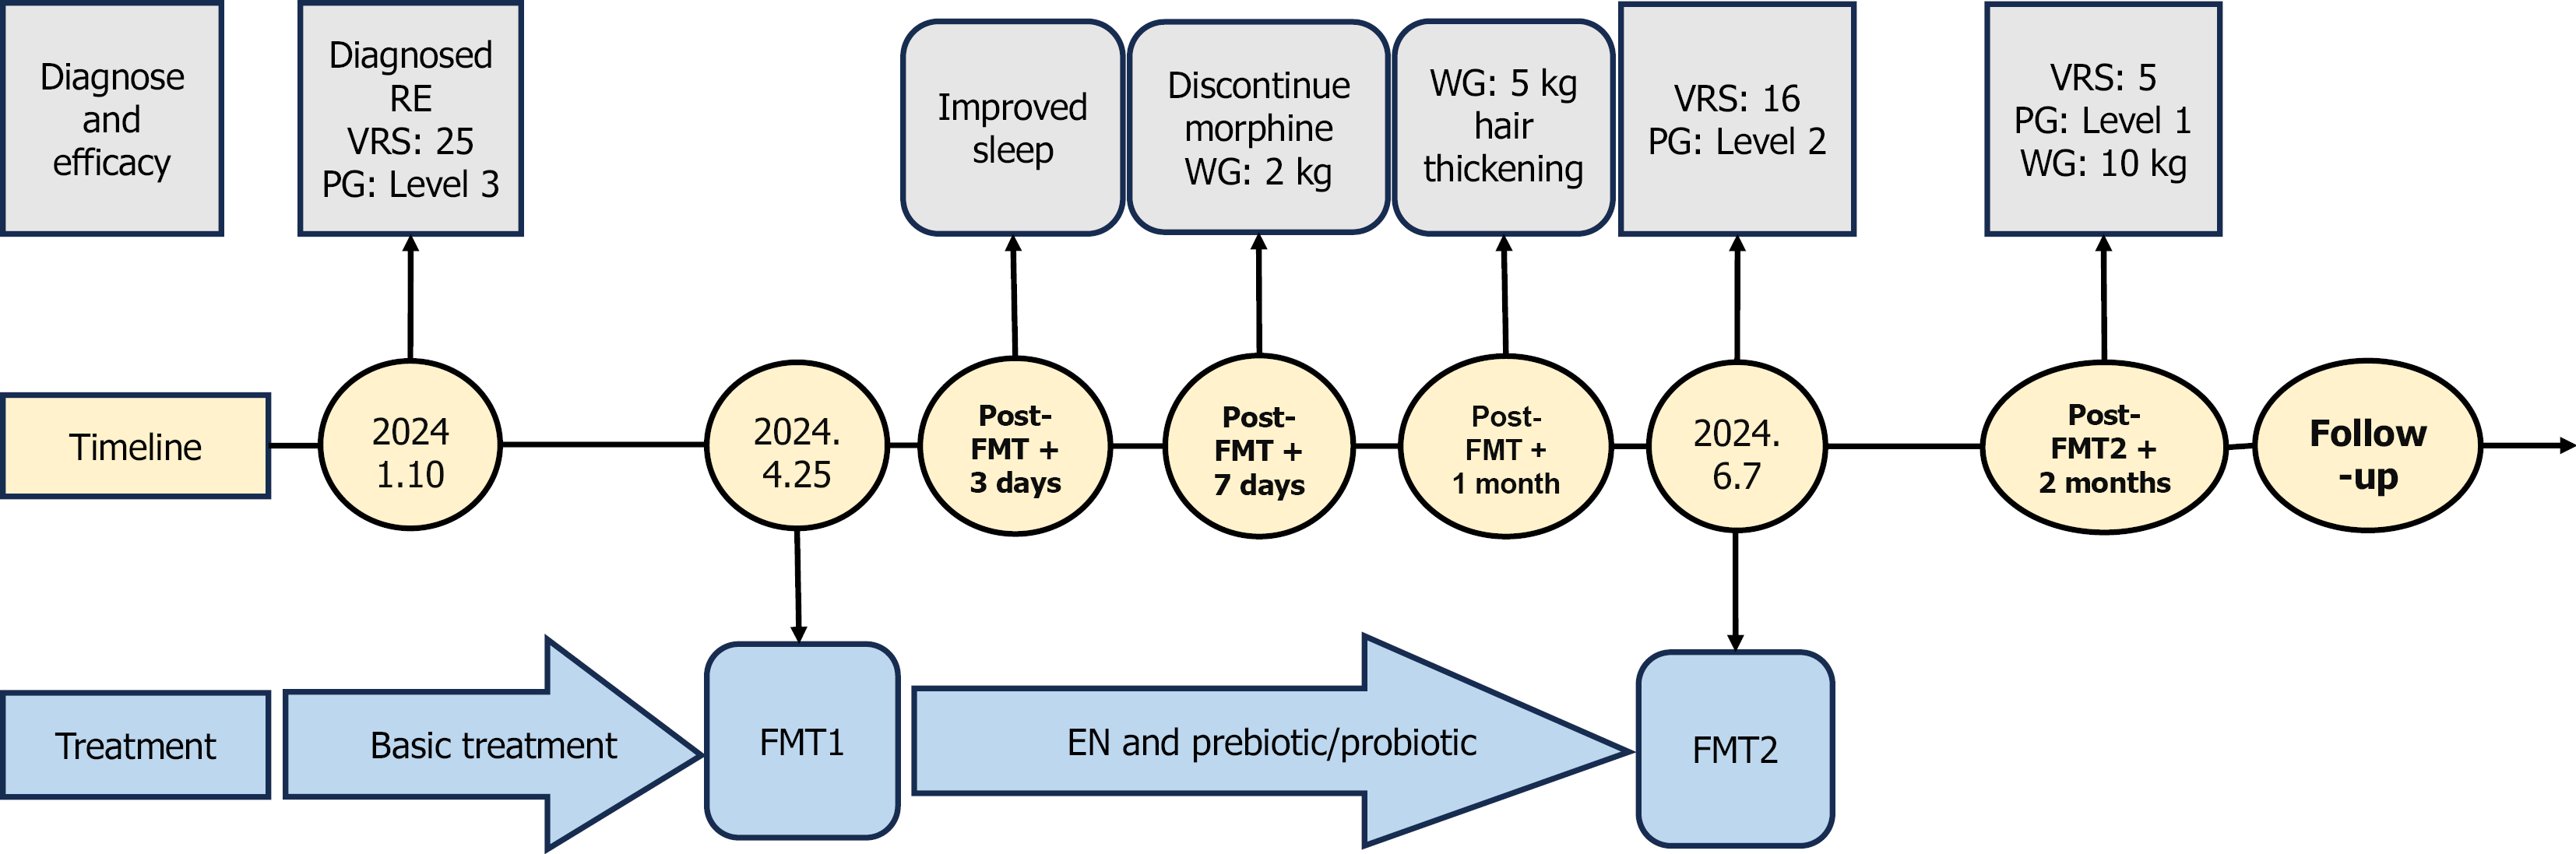
Figure 1 Timeline of the fecal microbiota transplantation and efficacy.
FMT: Fecal microbiota transplantation; EN: Enteral nutrition; WG: Weight gain; VRS: Vienna Rectoscopy Score; PG: Proctitis grading.
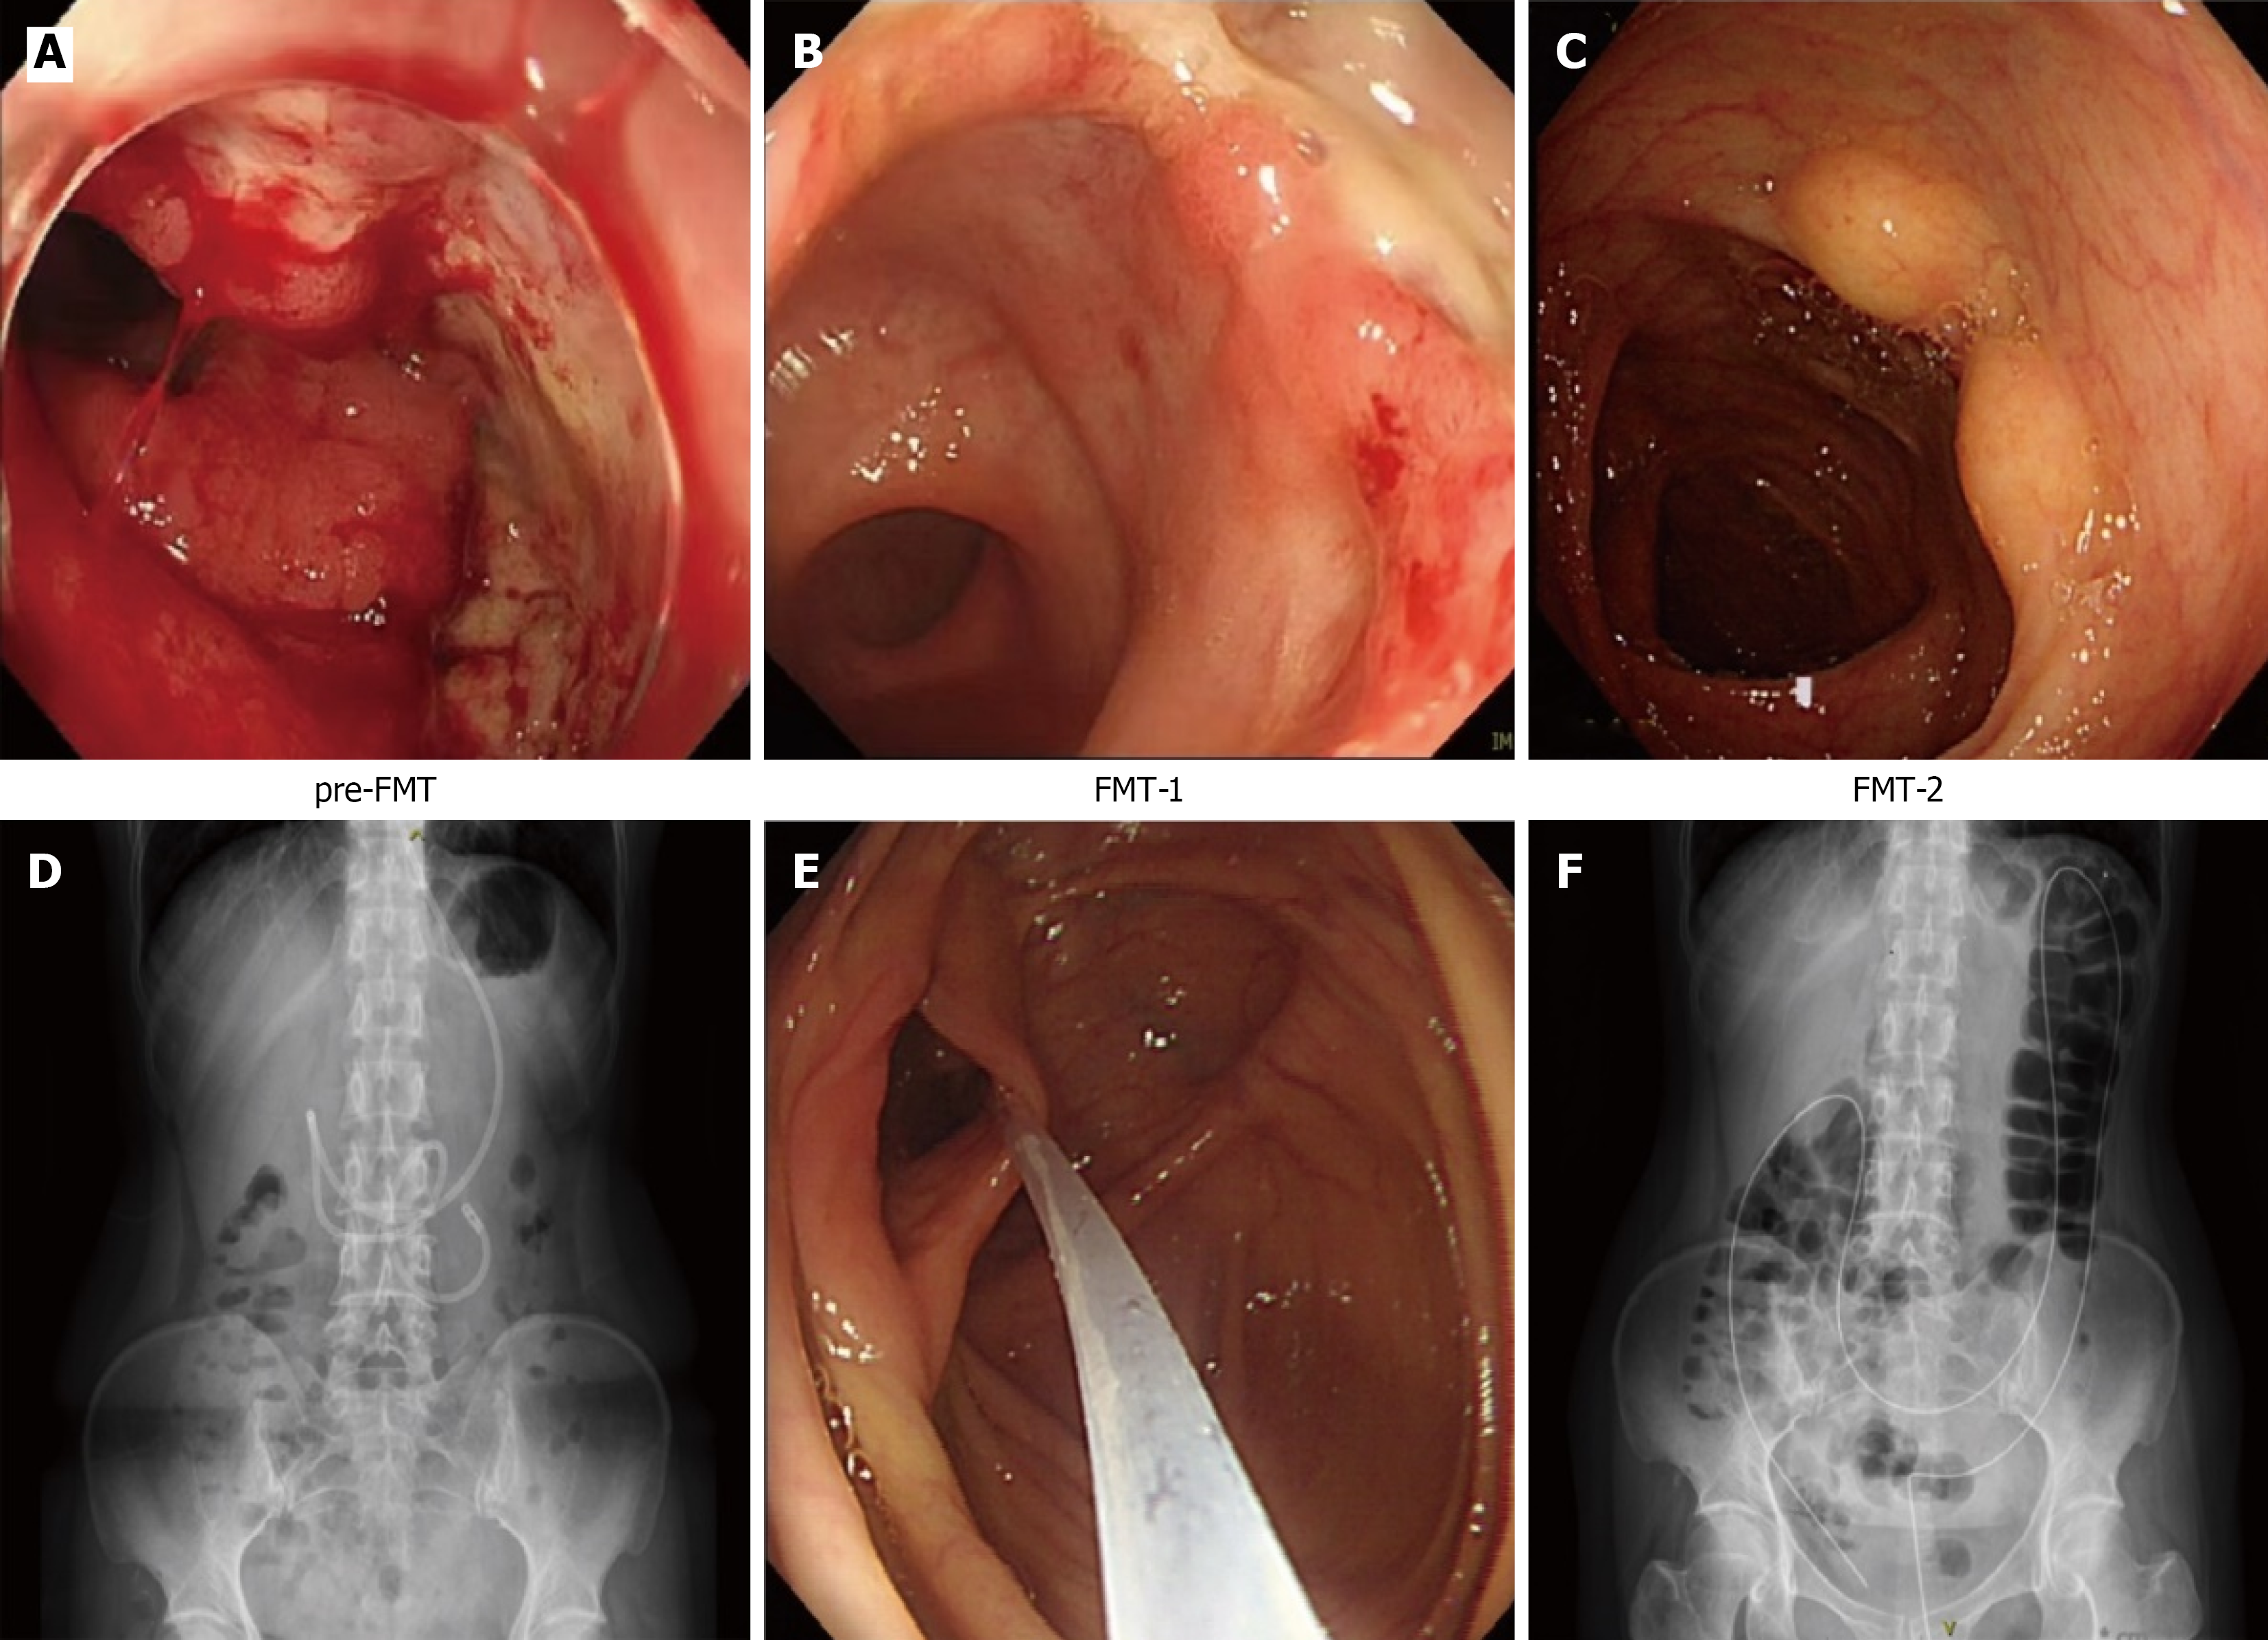
Figure 2 Representative colonoscopic and radiologic images of the patient before and after sequential fecal microbiota transplantation.
A: Colonoscopic view before fecal microbiota transplantation (FMT), showing mucosal congestion, edema, hemorrhage, ulceration, and luminal stenosis; B: Colonoscopic view at 1 month after the first FMT, showing notable improvement in mucosal inflammation compared with baseline; C: Colonoscopic view at 2 months after the second FMT, showing nearly normal mucosa with only mild residual changes; D: Abdominal Xray confirming the placement of the nasojejunal tube for FMT administration; E: Intraoperative endoscopic view confirming tube patency after flushing with normal saline before scope withdrawal; F: Abdominal Xray verifying the stable position of the nasojejunal tube after FMT. pre-FMT: Baseline before fecal microbiota transplantation; FMT-1: 1 month after the first fecal microbiota transplantation; FMT-2: 2 months after the second fecal microbiota transplantation.
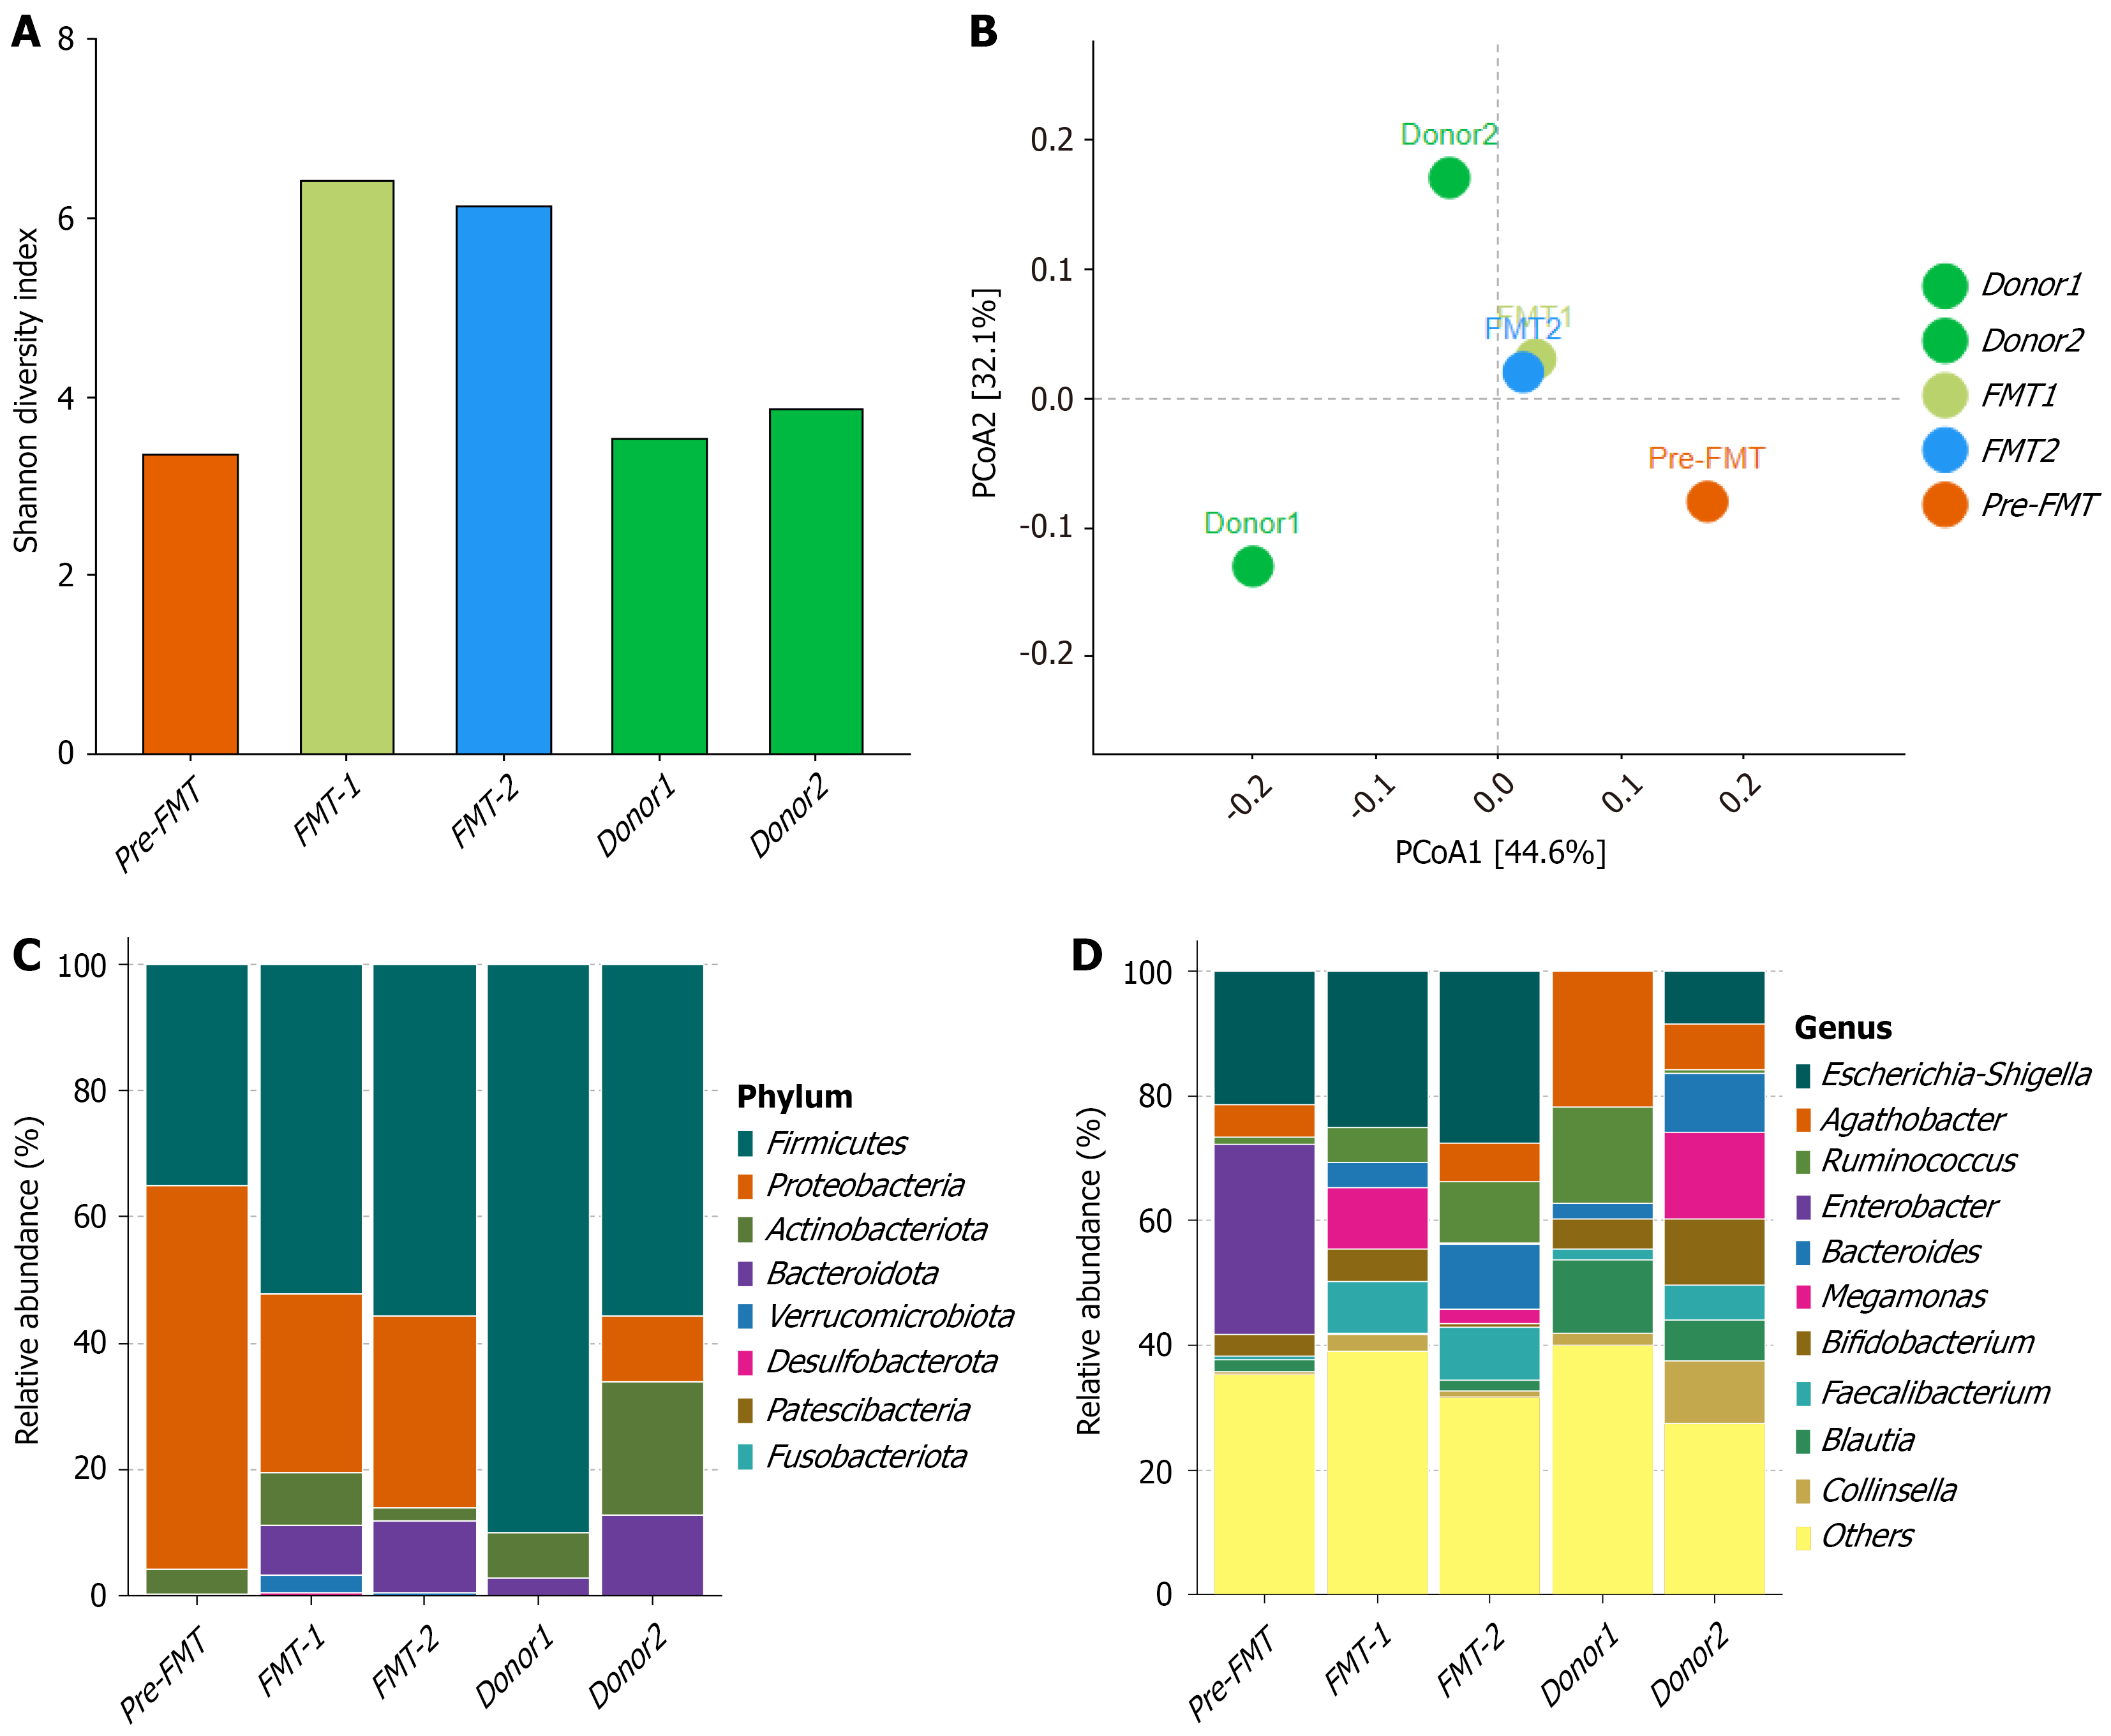
Figure 3 Microbiome analysis of the patient before and after sequential fecal microbiota transplantation.
A: α-diversity represented by the Shannon diversity index, showing changes in gut microbial richness across pre-fecal microbiota transplantation (FMT), FMT-1, FMT-2, and donor samples; B: β-diversity analyzed via principal coordinates analysis, illustrating dissimilarities in microbial community structure; C: Taxonomic classification of gut microbiota at the phylum level; D: Taxonomic classification of gut microbiota at the genus level. pre-FMT: Baseline before FMT; FMT-1: 1 month after the first FMT; FMT-2: 2 months after the second FMT; PCoA: Principal coordinates analysis; Donor1/Donor2: Fecal microbiota donors.
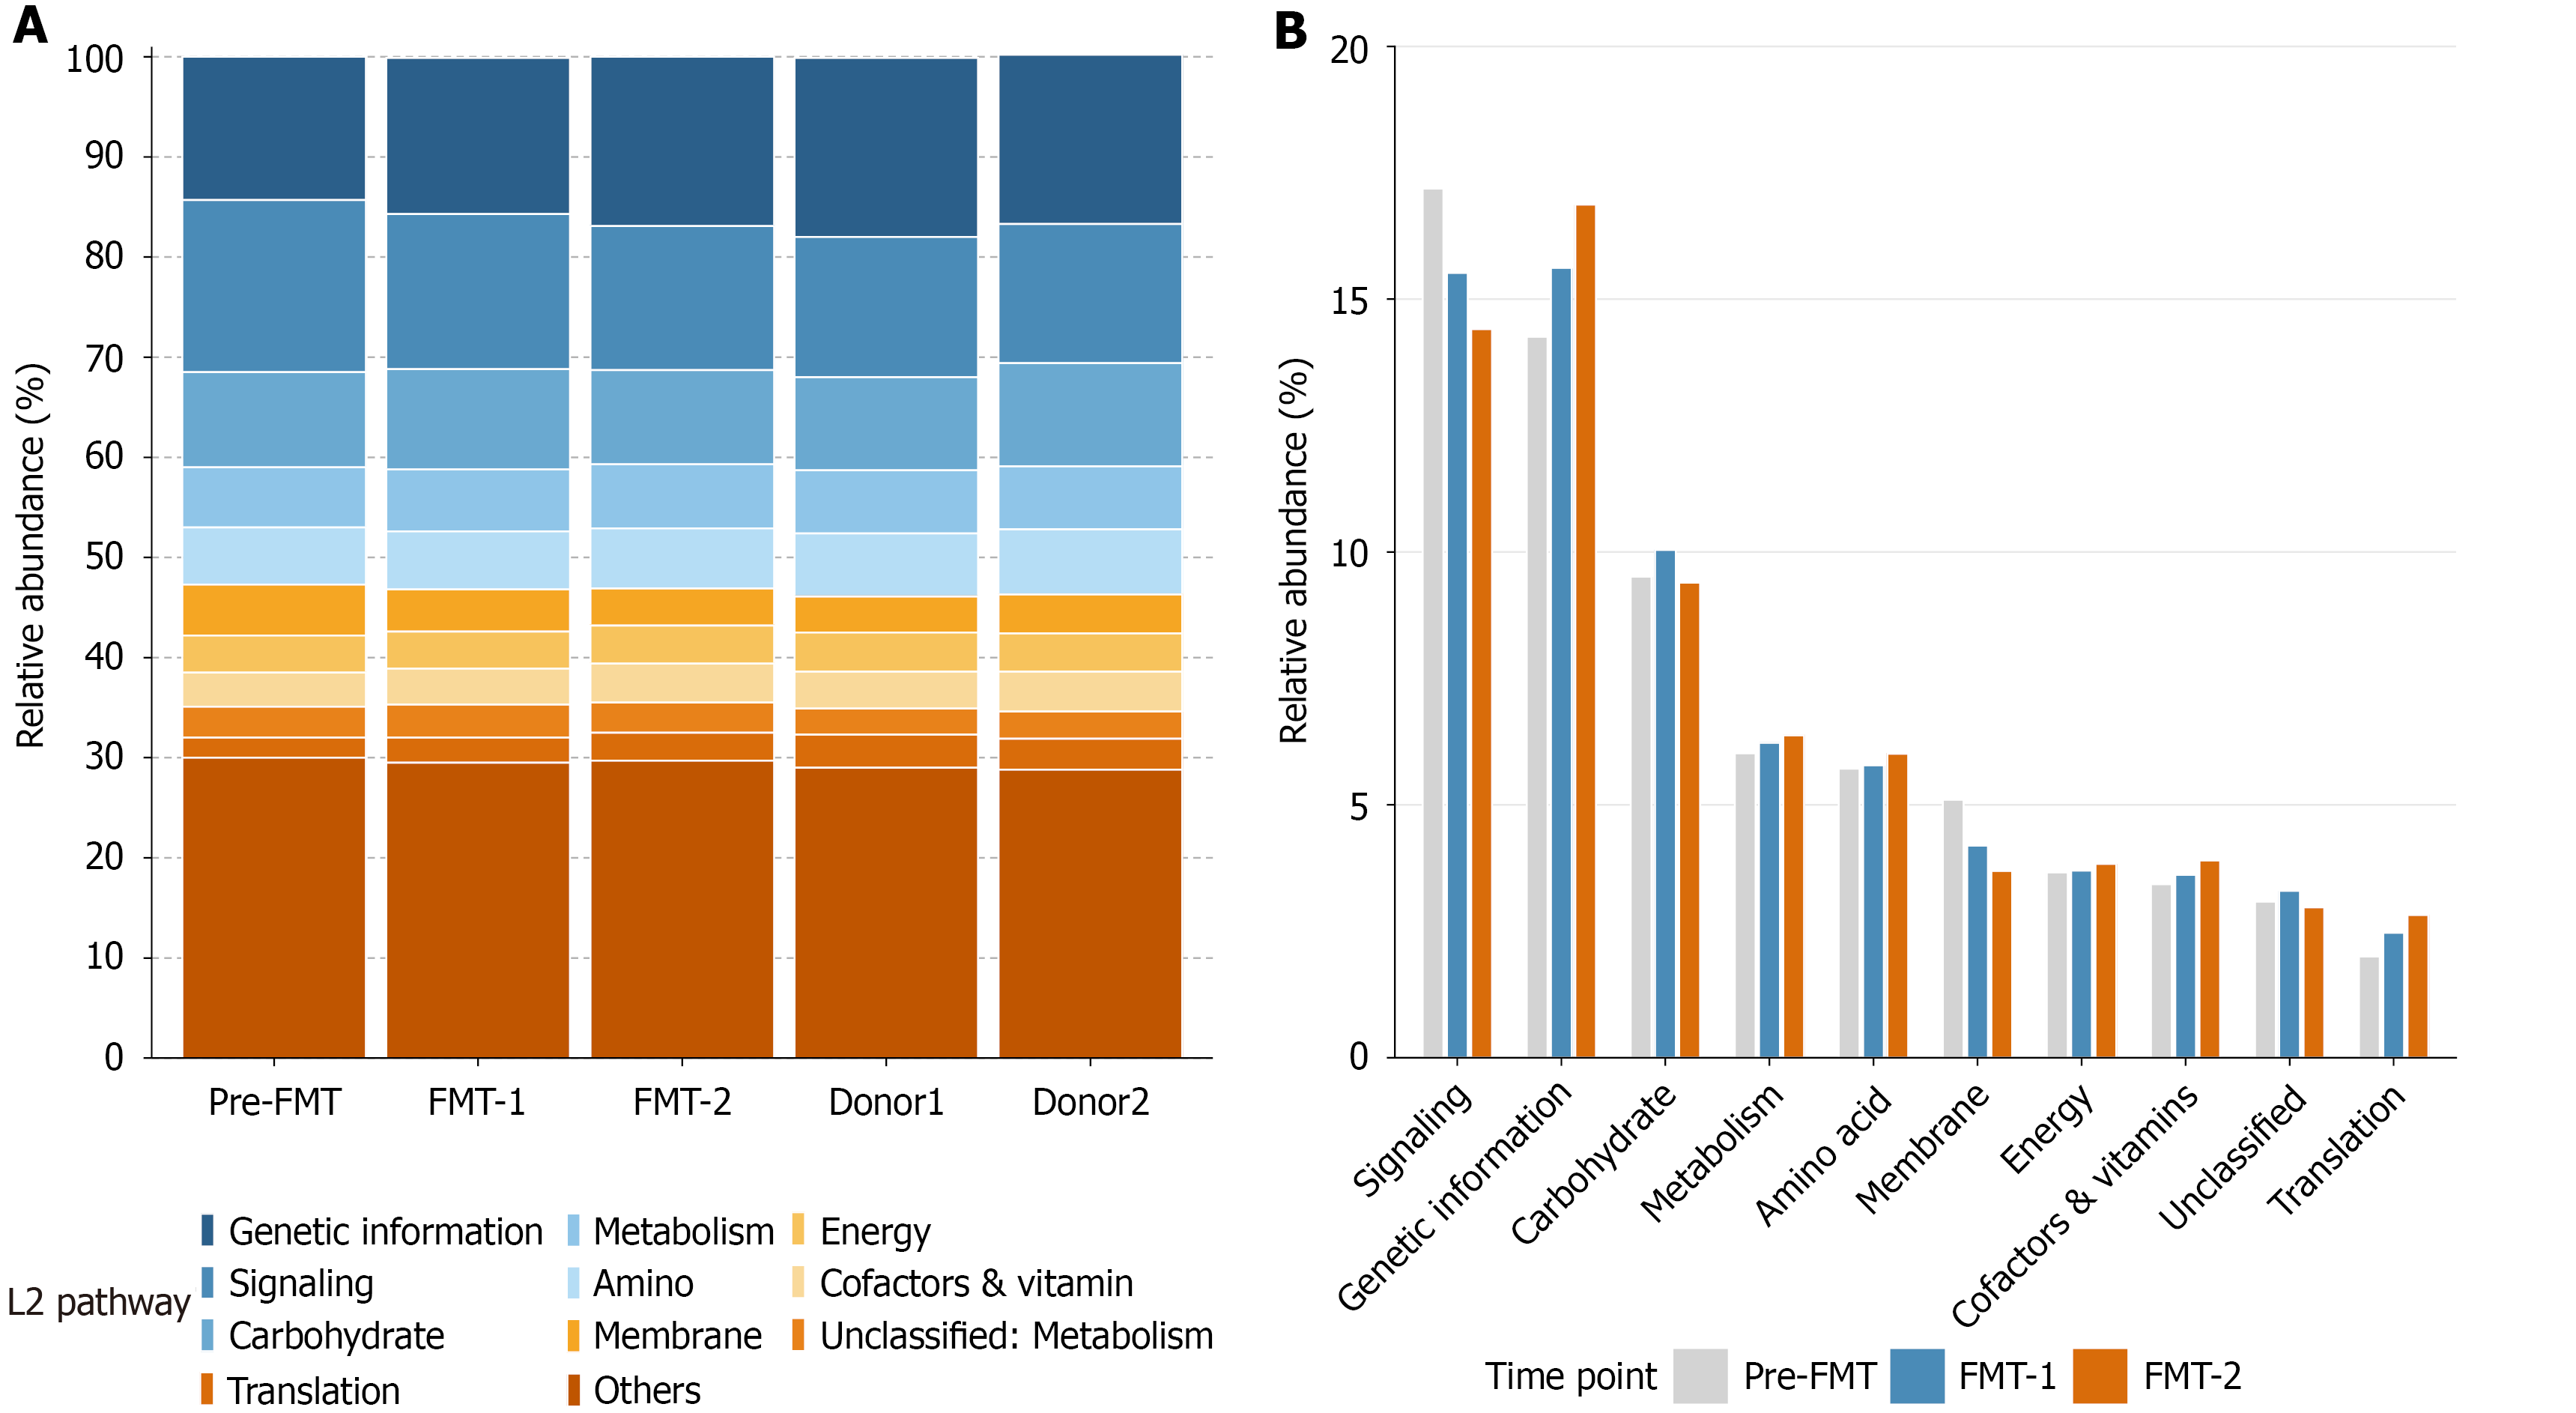
Figure 4 Predicted Kyoto Encyclopedia of Genes and Genomes level 2 functional profiles of the patient before and after fecal microbiota transplantation.
A: Relative abundances of Kyoto Encyclopedia of Genes and Genomes level 2 pathways across pre-fecal microbiota transplantation (FMT), FMT-1, FMT-2, and two donor samples (Donor1, Donor2), grouped by level 1 categories (Metabolism, Genetic Information Processing, Environmental Information Processing, Cellular Processes, Organismal Systems, Human Diseases, Brite Hierarchies, and Unclassified); B: Detailed abundance patterns of individual level 2 pathways, highlighting functional modules with notable shifts after FMT. Predictions were generated using PICRUSt2 from 16S rRNA sequencing data. pre-FMT: Baseline before fecal microbiota transplantation; FMT-1: 1 month after the first fecal microbiota transplantation; FMT-2: 2 months after the second fecal microbiota transplantation; Donor1/Donor2: Fecal microbiota donors.
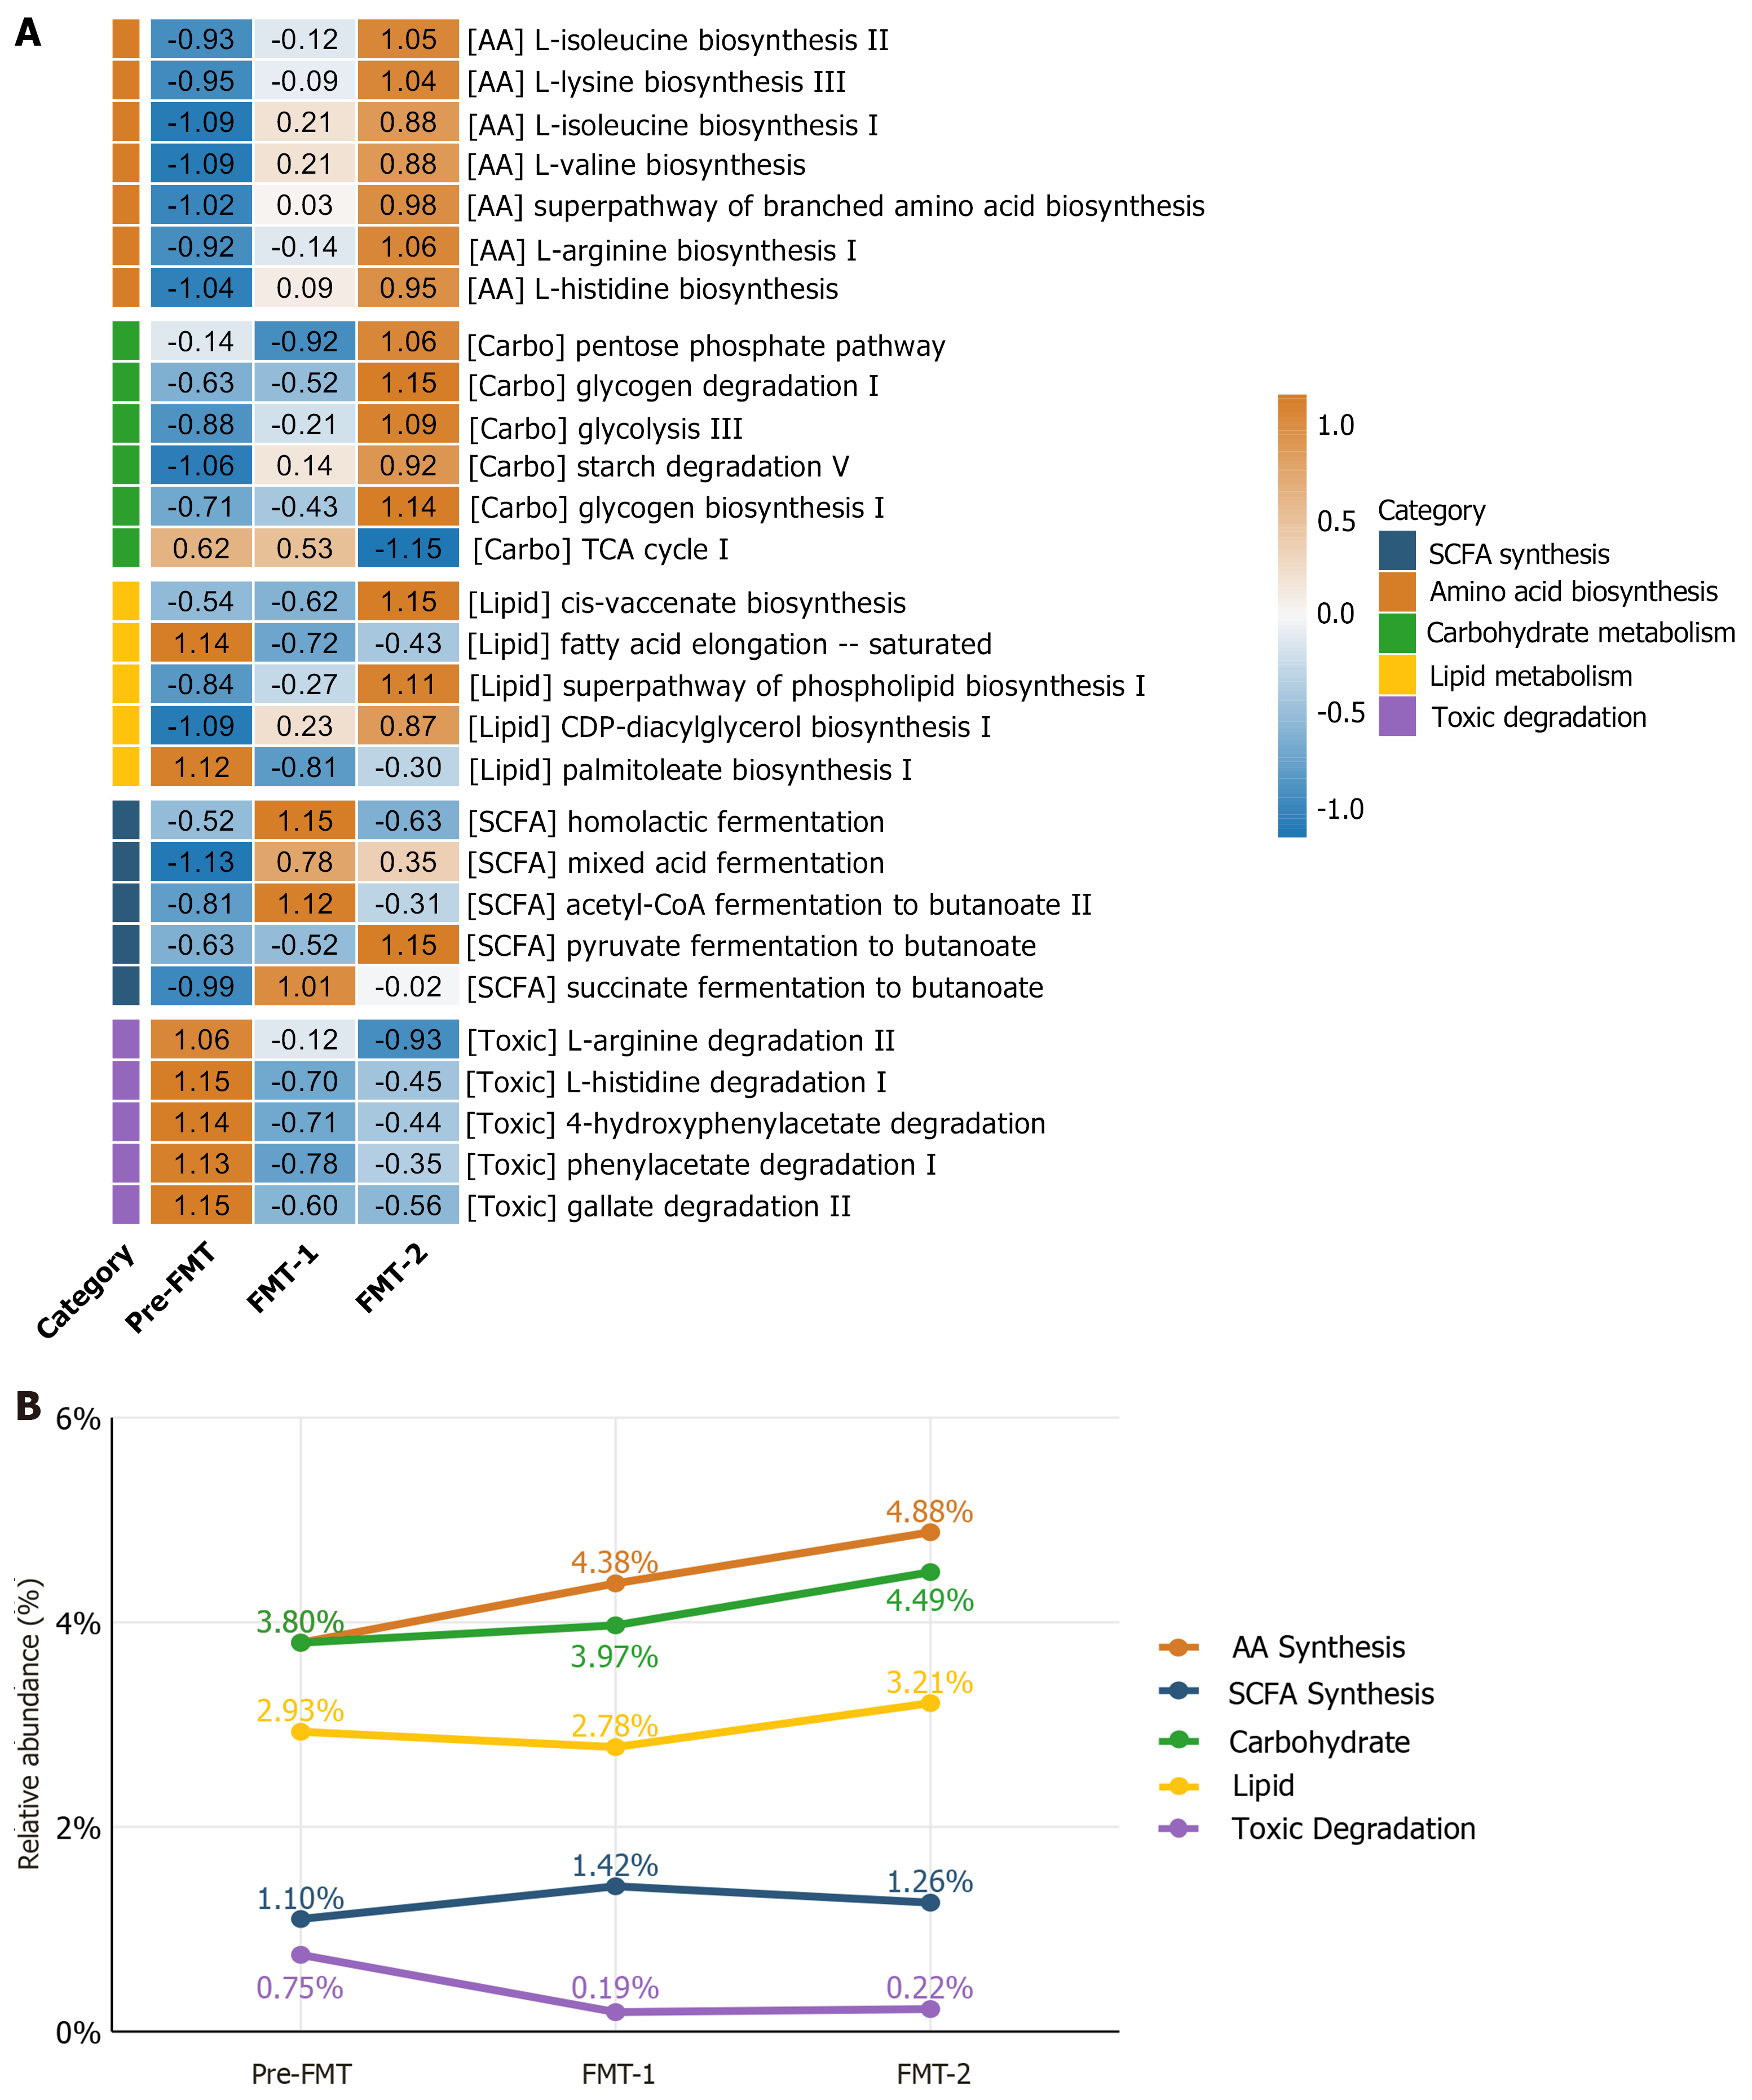
Figure 5 Temporal shifts in MetaCyc pathway abundances of the patient’s gut microbiome pre- and post-faecal microbiota trans
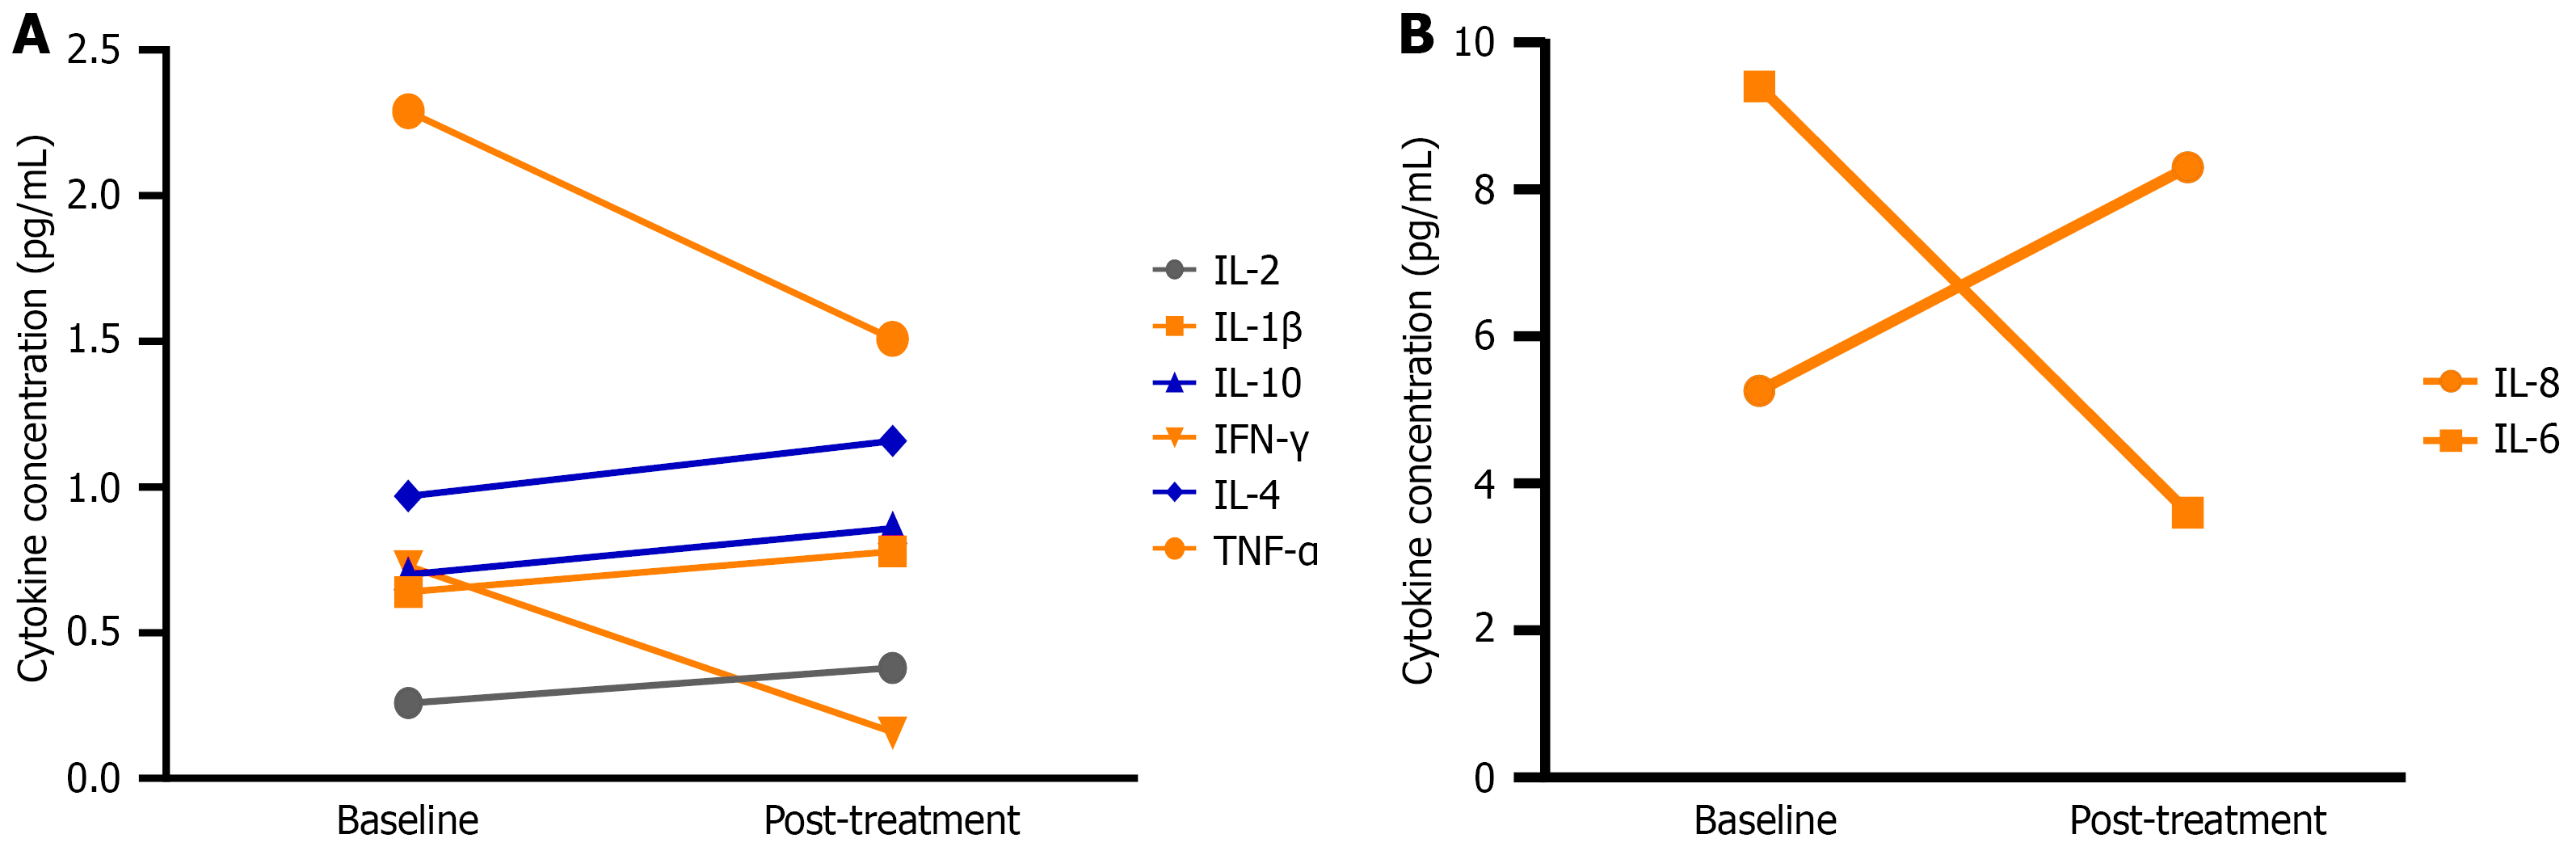
Figure 6 Dynamic changes of serum cytokines at baseline and post microbiota-nutrition sequential therapy.
A: Profiles of six low-abundance cytokines. Pro-inflammatory interferon-γ and tumor necrosis factor-α markedly declined after treatment, whereas anti-inflammatory interleukin (IL)-4 and IL-10 slightly increased, with mild elevation of IL-2 and IL-1β; B: Variation of high-level pro-inflammatory cytokines IL-6 and IL-8: IL-6 decreased obviously, while IL-8 slightly rose within physiological range. X-axis: Baseline, post two cycles of combined therapy; Y-axis: Cytokine concentration (pg/mL). TNF-α: Tumor necrosis factor-α; IL: Interleukin; IFN-γ: Interferon-γ.
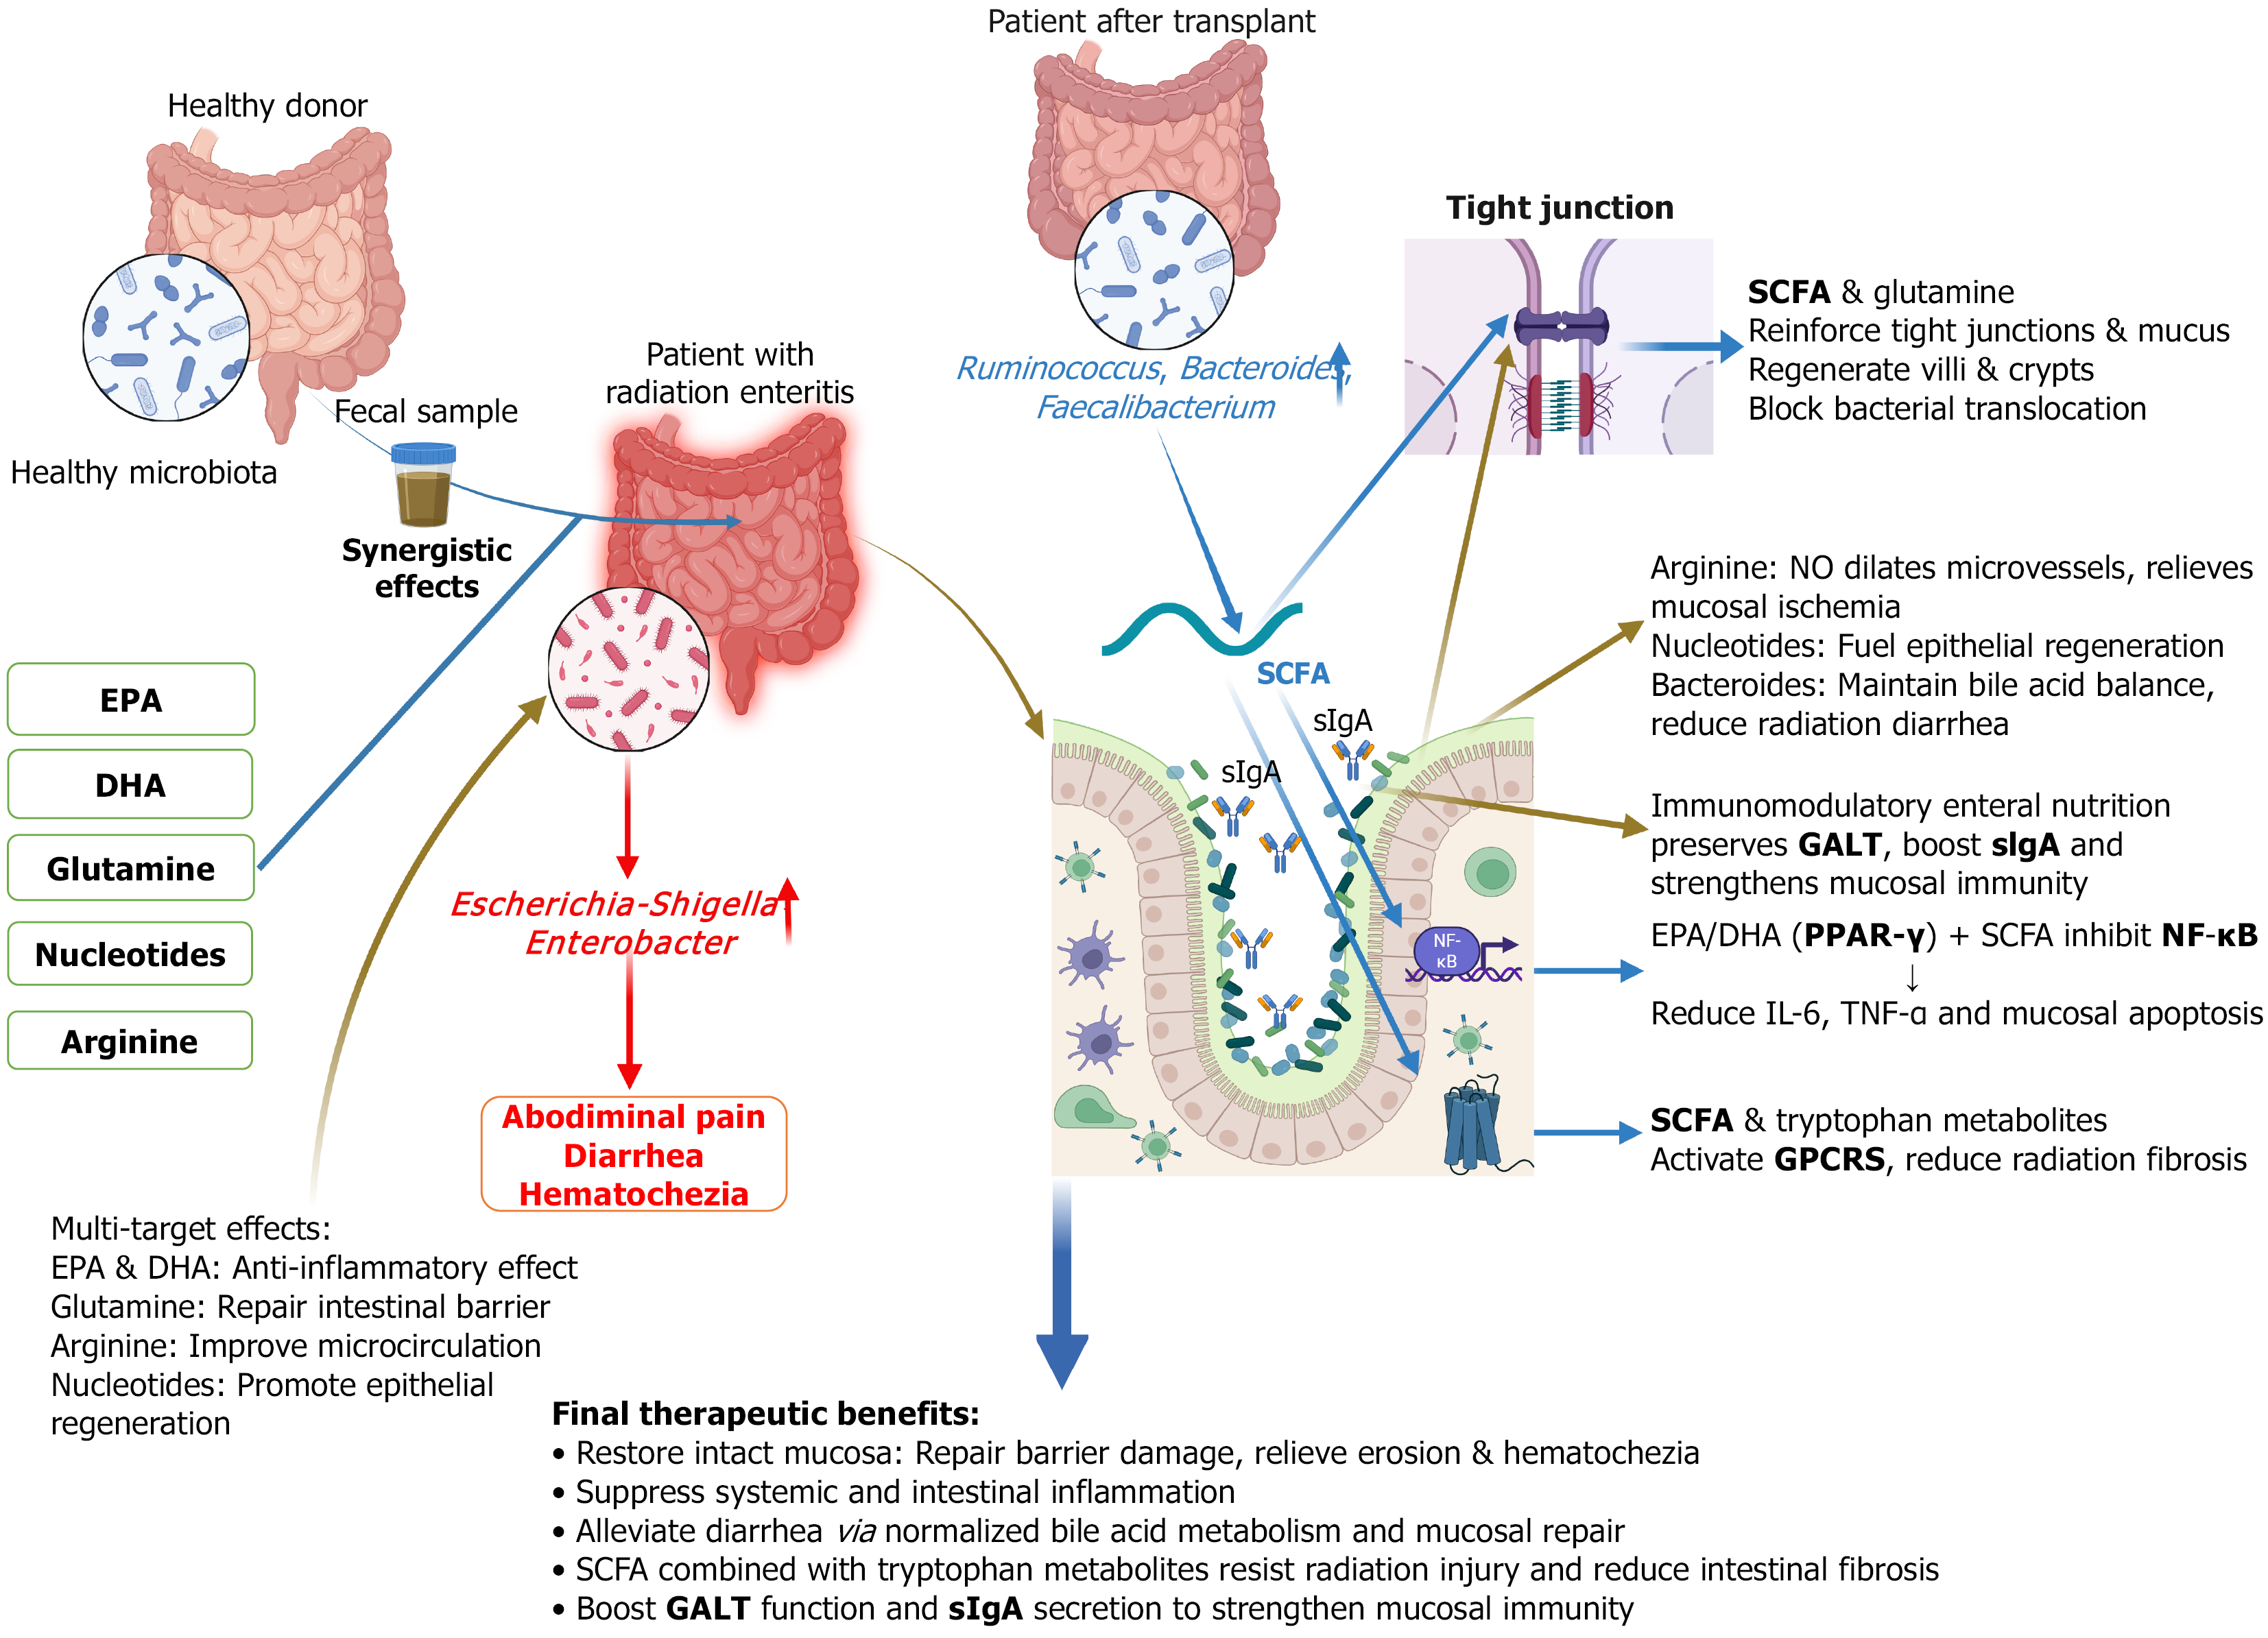
Figure 7 Schematic illustrating synergistic mechanisms of faecal microbiota transplantation plus immunomodulatory enteral nutrition against radiation enteritis.
Faecal microbiota transplantation remodels gut microbiota to enrich beneficial Ruminococcus, Bacteroides, Faecalibacterium, reduce pathogenic Escherichia-Shigella and Enterobacter, and boost intestinal short-chain fatty acid (SCFA) levels. EPA, DHA, glutamine, arginine and nucleotides exert multi-target protection. SCFAs combined with these nutrients strengthen tight junctions, suppress NF-κB-driven inflammation, activate GPCR signaling to mitigate intestinal fibrosis, and enhance mucosal immunity via elevated gut-associated lymphoid tissue activity and secretory IgA secretion. Combined therapy relieves abdominal pain, diarrhea and hematochezia, and restores intact intestinal mucosa. GALT: Gut-associated lymphoid tissue; sIgA: Secretory IgA.
- Citation: Huang T, He YL, Fu G, Chen L, Huang ST, Liu LP. Microbiota-nutrition sequential therapy for refractory radiation proctitis: A case report. World J Gastroenterol 2026; 32(44): 122438
- URL: https://www.wjgnet.com/1007-9327/full/v32/i44/122438.htm
- DOI: https://dx.doi.org/10.3748/wjg.122438