
















Copyright: ©Author(s) 2026.
World J Gastroenterol. Nov 28, 2026; 32(44): 122438
Published online Nov 28, 2026. doi: 10.3748/wjg.122438
Published online Nov 28, 2026. doi: 10.3748/wjg.122438
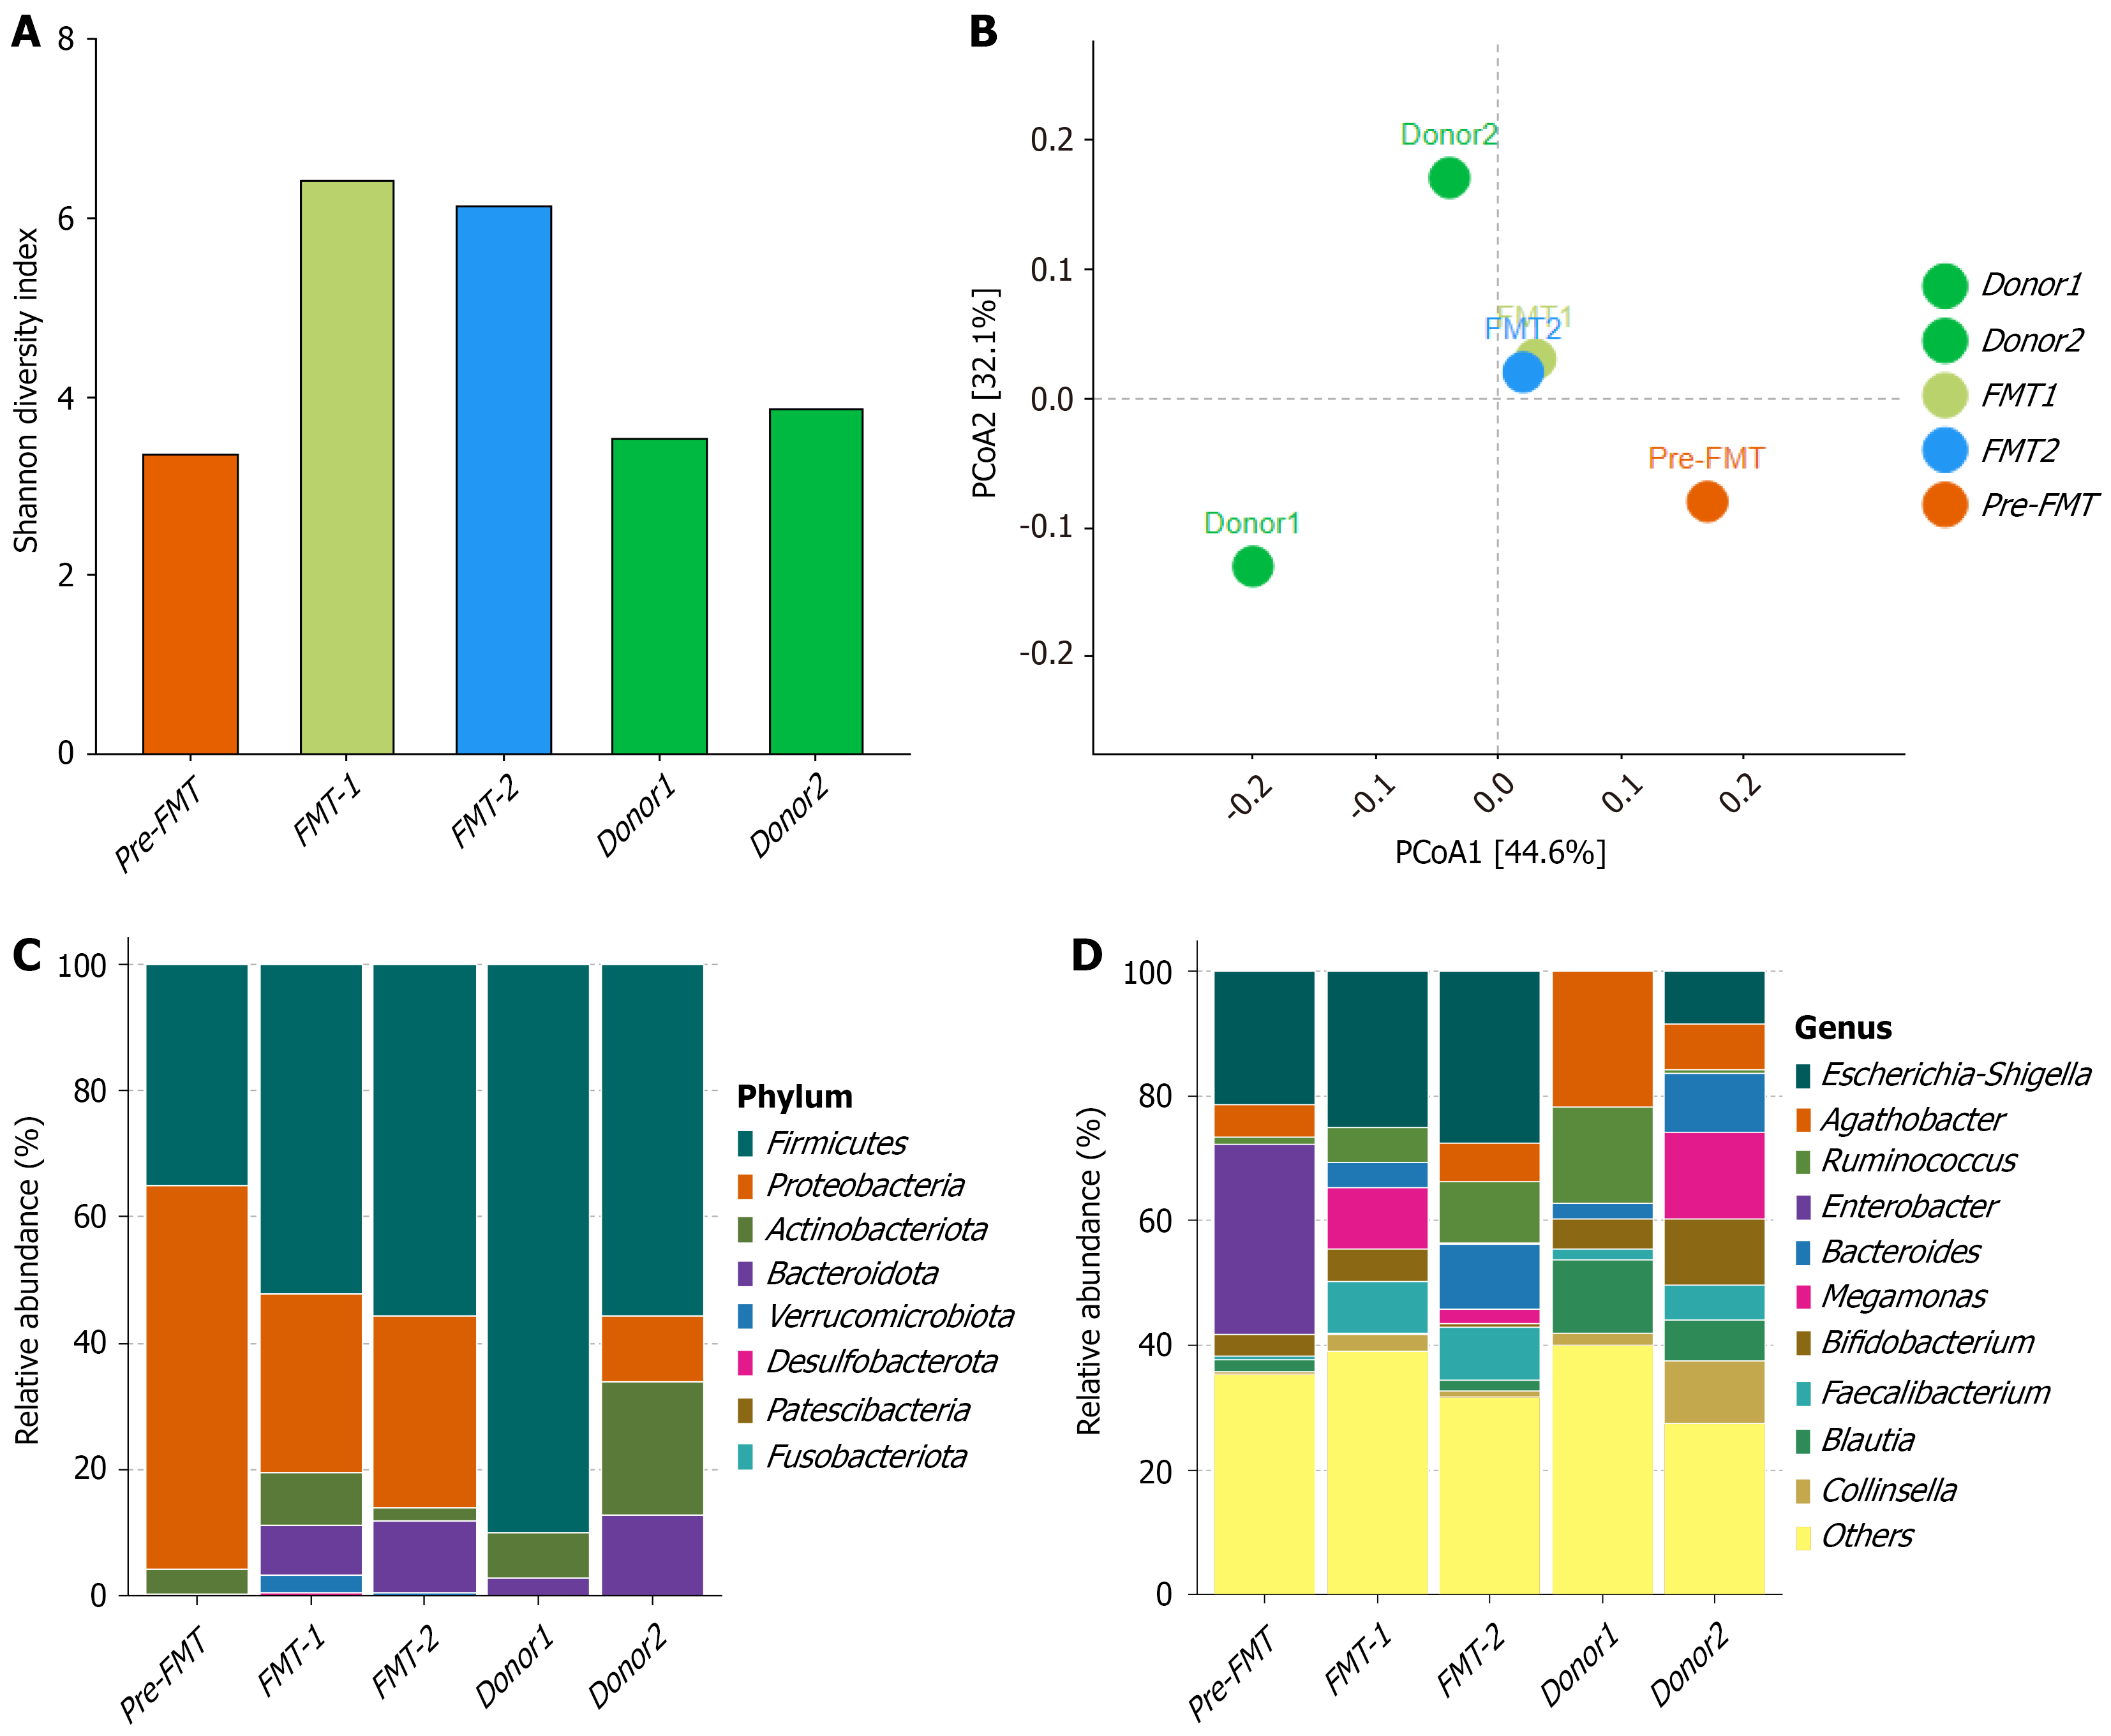
Figure 3 Microbiome analysis of the patient before and after sequential fecal microbiota transplantation.
A: α-diversity represented by the Shannon diversity index, showing changes in gut microbial richness across pre-fecal microbiota transplantation (FMT), FMT-1, FMT-2, and donor samples; B: β-diversity analyzed via principal coordinates analysis, illustrating dissimilarities in microbial community structure; C: Taxonomic classification of gut microbiota at the phylum level; D: Taxonomic classification of gut microbiota at the genus level. pre-FMT: Baseline before FMT; FMT-1: 1 month after the first FMT; FMT-2: 2 months after the second FMT; PCoA: Principal coordinates analysis; Donor1/Donor2: Fecal microbiota donors.
- Citation: Huang T, He YL, Fu G, Chen L, Huang ST, Liu LP. Microbiota-nutrition sequential therapy for refractory radiation proctitis: A case report. World J Gastroenterol 2026; 32(44): 122438
- URL: https://www.wjgnet.com/1007-9327/full/v32/i44/122438.htm
- DOI: https://dx.doi.org/10.3748/wjg.122438