
















Copyright: ©Author(s) 2026.
World J Gastroenterol. Sep 28, 2026; 32(36): 119990
Published online Sep 28, 2026. doi: 10.3748/wjg.119990
Published online Sep 28, 2026. doi: 10.3748/wjg.119990
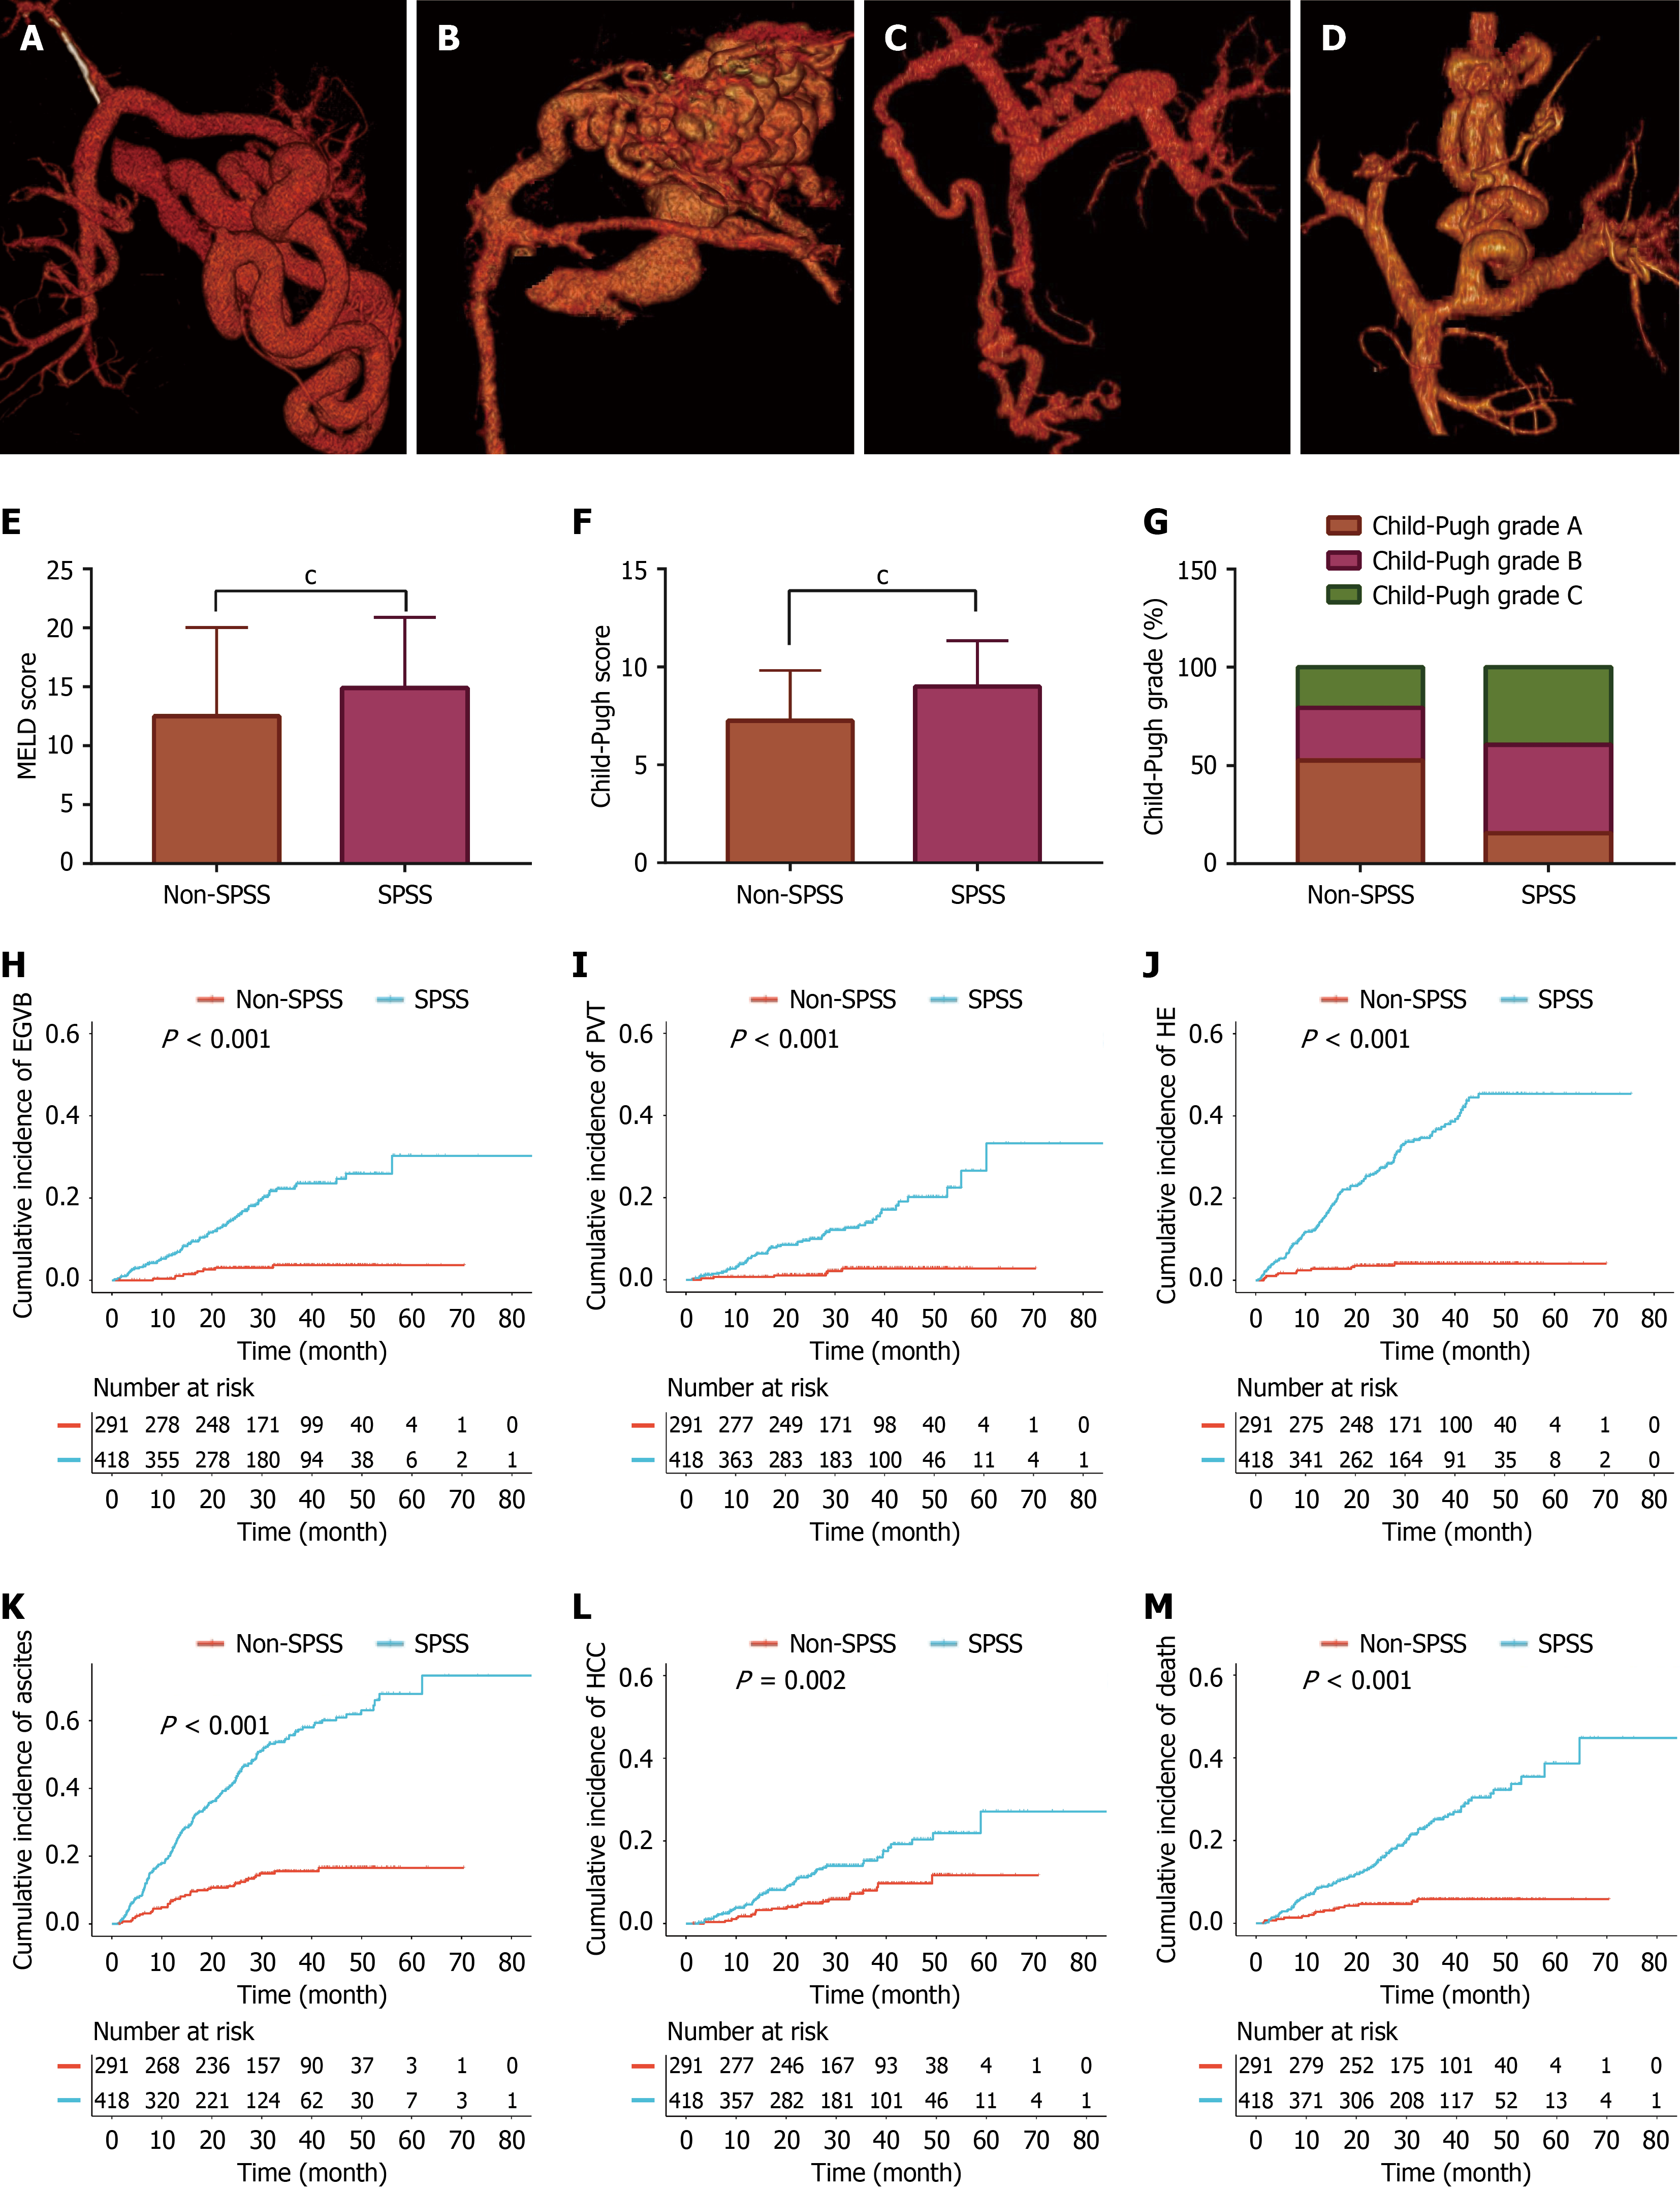
Figure 1 Higher incidence of decompensation and mortality in cirrhotic patients with spontaneous portosystemic shunts.
A: Representative imaging of splenorenal shunt; B: Representative imaging of gastrorenal shunt; C: Representative imaging of umbilical vein recanalization; D: Representative imaging of left gastric-azygos/hemiazygos vein shunt; E: Model for End-stage Liver Disease score in the spontaneous portosystemic shunts (SPSS) and non-SPSS groups at baseline; F: Child-Pugh score in the SPSS and non-SPSS groups at baseline; G: Child-Pugh grade in the SPSS and non-SPSS groups at baseline; H: Cumulative incidence of esophagogastric variceal bleeding during follow-up; I: Cumulative incidence of portal vein thrombosis during follow-up; J: Cumulative incidence of hepatic encephalopathy during follow-up; K: Cumulative incidence of ascites during follow-up; L: Cumulative incidence of hepatocellular carcinoma during follow-up; M: Cumulative incidence of mortality during follow-up. MELD: Model for End-stage Liver Disease; EGVB: Esophagogastric variceal bleeding; SPSS: Spontaneous portosystemic shunts.
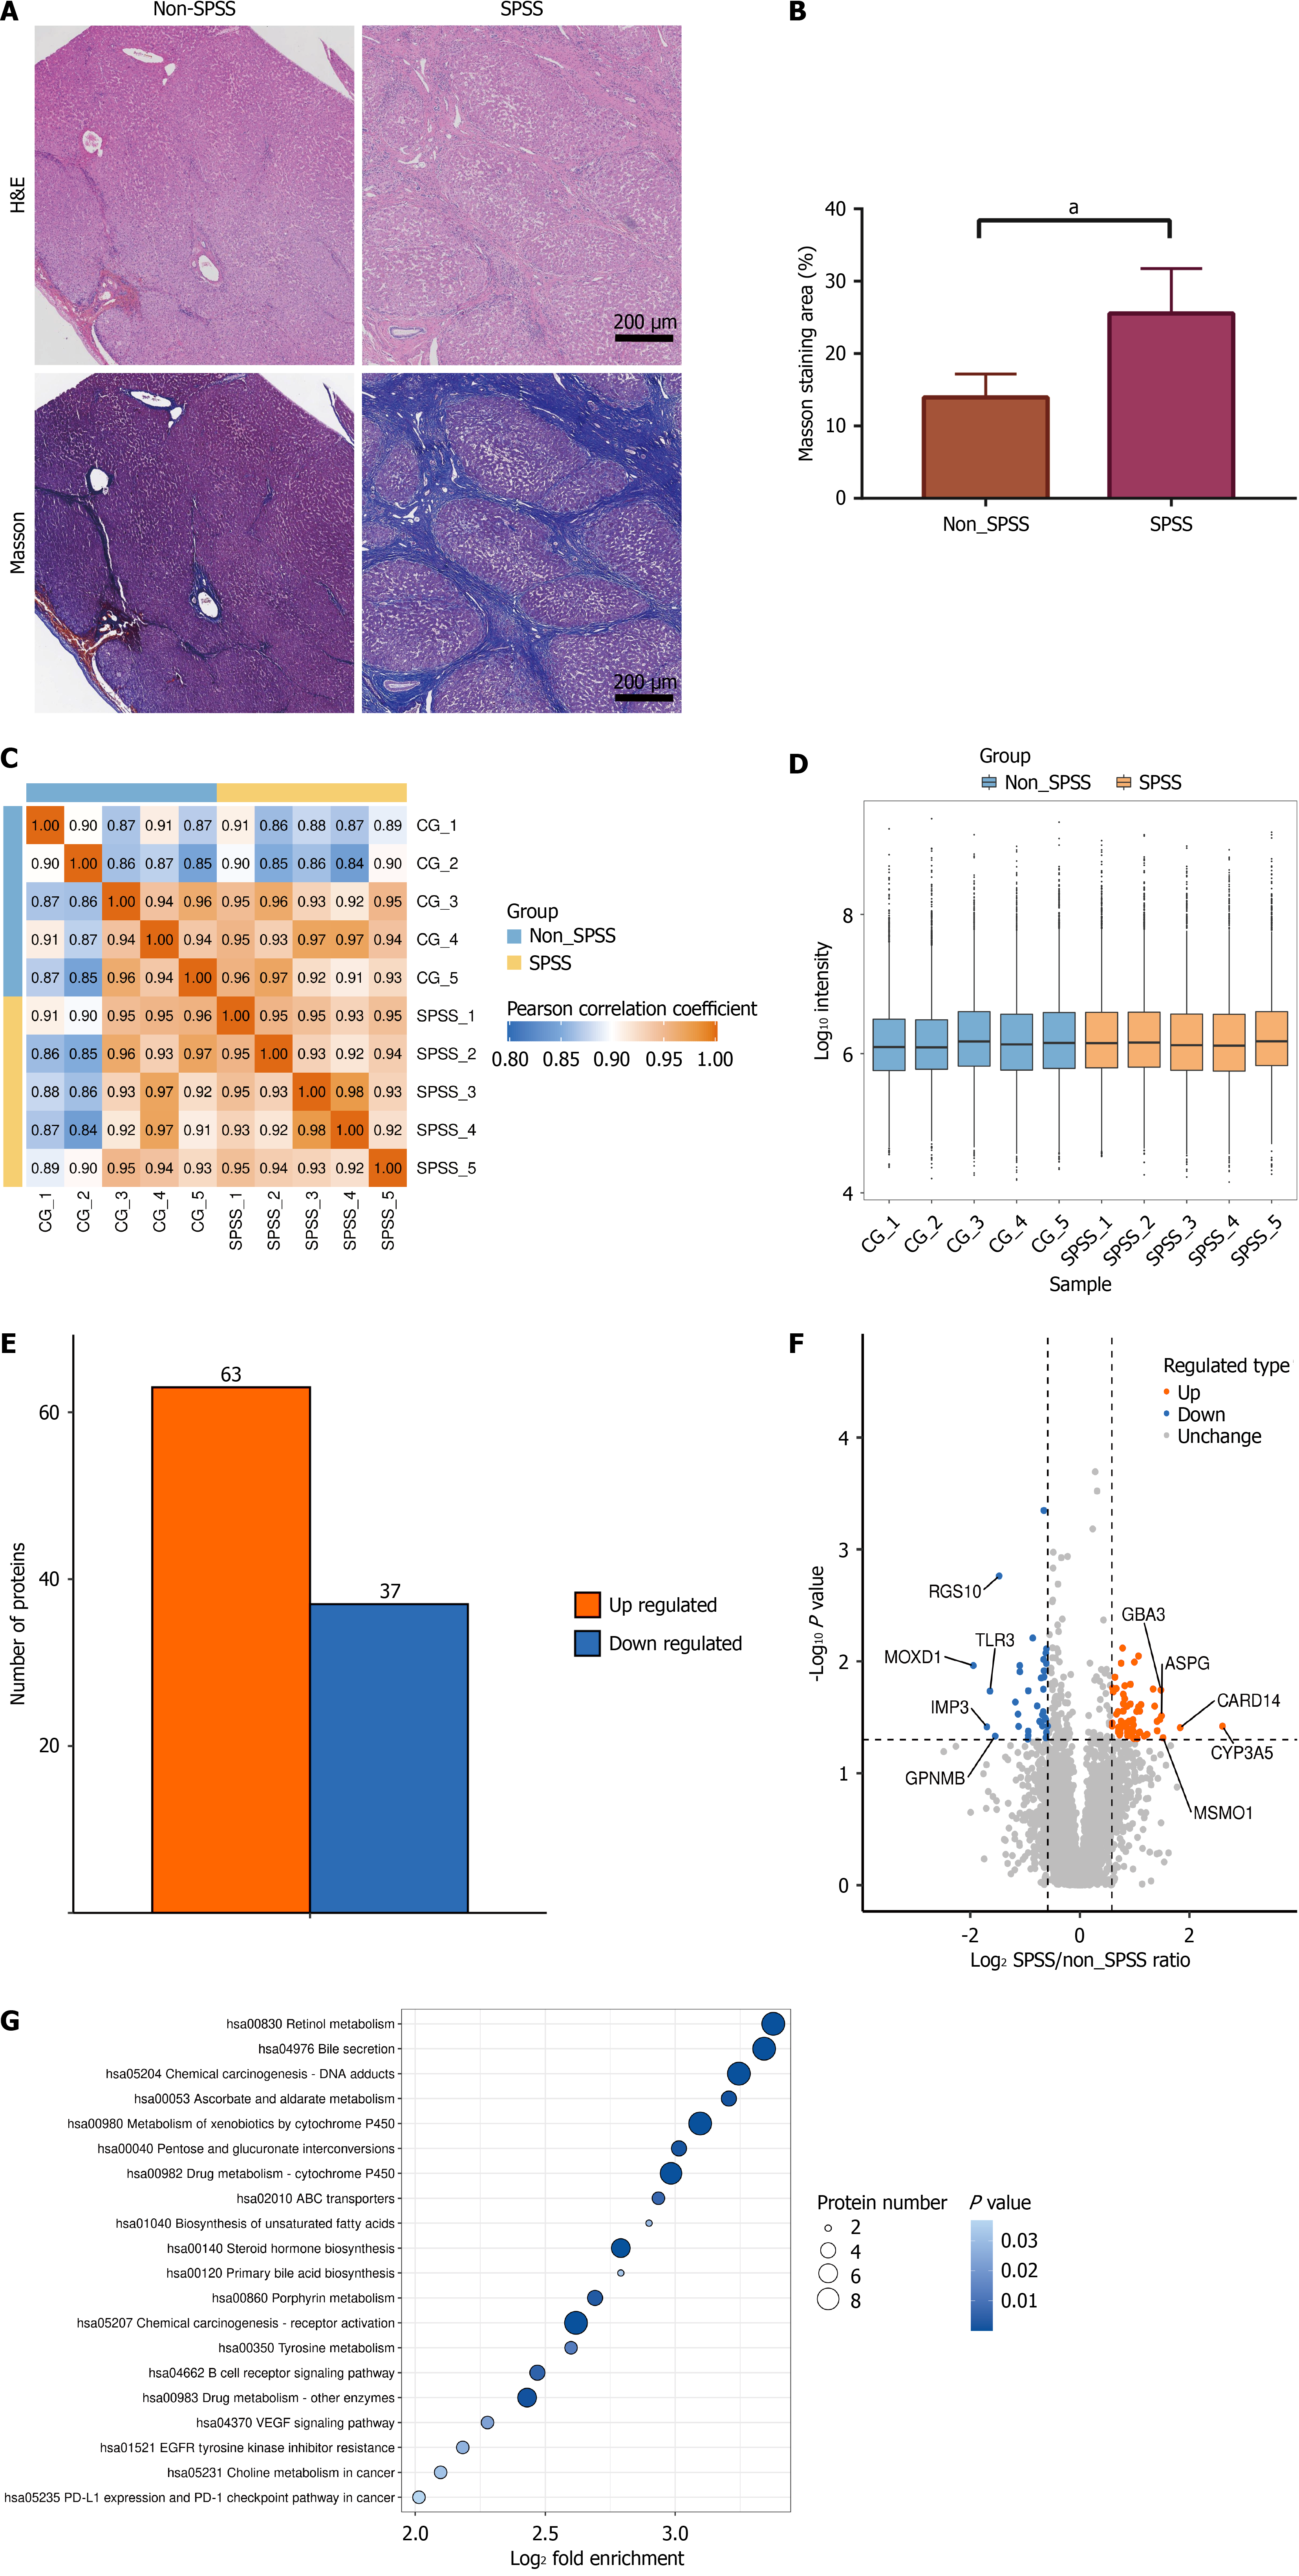
Figure 2 Proteomic profiling reveals mechanisms underlying spontaneous portosystemic shunts formation.
A: Representative histological changes in patients undergoing proteomic analysis; B: Quantification of Masson-stained collagen (data are presented as mean ± SD, n = 5 per group); C: Pearson correlation analysis of proteomic data; D: Distribution of protein intensity values; E: Number of differential proteins between the spontaneous portosystemic shunts (SPSS) and non-SPSS groups; F: Volcano plot of differential proteins; G: Kyoto Encyclopedia of Genes and Genomes pathway enrichment analysis of differential proteins. aP < 0.01. H&E: Hematoxylin and eosin; SPSS: Spontaneous portosystemic shunts.
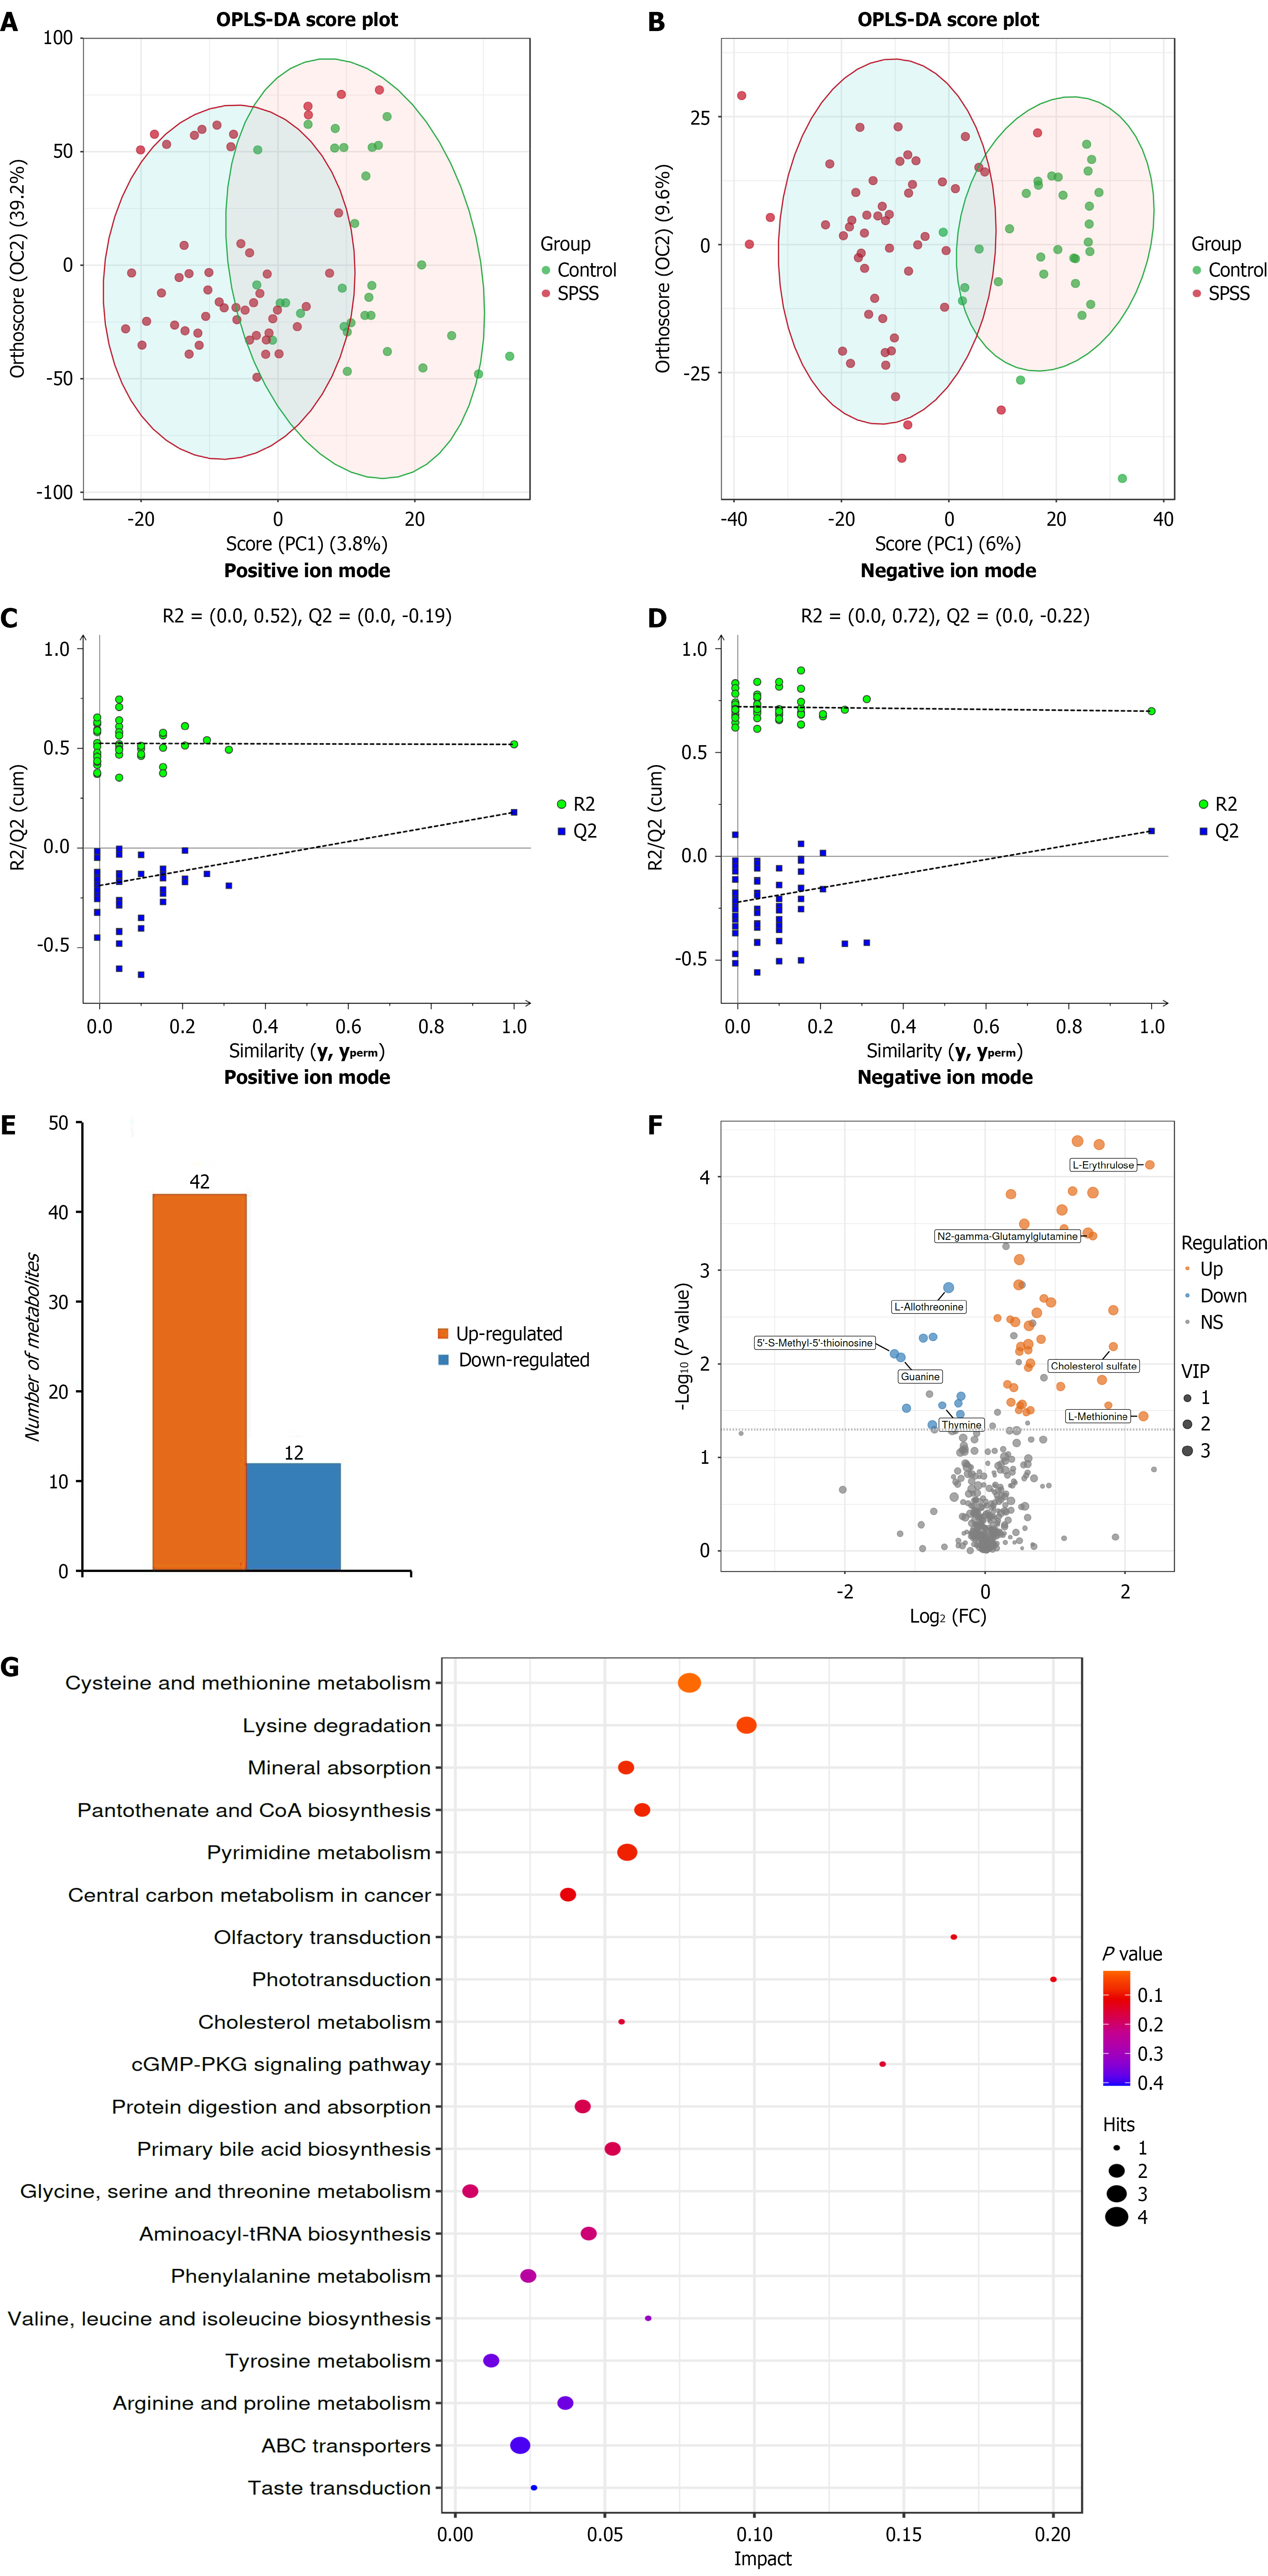
Figure 3 Metabolomic profiling identifies dysregulated pathways associated with spontaneous portosystemic shunts.
A and B: Permutation tests in positive and negative ion modes; C and D: Orthogonal Partial Least Squares Discriminant Analysis score plots in positive and negative ion modes; E: Number of differential metabolites between spontaneous portosystemic shunts (SPSS) and non-SPSS groups; F: Volcano plot of differential metabolites; G: Kyoto Encyclopedia of Genes and Genomes pathway enrichment analysis. OPLS-DA: Orthogonal Partial Least Squares Discriminant Analysis; FC: Fold change; SPSS: Spontaneous portosystemic shunts.
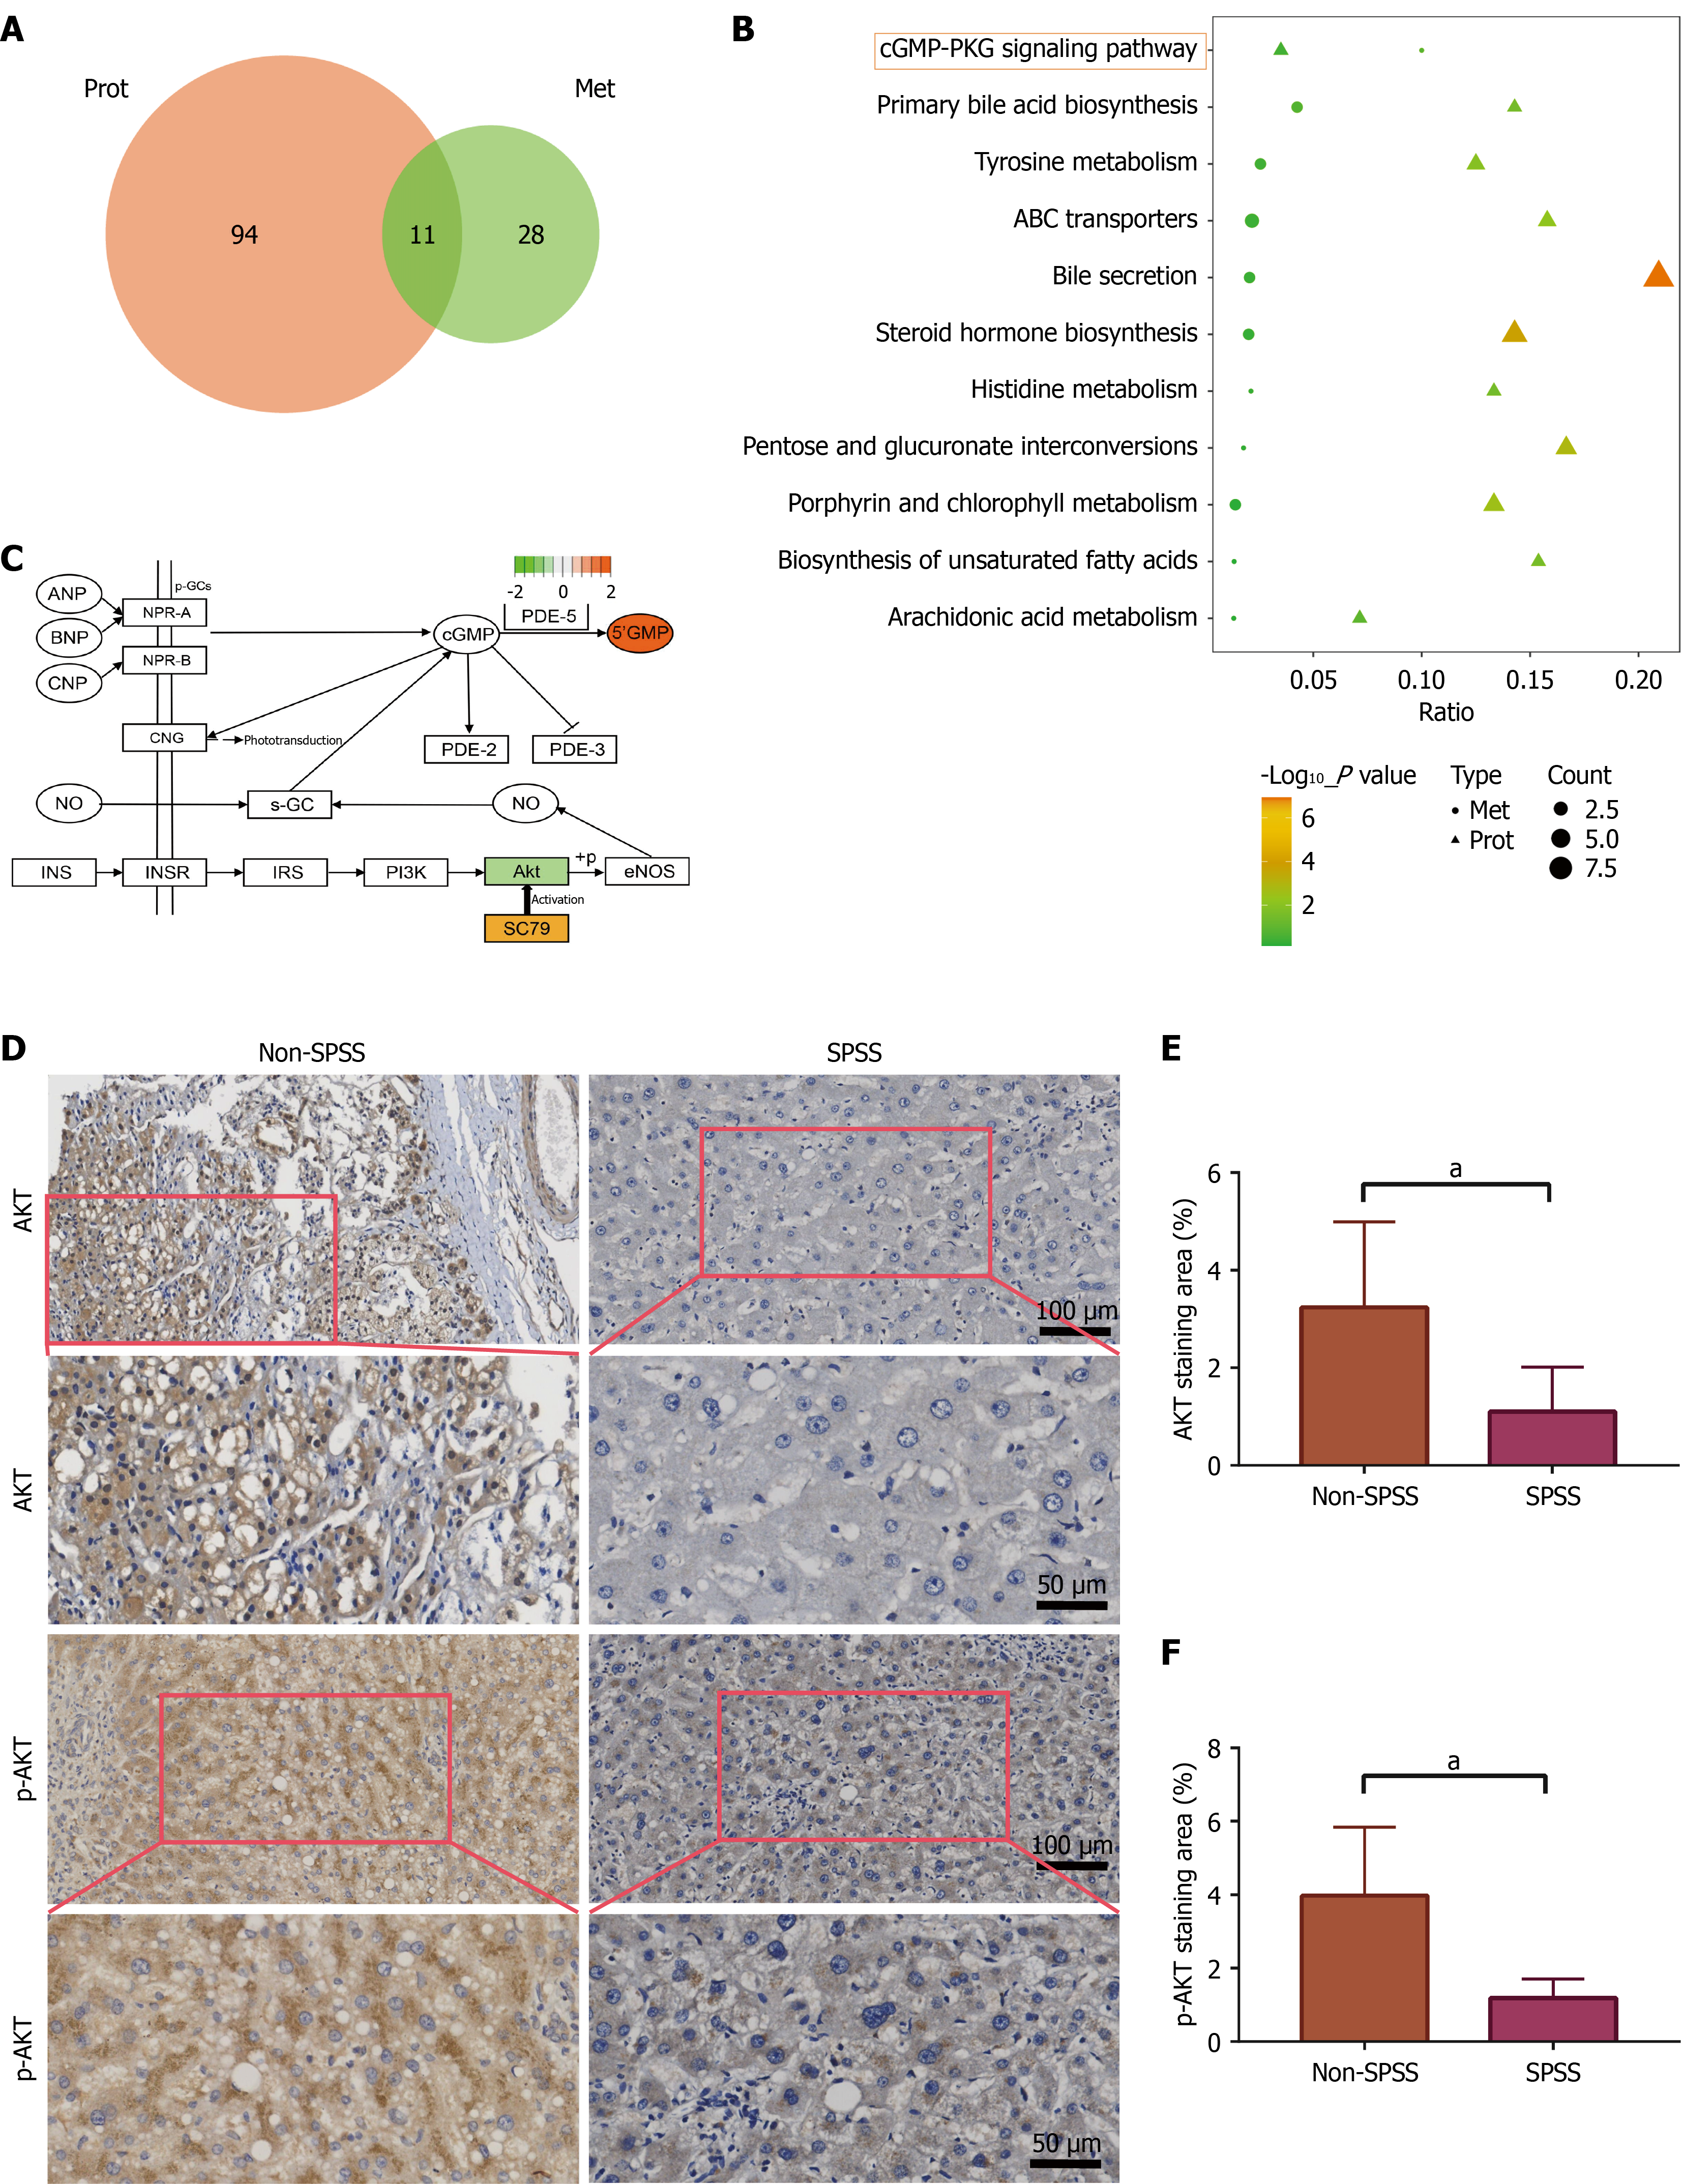
Figure 4 Integrated proteomic and metabolomic analysis highlights key pathways in spontaneous portosystemic shunts.
A: Venn diagram of common Kyoto Encyclopedia of Genes and Genomes (KEGG) pathways enriched in both proteomics and metabolomics; B: Bubble plot of common KEGG pathways enriched in both proteomics and metabolomics; C: Enrichment analysis of the cGMP-PKG pathway; D: Immunohistochemical staining of AKT and p-AKT in liver tissues; E: Quantification of AKT staining; F: Quantification of p-AKT staining. Data are presented as mean ± SD (n = 5 per group). aP < 0.05. NO: Nitric oxide; SPSS: Spontaneous portosystemic shunts.
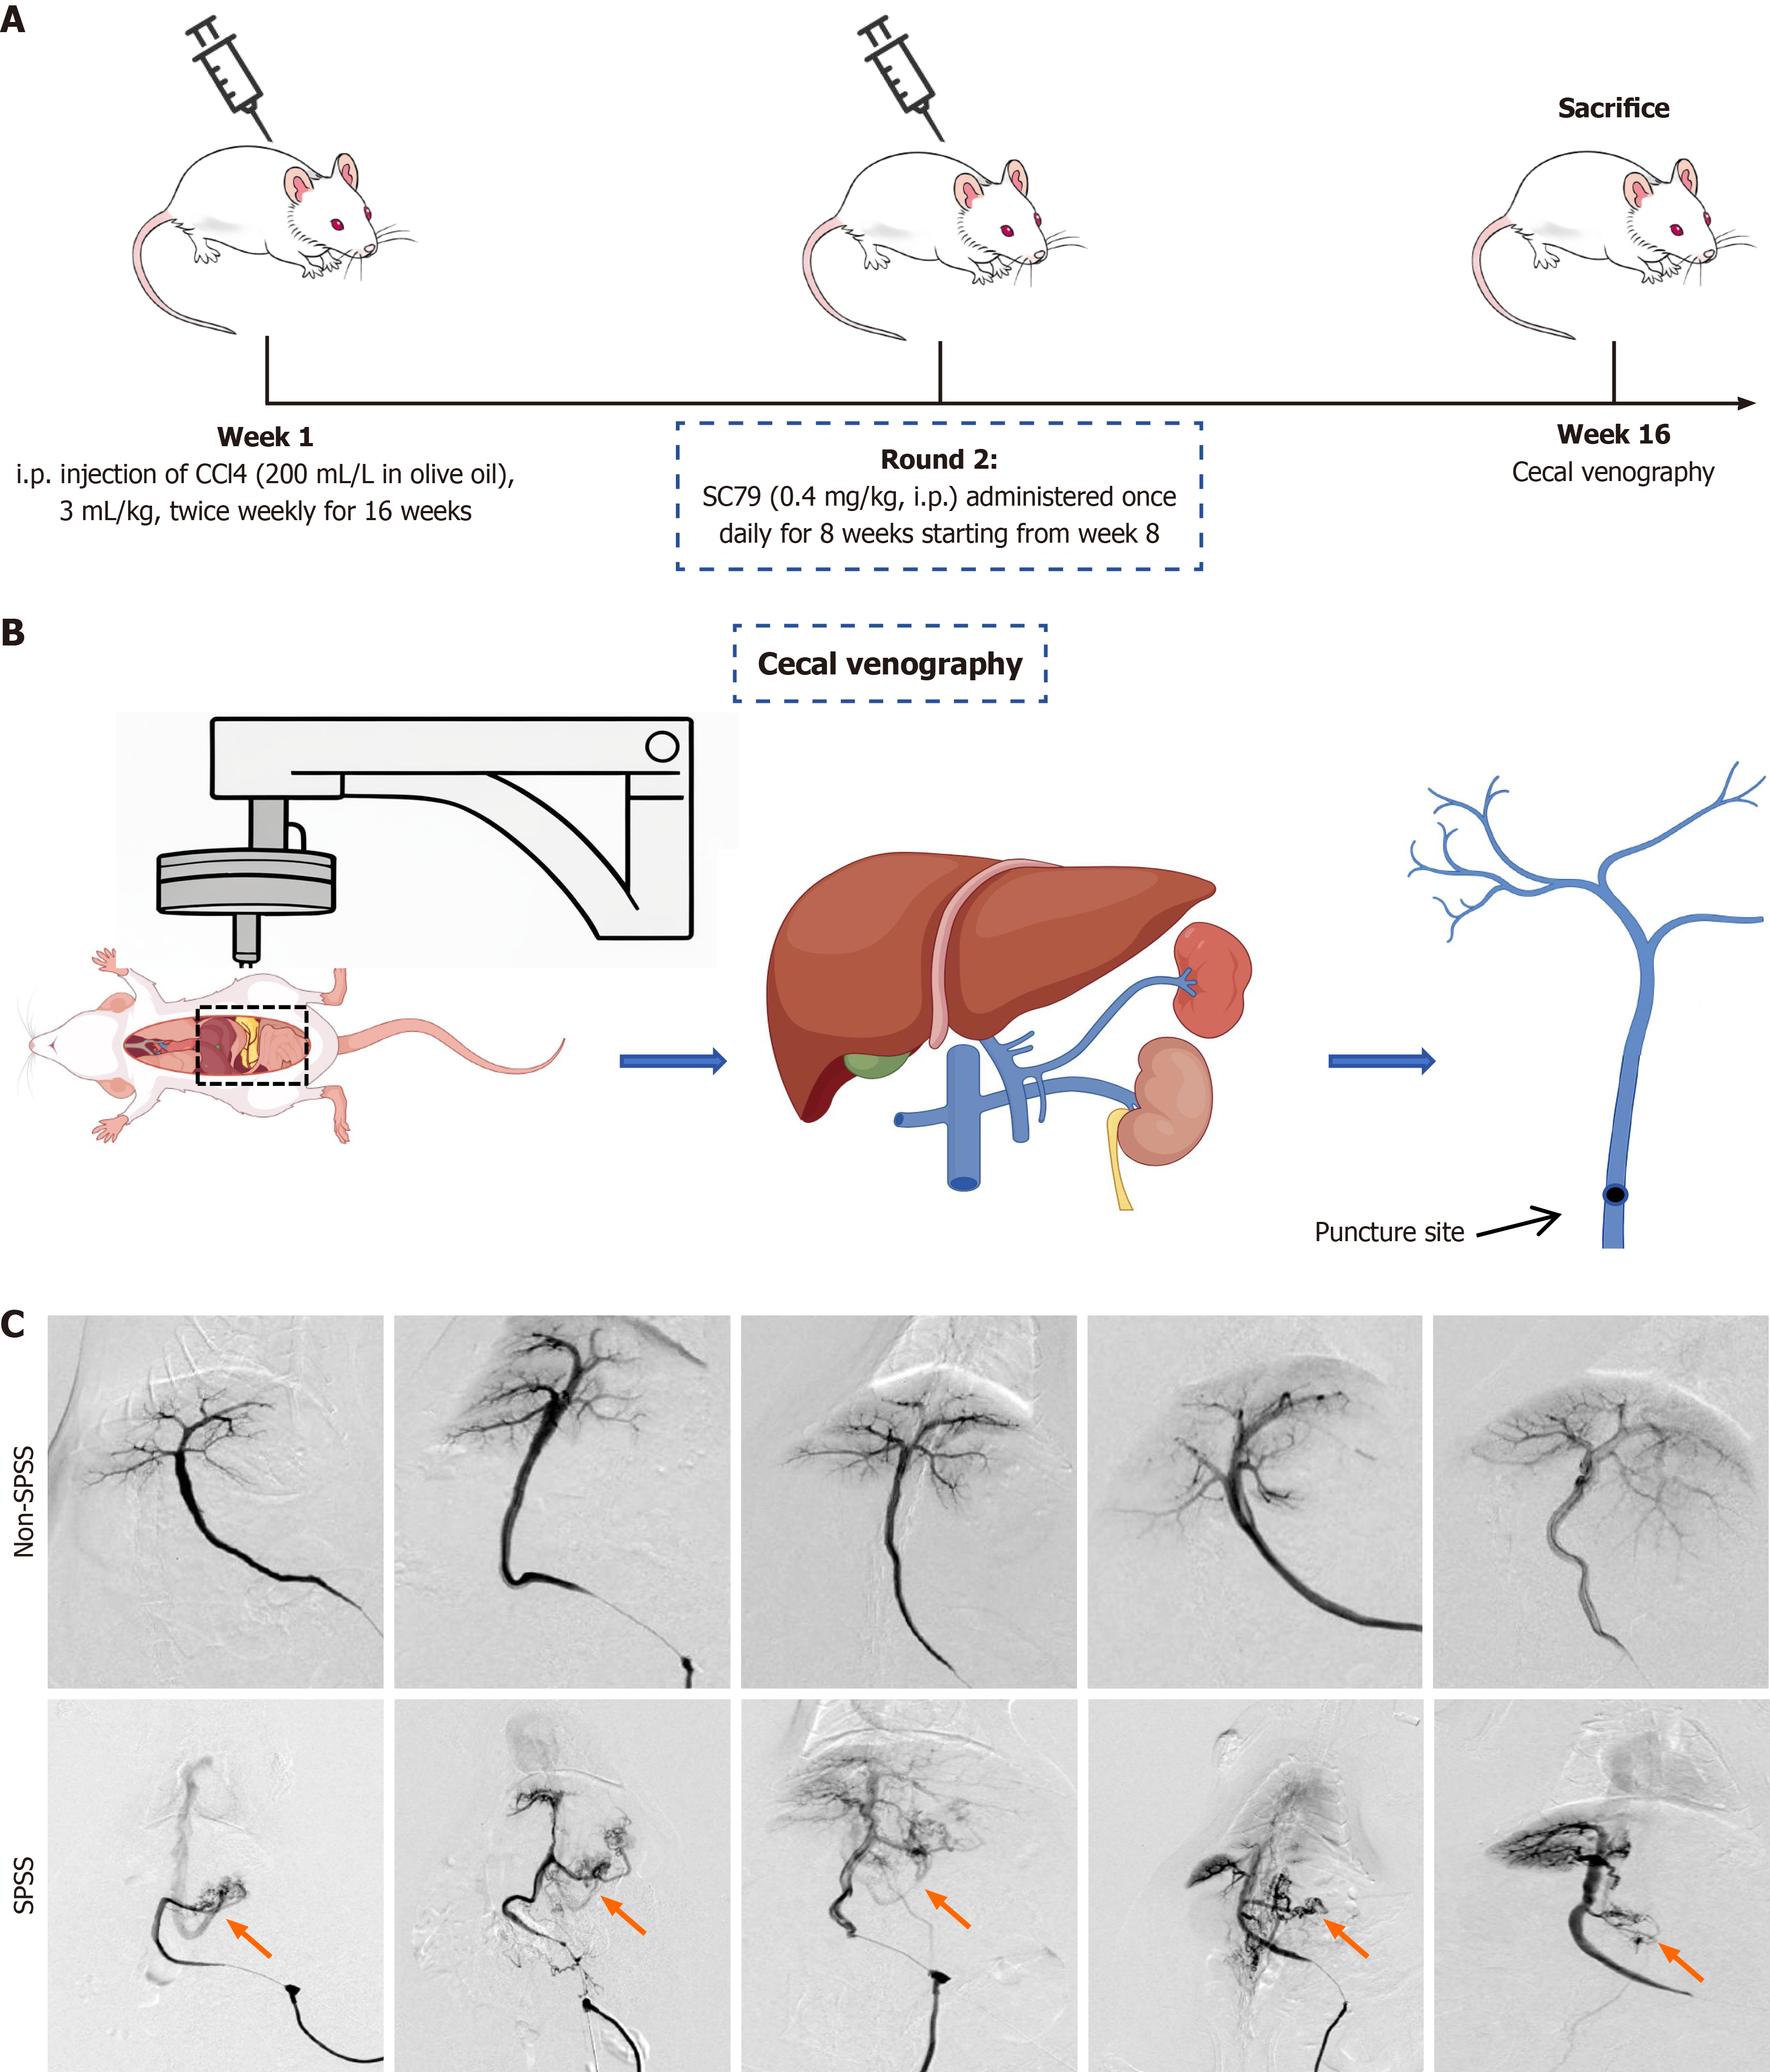
Figure 5 Animal models of spontaneous portosystemic shunts and cecal venography.
A: Experimental design of cirrhosis induction and SC79 treatment; B: Schematic diagram of cecal venography and the portal venous system; C: Representative venography images showing splenorenal shunts (orange arrows). SPSS: Spontaneous portosystemic shunts; i.p.: Intraperitoneal.
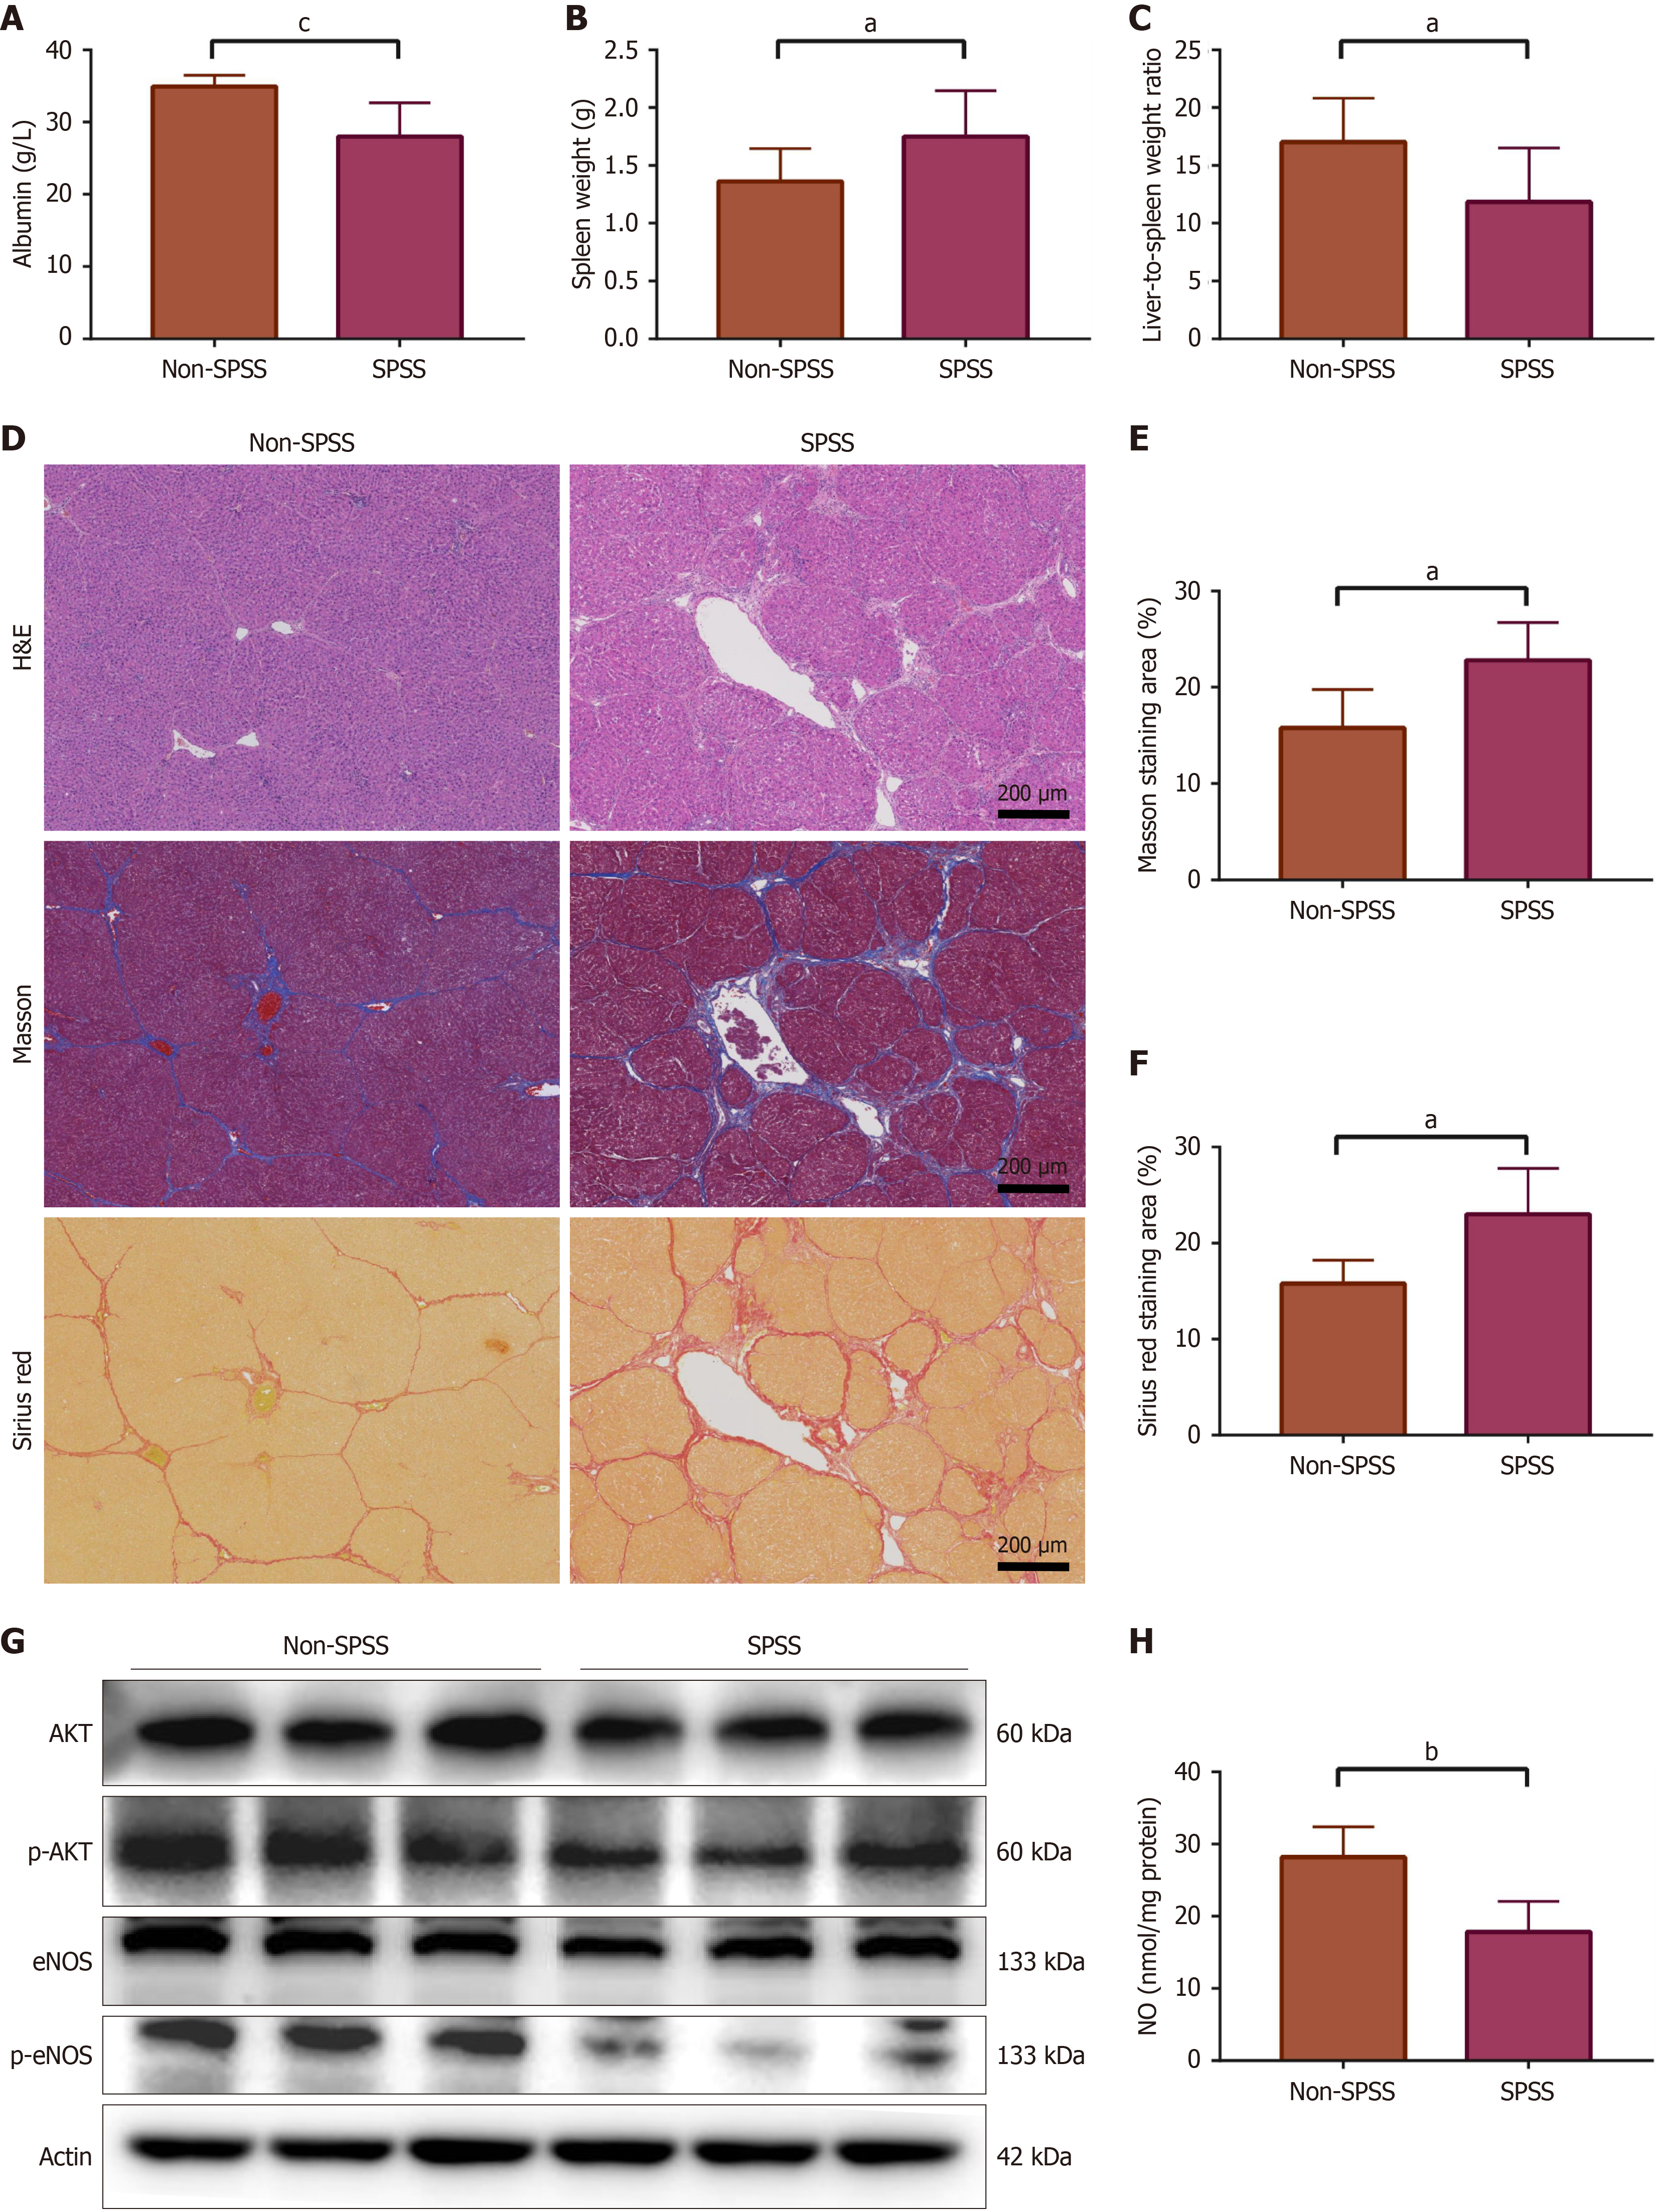
Figure 6 In vivo validation of AKT-eNOS-nitric oxide signalling.
A: Serum albumin in spontaneous portosystemic shunts (SPSS) and non-SPSS rats; B: Spleen weight in SPSS and non-SPSS rats; C: Liver-to-spleen weight ratio in SPSS and non-SPSS rats; D: Representative hematoxylin and eosin, Masson, and Sirius red staining of liver tissues; E: Quantification of Masson staining; F: Quantification of Sirius red staining; G: Expression of AKT, p-AKT, eNOS, and p-eNOS in liver tissues; H: Hepatic nitric oxide levels. Data are presented as mean ± SD (n = 5 per group). aP < 0.05; bP < 0.01; cP < 0.001. H&E: Hematoxylin and eosin; NO: Nitric oxide; SPSS: Spontaneous portosystemic shunts.
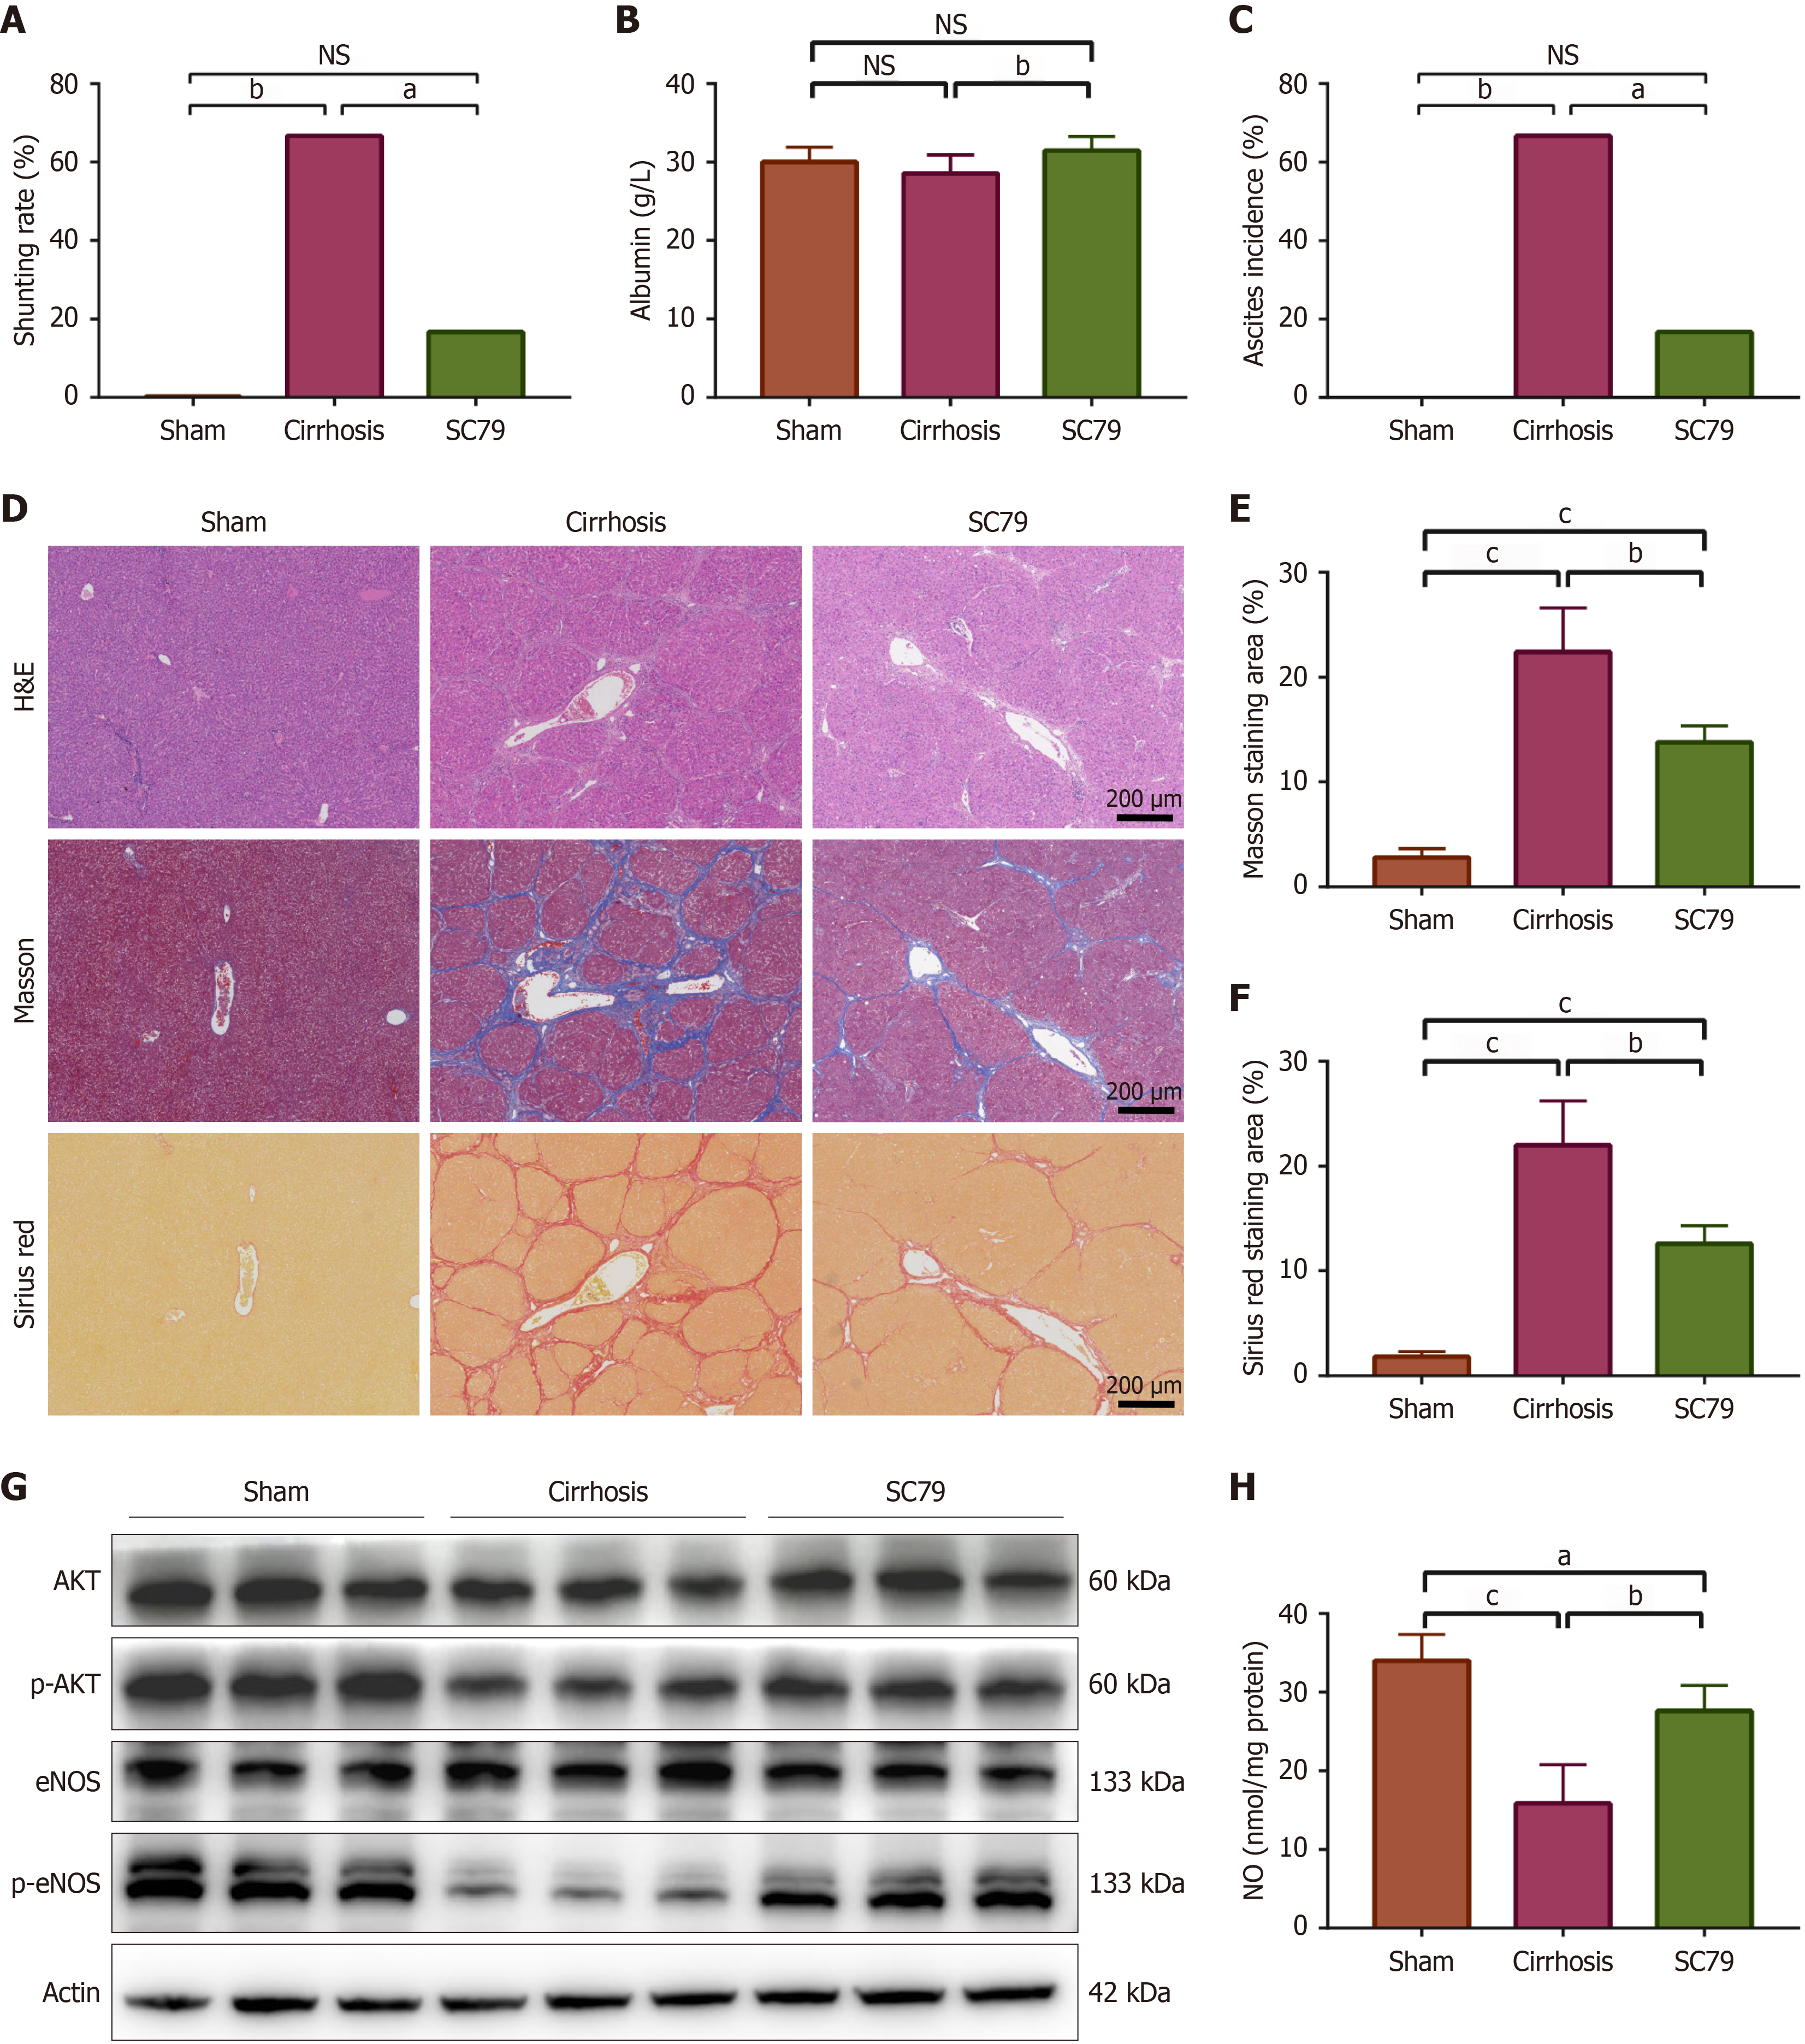
Figure 7 SC79 treatment ameliorates cirrhosis and reduces spontaneous portosystemic shunts in vivo.
A: Incidence of spontaneous portosystemic shunts in sham, cirrhosis, and SC79-treated groups; B: Serum albumin; C: Ascites incidence; D: Representative liver histology by hematoxylin and eosin, Masson, and Sirius red staining; E: Quantification of Masson staining; F: Quantification of Sirius red staining; G: Expression of AKT, p-AKT, eNOS, and p-eNOS; H: Hepatic nitric oxide levels. Data are showed as mean ± SD (n = 5 per group). aP < 0.05; bP < 0.01; cP < 0.001. NS: Not significant; H&E: Hematoxylin and eosin; NO: Nitric oxide.
- Citation: Ke Q, Guo ZT, He J, Huang XH, Lei XJ, Zhuang QY, Zhou Y, Li L, Wang YC, Liu JF, Guo WH. AKT-eNOS-NO pathway mediates spontaneous portosystemic shunts and therapeutic efficacy of SC79 in cirrhosis. World J Gastroenterol 2026; 32(36): 119990
- URL: https://www.wjgnet.com/1007-9327/full/v32/i36/119990.htm
- DOI: https://dx.doi.org/10.3748/wjg.119990