
















Copyright: ©Author(s) 2026.
World J Gastroenterol. Sep 28, 2026; 32(36): 119990
Published online Sep 28, 2026. doi: 10.3748/wjg.119990
Published online Sep 28, 2026. doi: 10.3748/wjg.119990
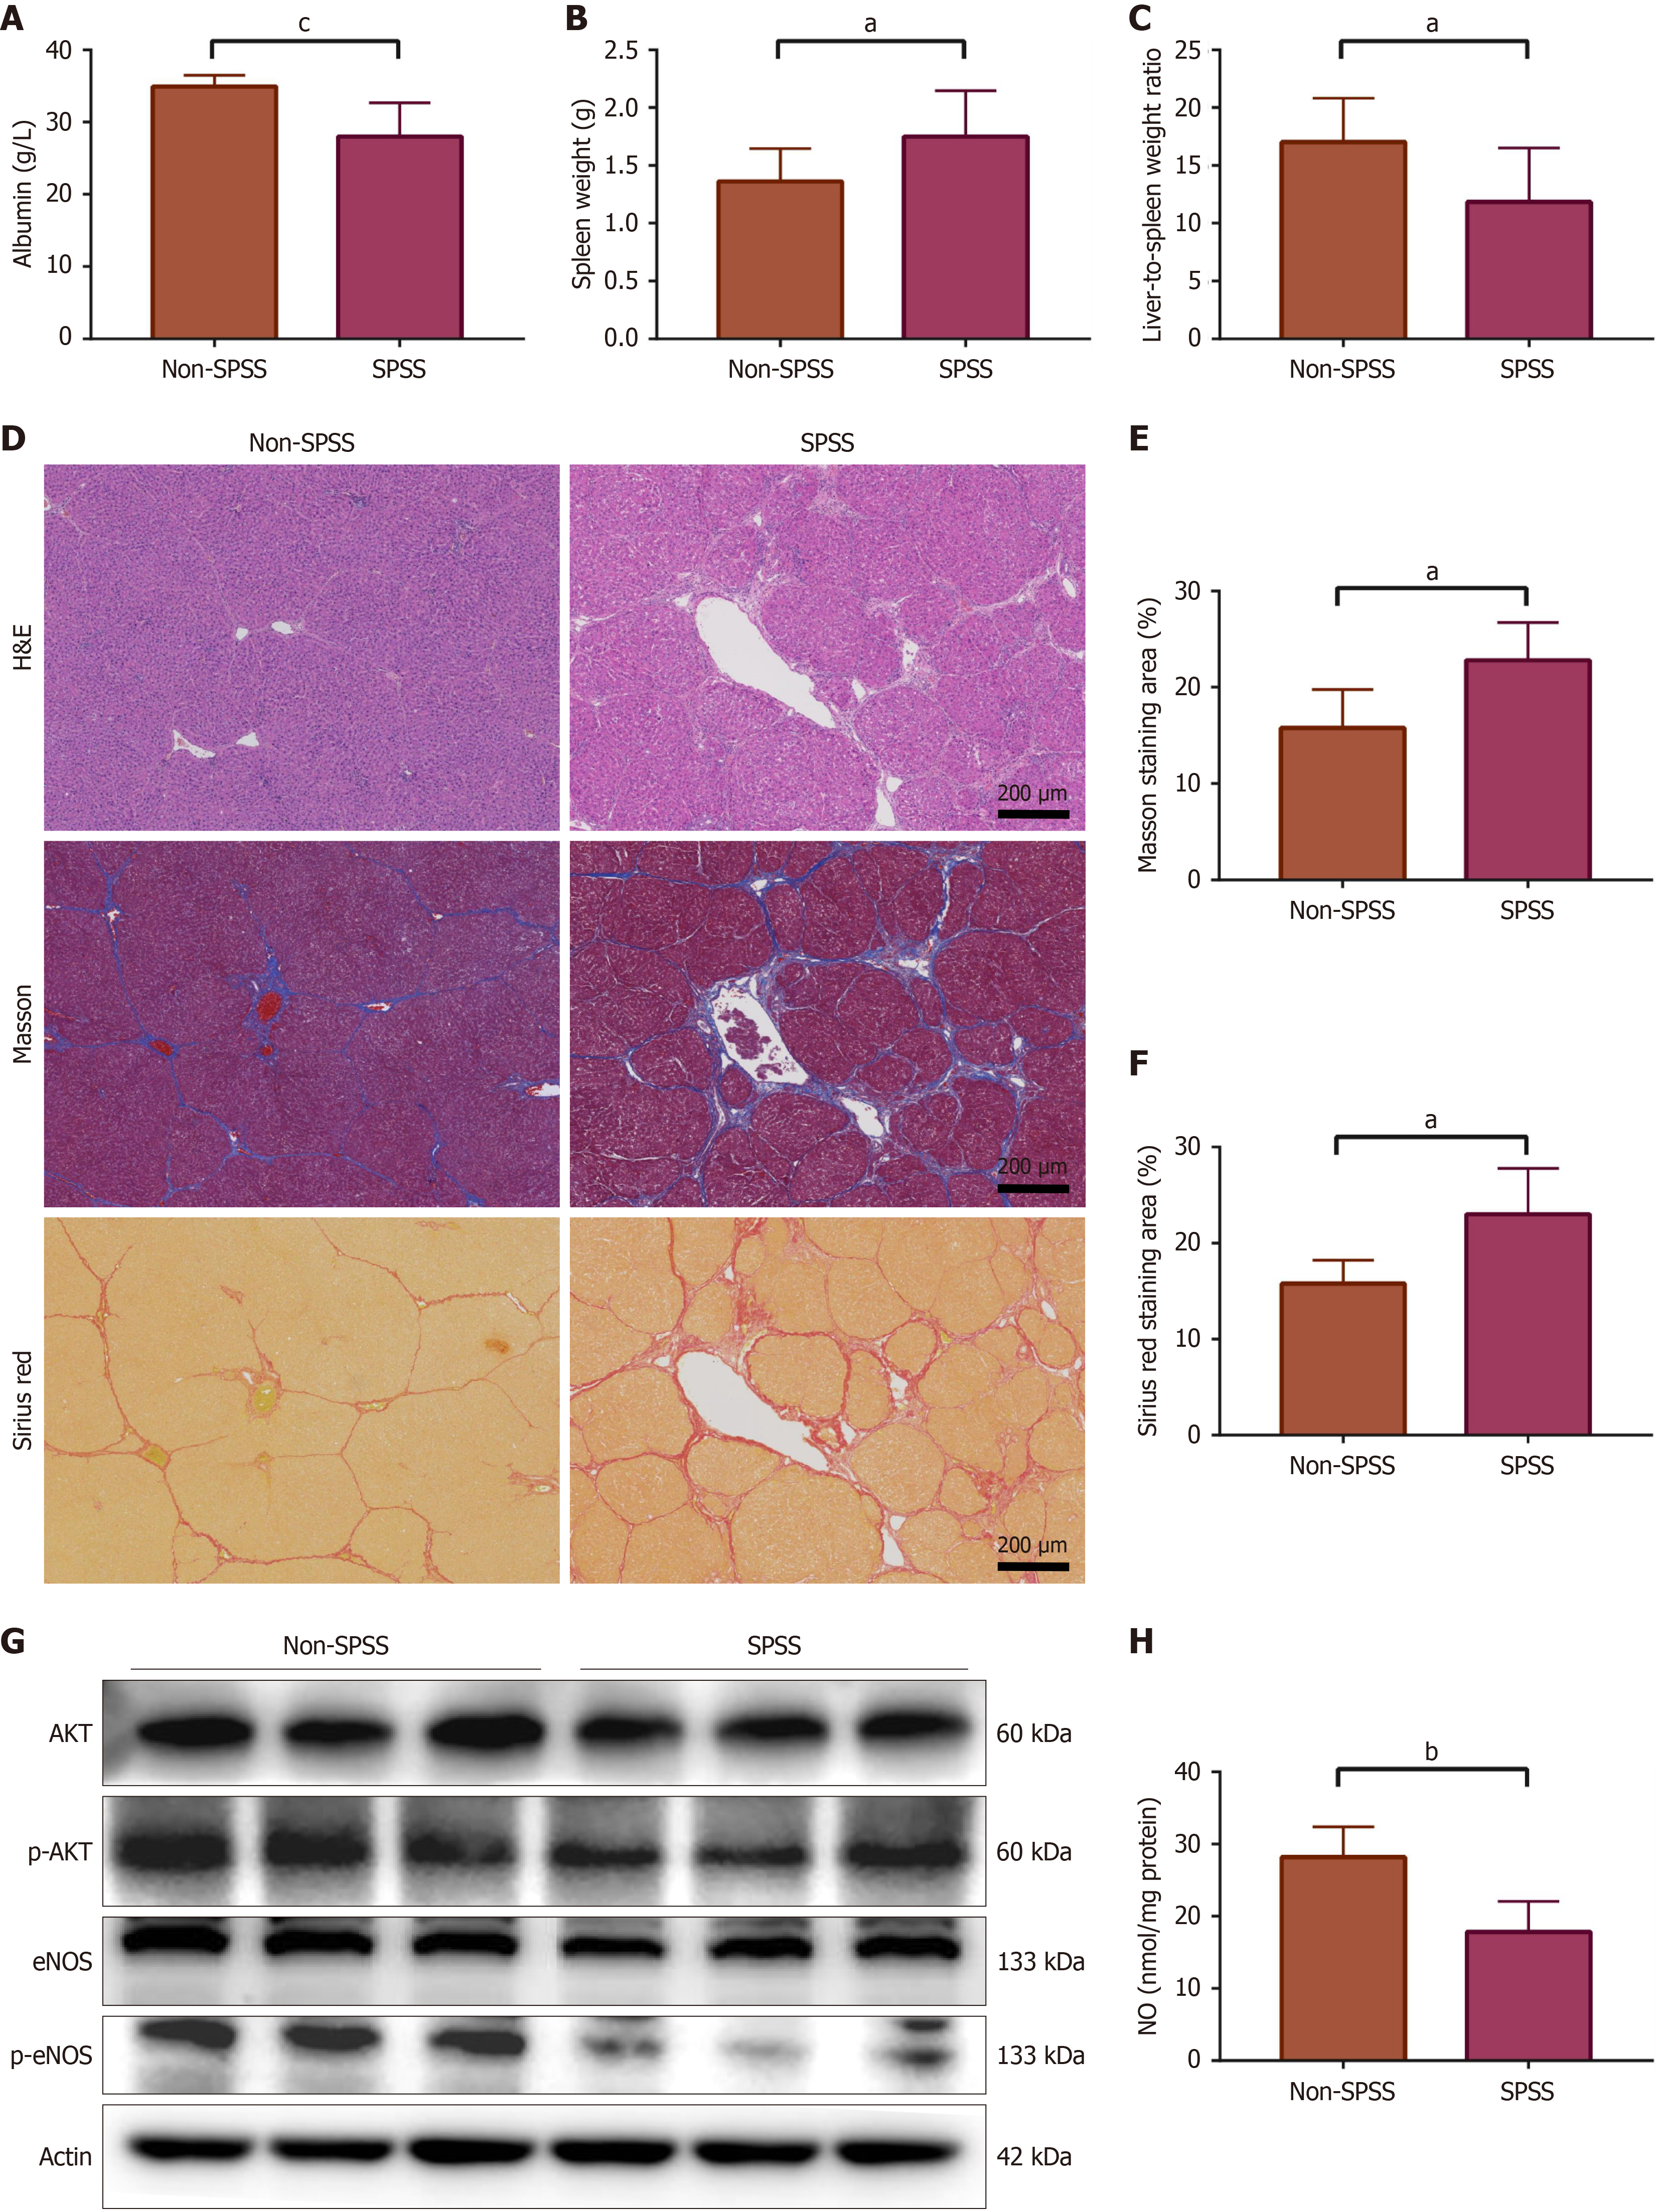
Figure 6 In vivo validation of AKT-eNOS-nitric oxide signalling.
A: Serum albumin in spontaneous portosystemic shunts (SPSS) and non-SPSS rats; B: Spleen weight in SPSS and non-SPSS rats; C: Liver-to-spleen weight ratio in SPSS and non-SPSS rats; D: Representative hematoxylin and eosin, Masson, and Sirius red staining of liver tissues; E: Quantification of Masson staining; F: Quantification of Sirius red staining; G: Expression of AKT, p-AKT, eNOS, and p-eNOS in liver tissues; H: Hepatic nitric oxide levels. Data are presented as mean ± SD (n = 5 per group). aP < 0.05; bP < 0.01; cP < 0.001. H&E: Hematoxylin and eosin; NO: Nitric oxide; SPSS: Spontaneous portosystemic shunts.
- Citation: Ke Q, Guo ZT, He J, Huang XH, Lei XJ, Zhuang QY, Zhou Y, Li L, Wang YC, Liu JF, Guo WH. AKT-eNOS-NO pathway mediates spontaneous portosystemic shunts and therapeutic efficacy of SC79 in cirrhosis. World J Gastroenterol 2026; 32(36): 119990
- URL: https://www.wjgnet.com/1007-9327/full/v32/i36/119990.htm
- DOI: https://dx.doi.org/10.3748/wjg.119990