
















Copyright: ©Author(s) 2026.
World J Gastroenterol. Sep 28, 2026; 32(36): 119990
Published online Sep 28, 2026. doi: 10.3748/wjg.119990
Published online Sep 28, 2026. doi: 10.3748/wjg.119990
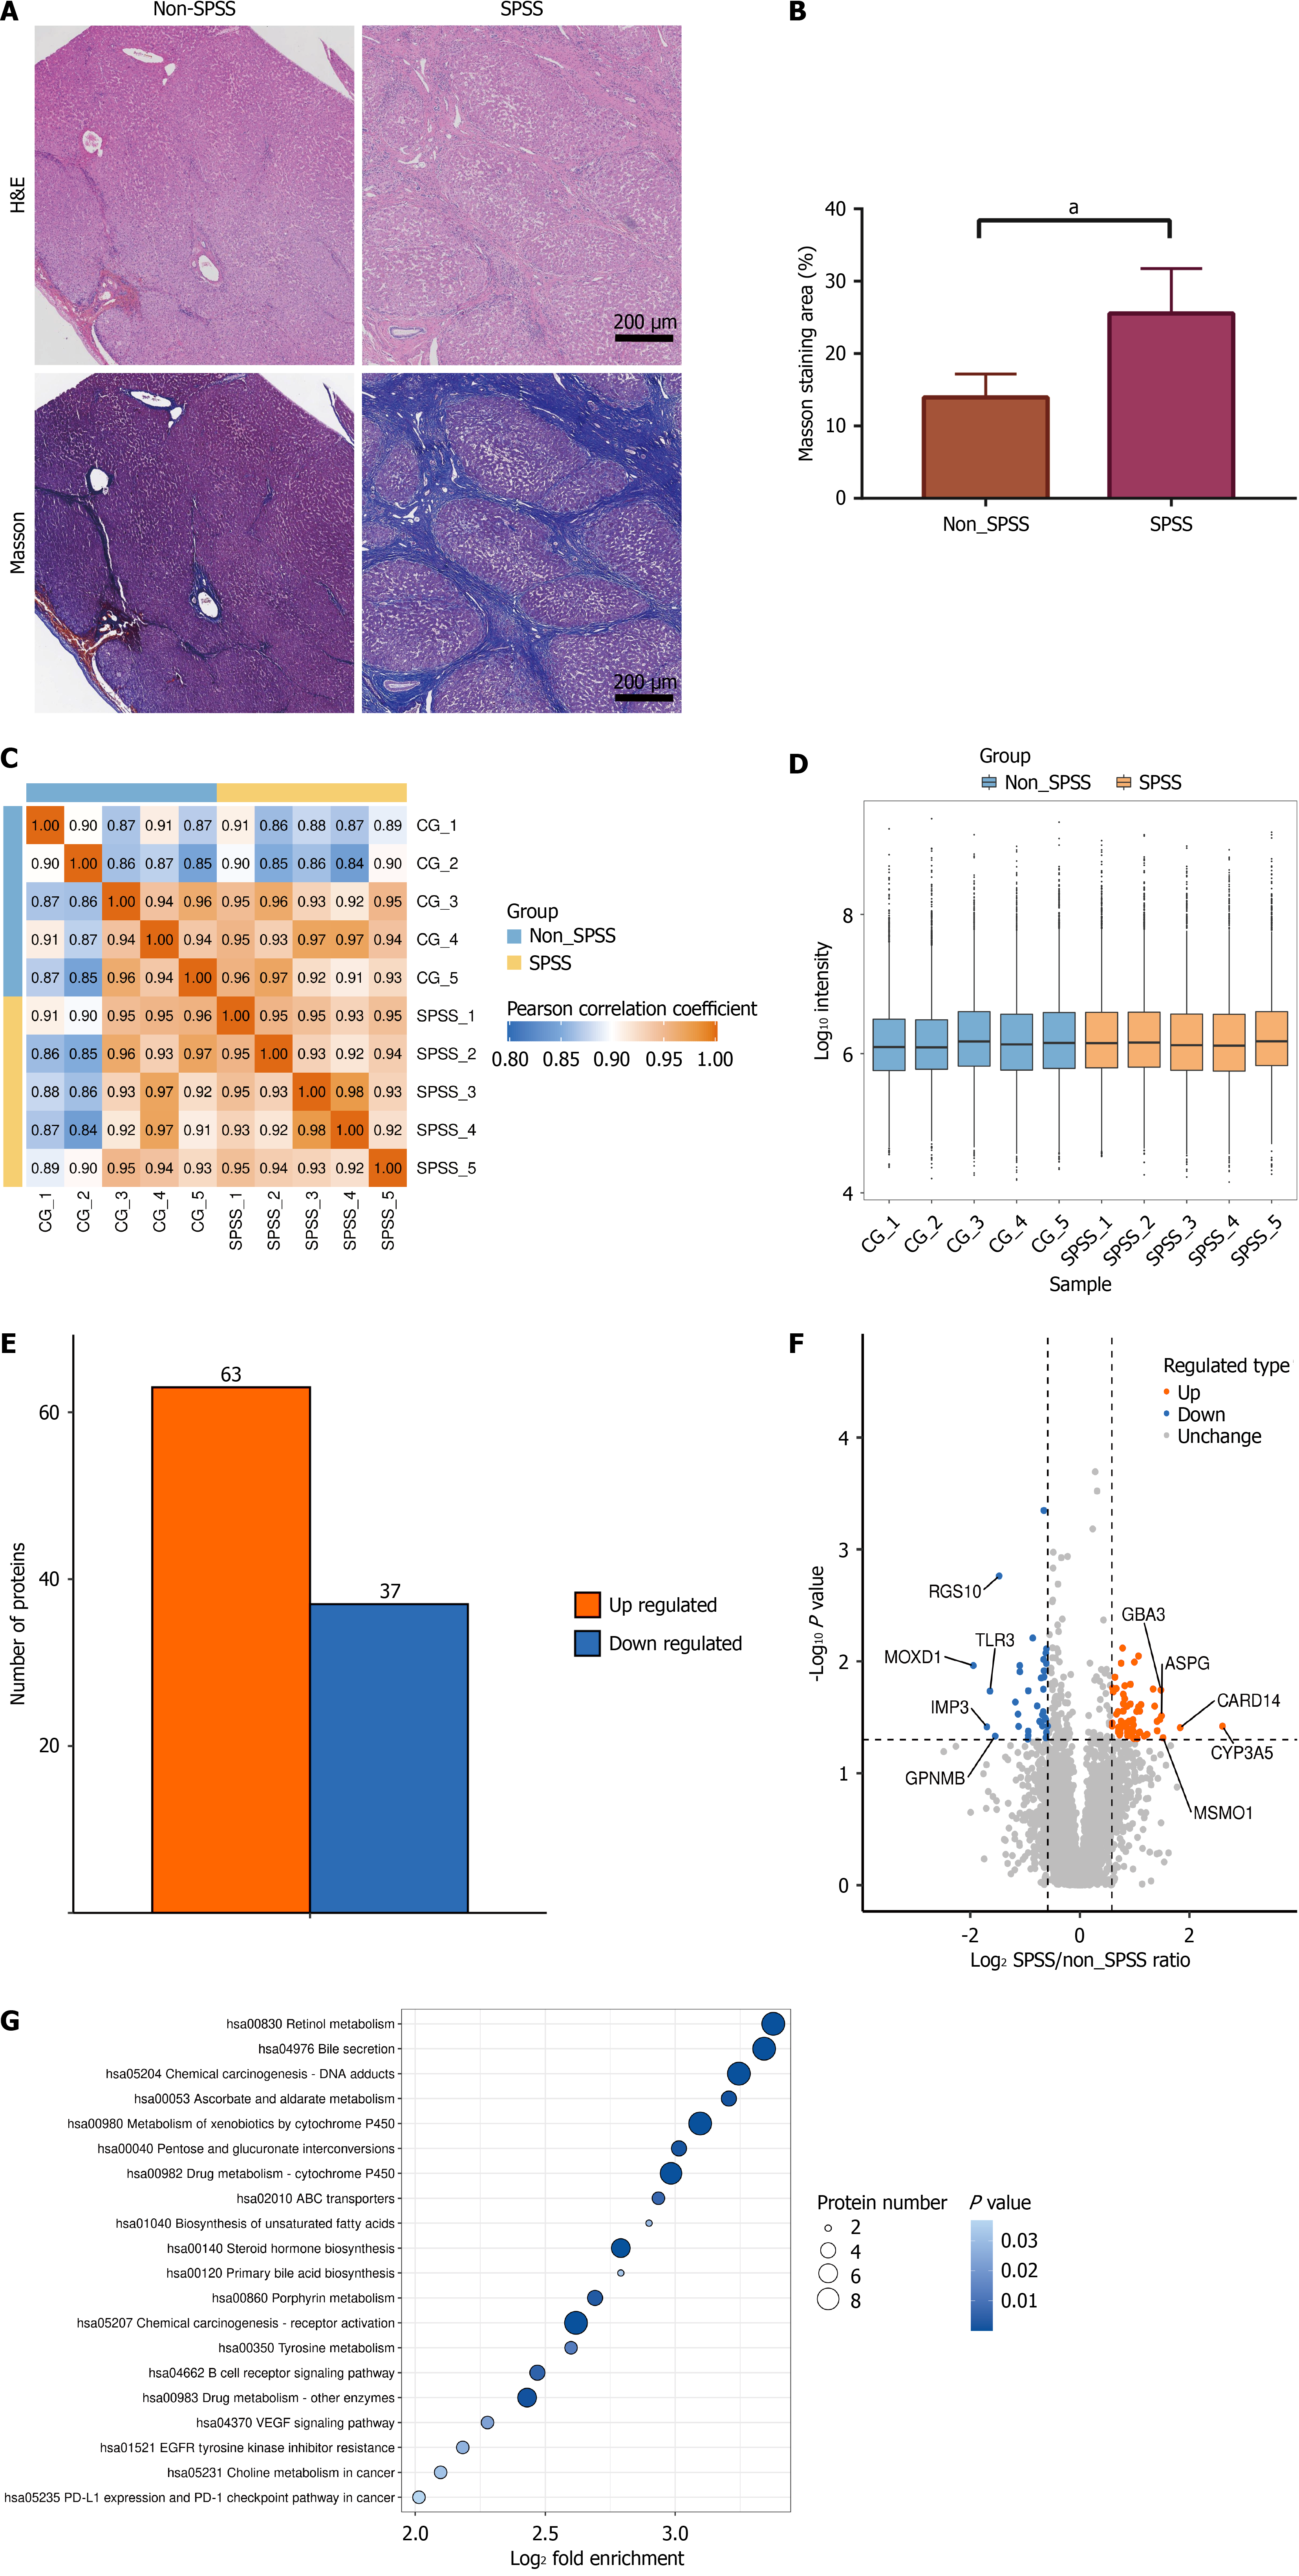
Figure 2 Proteomic profiling reveals mechanisms underlying spontaneous portosystemic shunts formation.
A: Representative histological changes in patients undergoing proteomic analysis; B: Quantification of Masson-stained collagen (data are presented as mean ± SD, n = 5 per group); C: Pearson correlation analysis of proteomic data; D: Distribution of protein intensity values; E: Number of differential proteins between the spontaneous portosystemic shunts (SPSS) and non-SPSS groups; F: Volcano plot of differential proteins; G: Kyoto Encyclopedia of Genes and Genomes pathway enrichment analysis of differential proteins. aP < 0.01. H&E: Hematoxylin and eosin; SPSS: Spontaneous portosystemic shunts.
- Citation: Ke Q, Guo ZT, He J, Huang XH, Lei XJ, Zhuang QY, Zhou Y, Li L, Wang YC, Liu JF, Guo WH. AKT-eNOS-NO pathway mediates spontaneous portosystemic shunts and therapeutic efficacy of SC79 in cirrhosis. World J Gastroenterol 2026; 32(36): 119990
- URL: https://www.wjgnet.com/1007-9327/full/v32/i36/119990.htm
- DOI: https://dx.doi.org/10.3748/wjg.119990