
















Copyright: ©Author(s) 2026.
World J Gastroenterol. Sep 14, 2026; 32(34): 119605
Published online Sep 14, 2026. doi: 10.3748/wjg.119605
Published online Sep 14, 2026. doi: 10.3748/wjg.119605
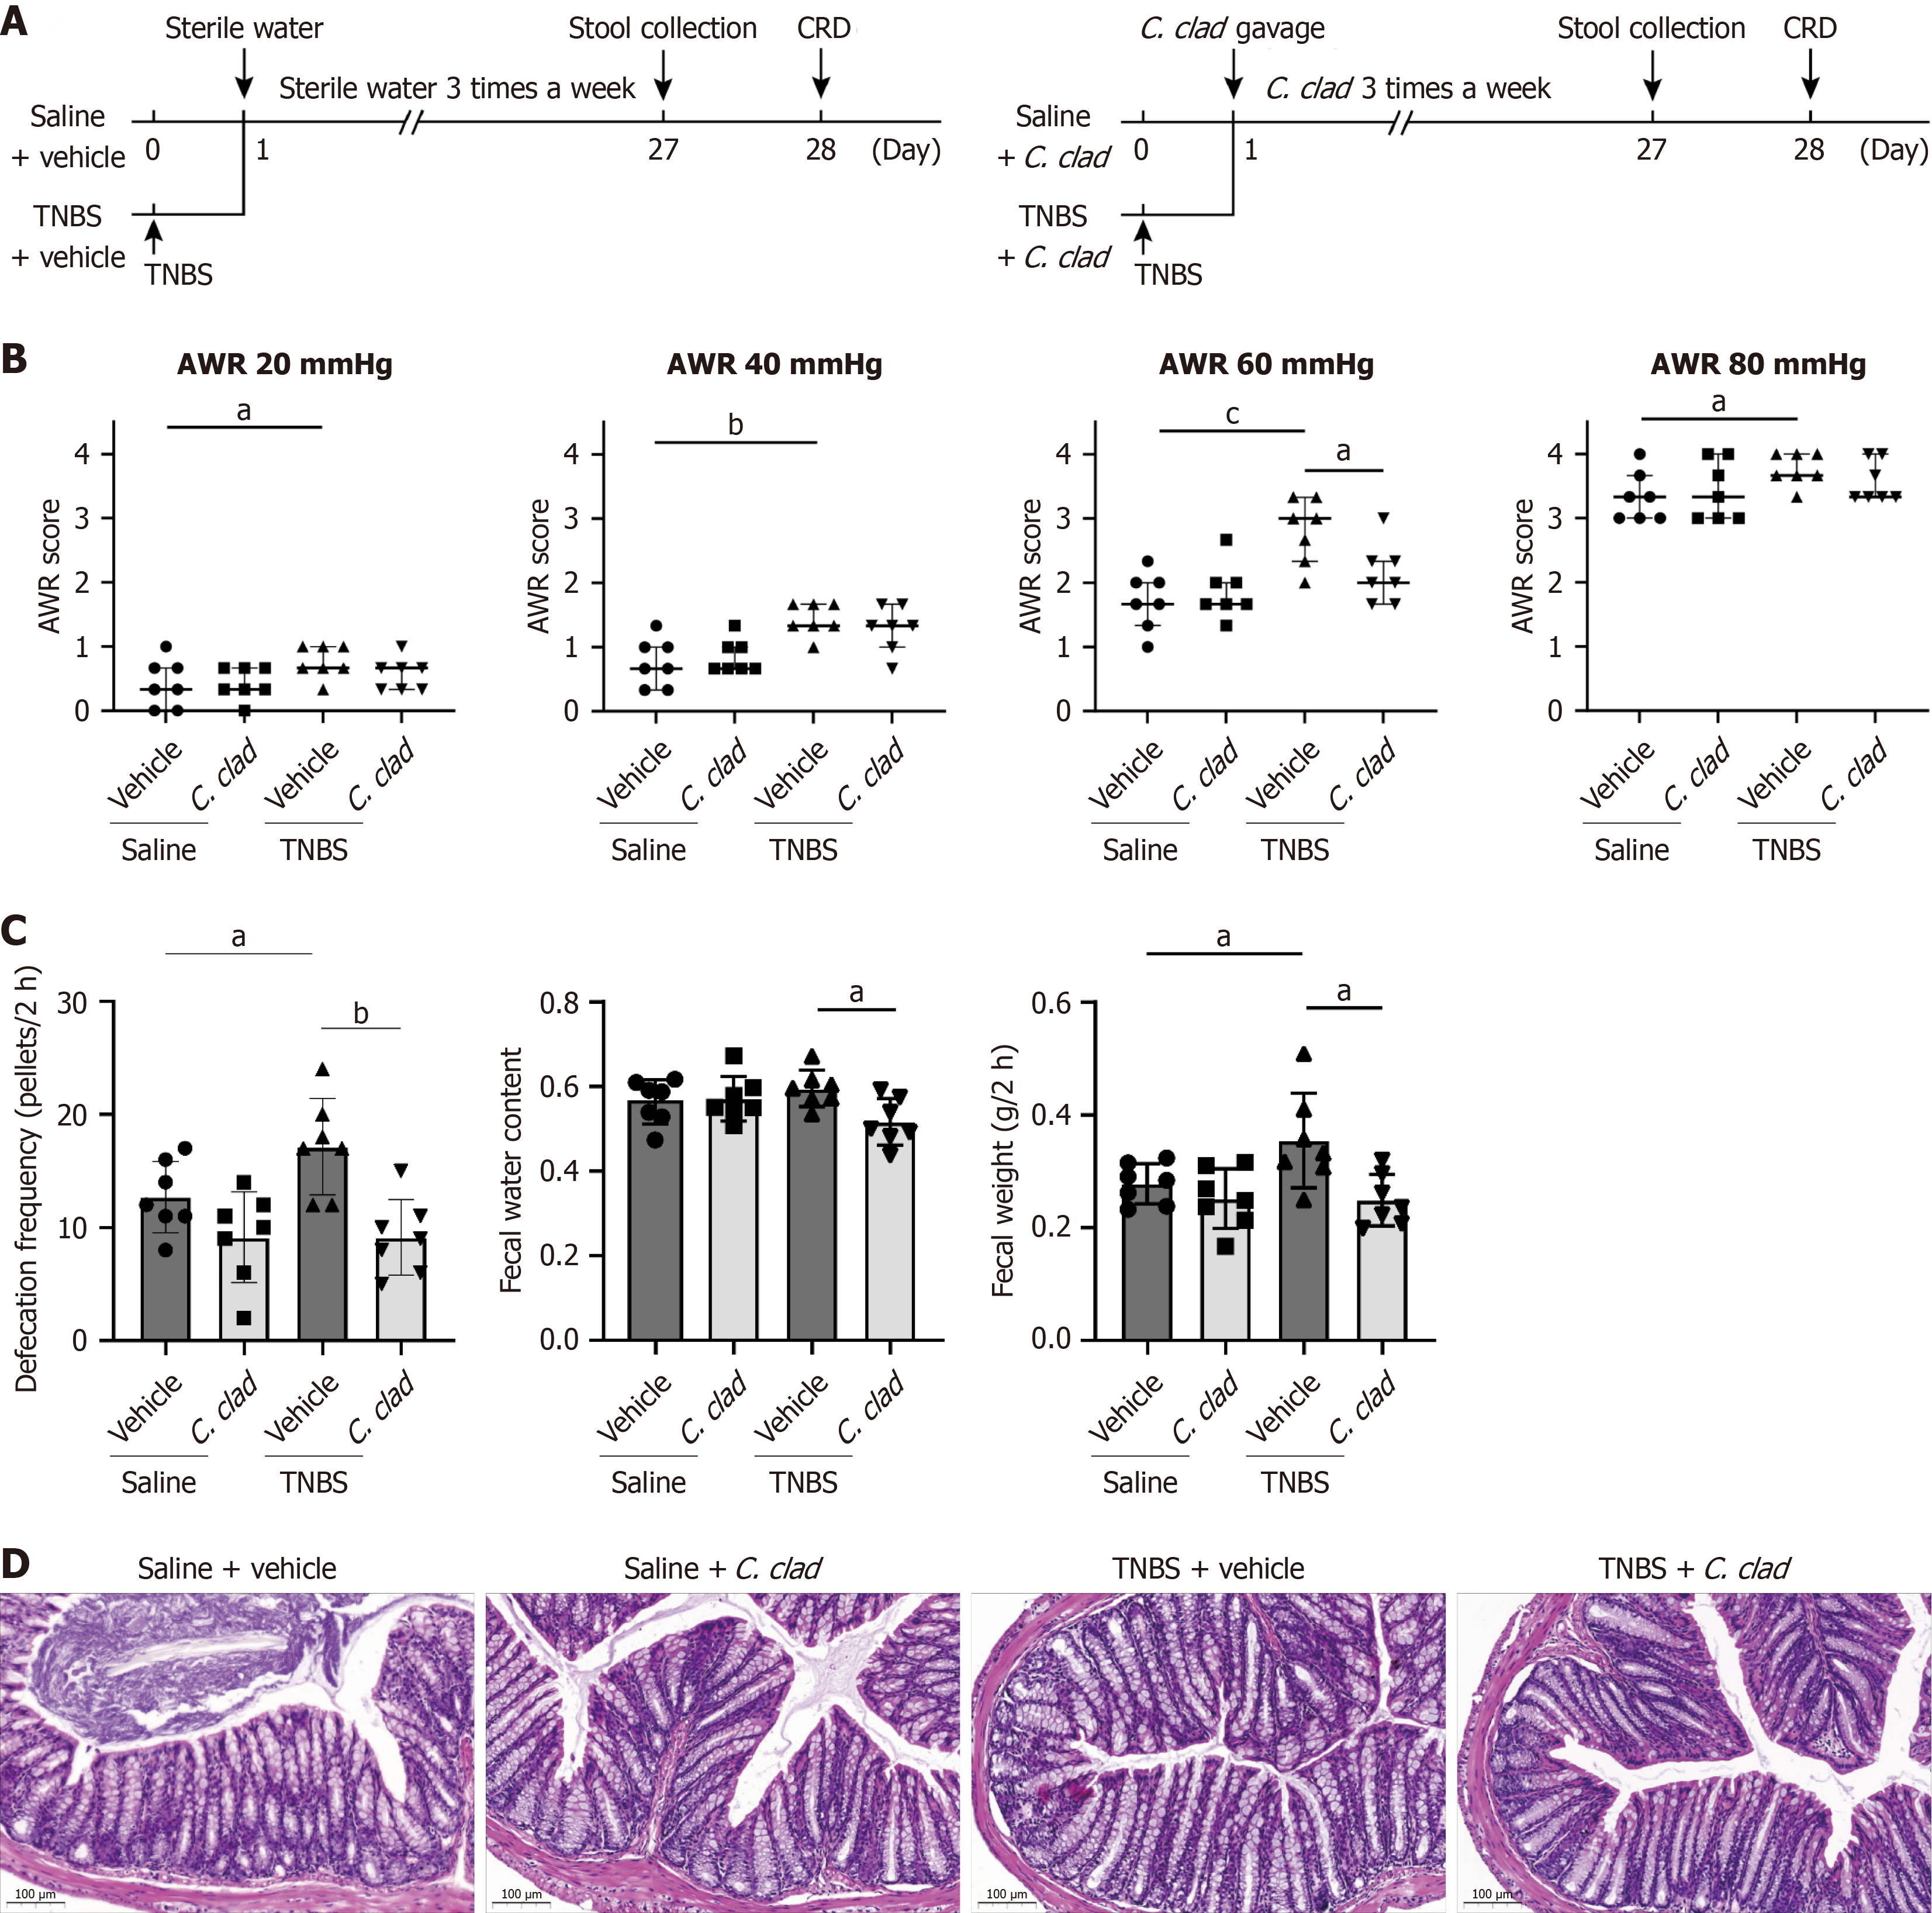
Figure 1 Administration of Cladosporium cladosporioides attenuated visceral hypersensitivity and gut motility in trinitrobenzene sulfonic acid-treated mice.
A: Schematic diagram showing the timeline of model establishment, Cladosporium cladosporioides gavage, sample collection and behavioral observation; B: Visceral hypersensitivity in mice evaluated by CRD-AWR at 20, 40, 60, and 80 mmHg. Tow-way ANOVA; C: Fecal weight, frequency, and water content; D: Representative images of hematoxylin and eosin-stained tissues (n = 7). Scale bar = 100 μm. aP < 0.05, bP < 0.01, cP < 0.001. TNBS: Trinitrobenzene sulfonic acid.
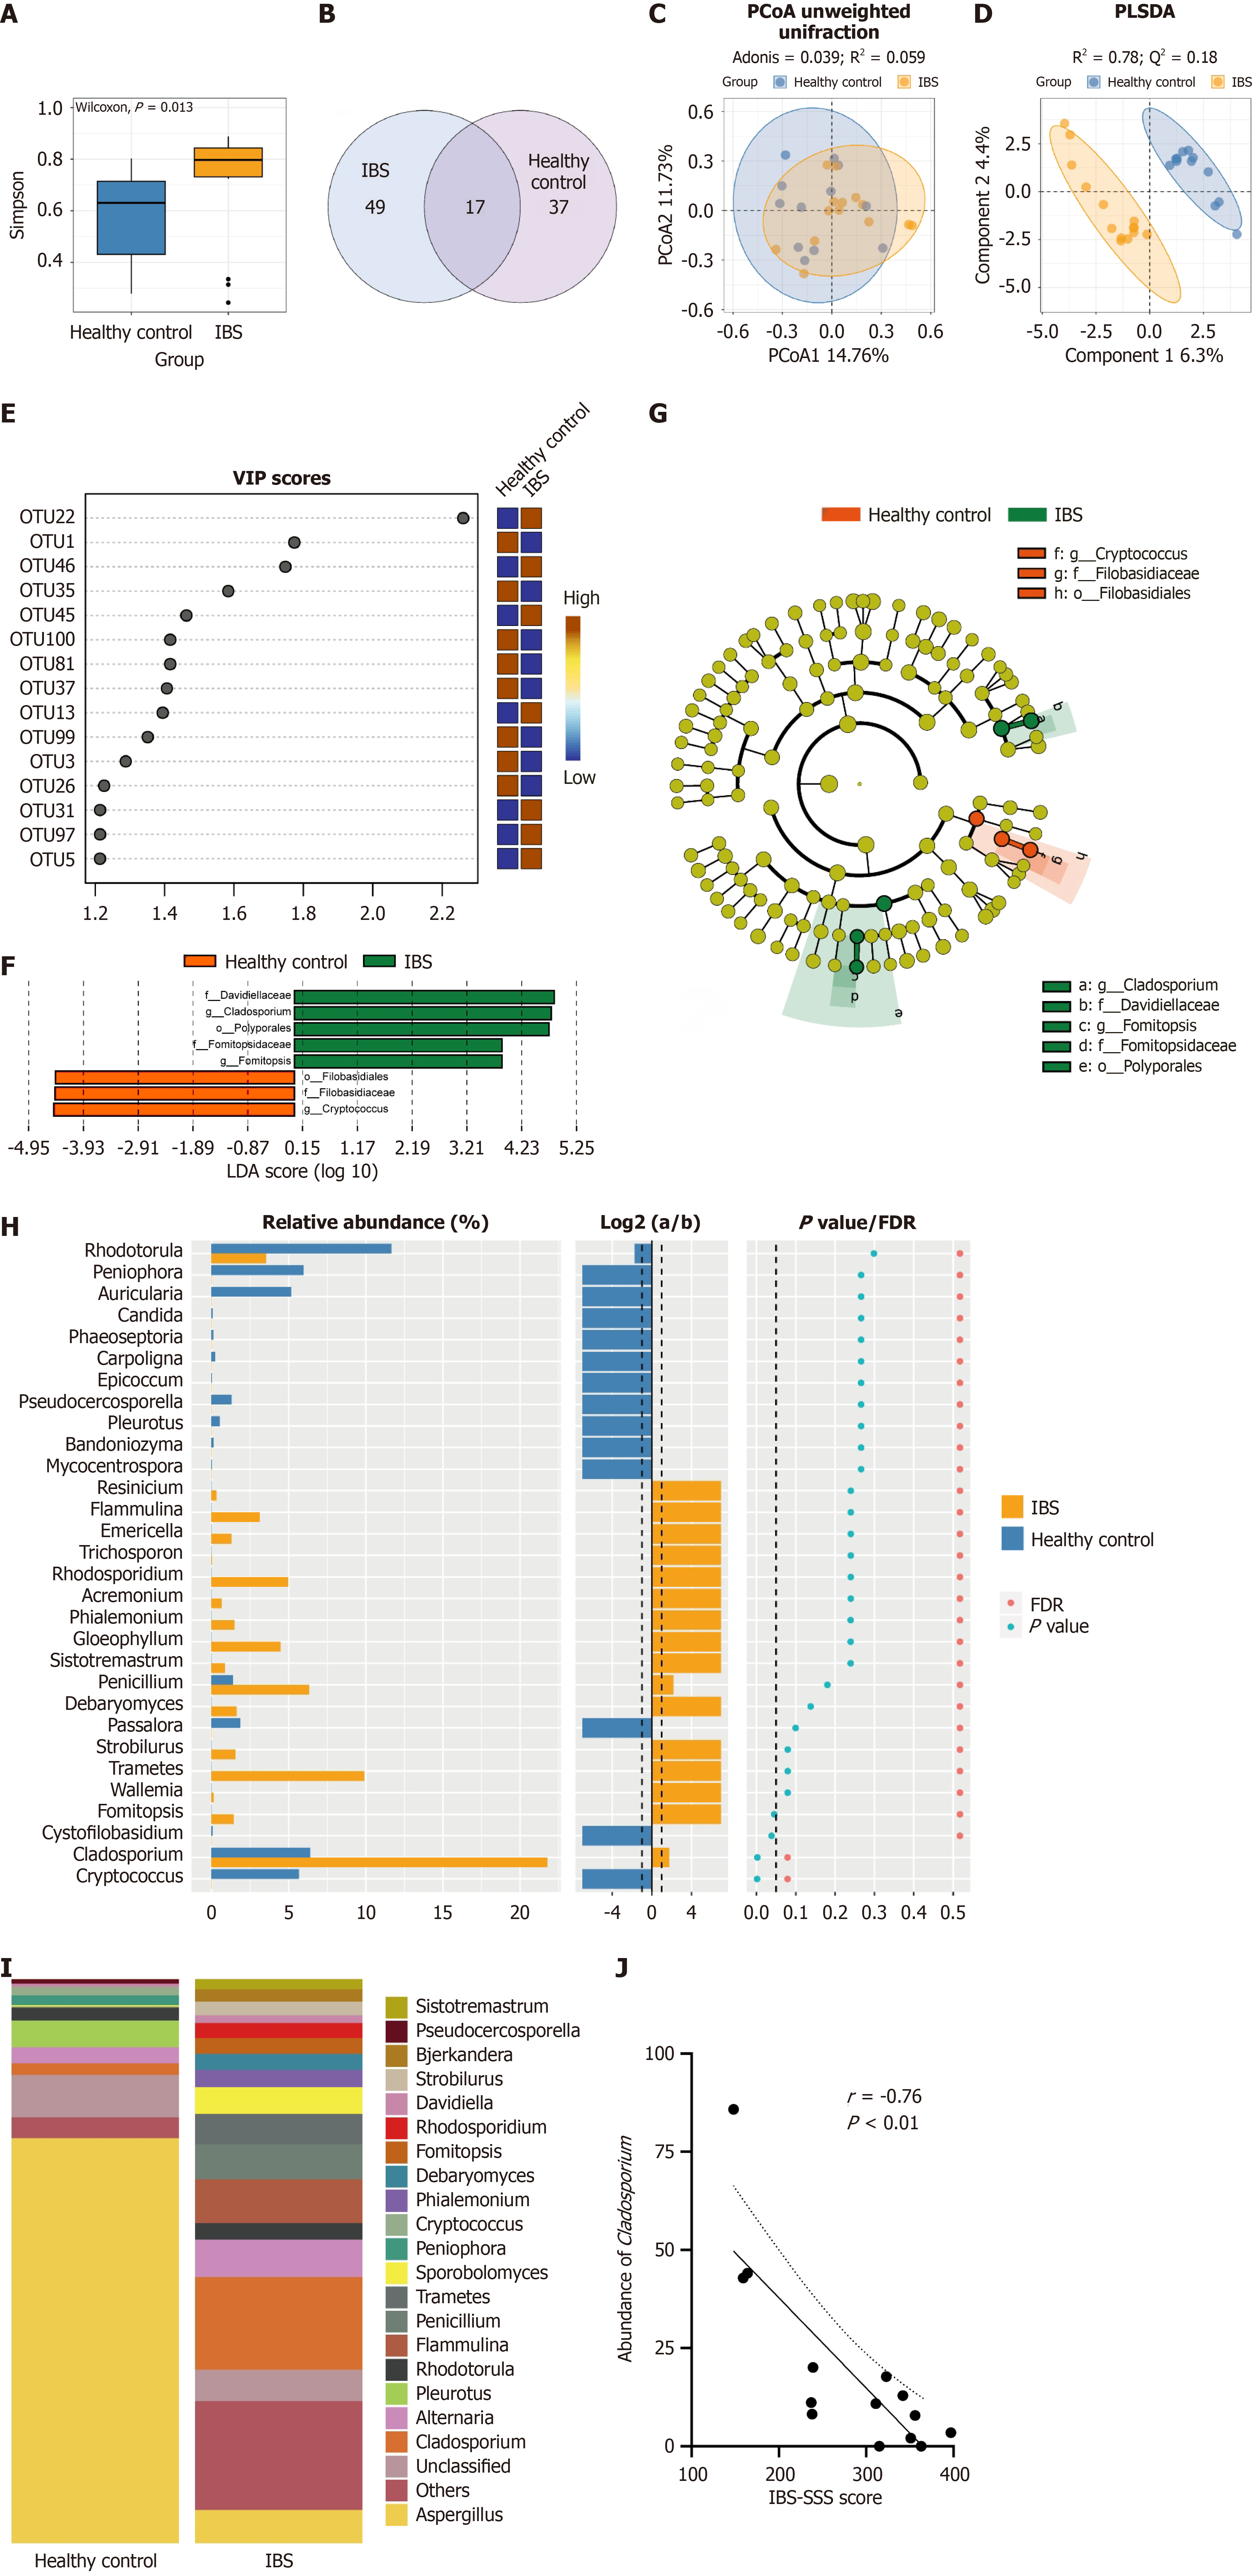
Figure 2 Colonic mucosal mycobiota differ between patients with diarrhea-predominant irritable bowel syndrome and healthy controls.
A: Simpson index of α-diversity; B: Venn plot of gut mucosal mycobiota; C: Principal coordinate analysis of β-diversity based on unweighted UniFrac distances; D: Partial least squares discriminant analysis of β-diversity; E: VIP scores of the top 15 operational taxonomic units; F: Biomarker fungus for patients with diarrhea-predominant irritable bowel syndrome (IBS-D) revealed by linear discriminant analysis effect size LDA; G: Linear discriminant analysis effect size cladogram of biomarker fungus; H: Mucosal fungi with differential abundances identified based on fold change and Wilcoxon analysis (a, refers to IBS-D. b refers to healthy controls); I: Bar plot of 20 most abundant mucosal genera in patients with IBS-D and healthy controls; J: Spearman correlation between Cladosporium abundance and irritable bowel syndrome severity scoring system score (r = -0.73, P < 0.01). IBS: Irritable bowel syndrome; PCoA: Principal coordinate analysis; OUT: Operational taxonomic unit; IBS-SSS: Irritable bowel syndrome severity scoring system.
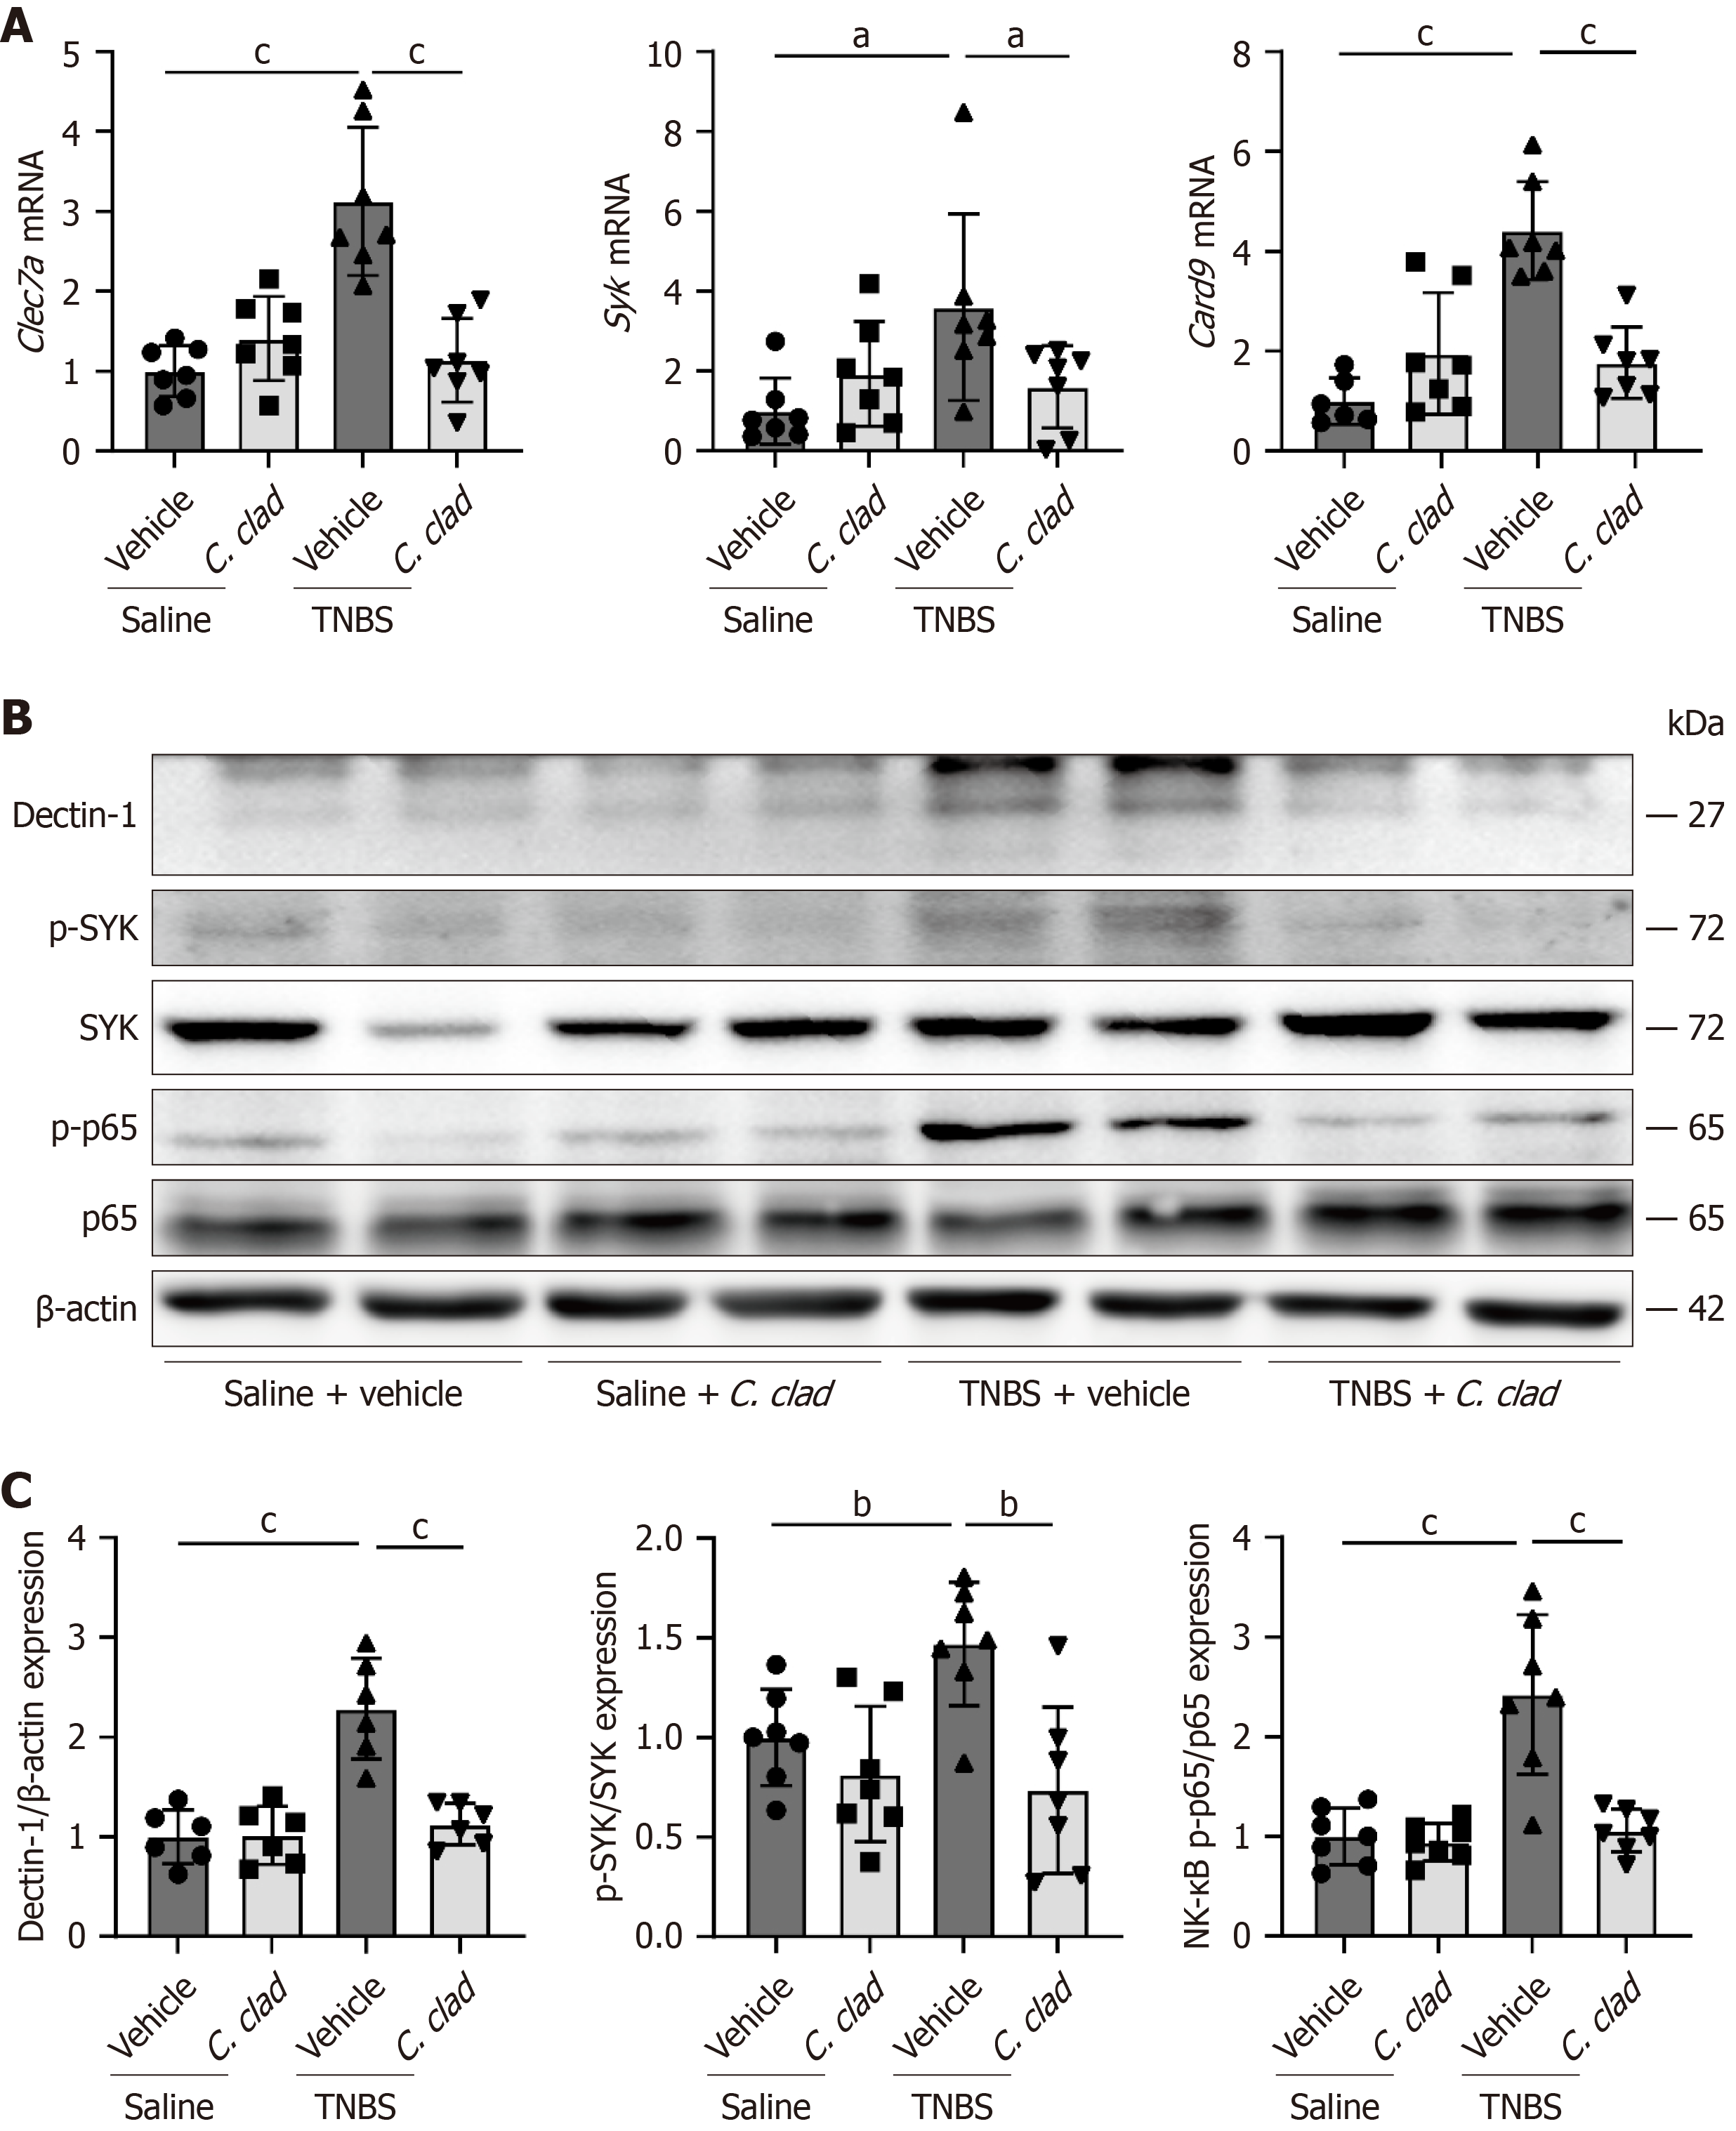
Figure 3 Gavage with Cladosporium cladosporioides downregulated dectin-1/nuclear factor kappa B signaling.
A: Reverse transcription-quantitative polymerase chain reaction of dectin-1/spleen tyrosine kinase/caspase recruitment domain family member 9 mRNA expression among groups. One outlier identified in saline + vehicle group in the mRNA expression analysis of caspase recruitment domain family member 9 and removed with Turkey outlier analysis; B: Western blot analysis of dectin-1/p65 protein expression; C: Quantification of dectin-1 protein levels normalized to β-actin levels. Data are presented as the mean ± SD. Two-way ANOVA (n = 7). aP < 0.05, bP < 0.01, cP < 0.001. TNBS: Trinitrobenzene sulfonic acid; Syk: Spleen tyrosine kinase; Card9: Caspase recruitment domain family member 9; NF-κB: Nuclear factor kappa B.
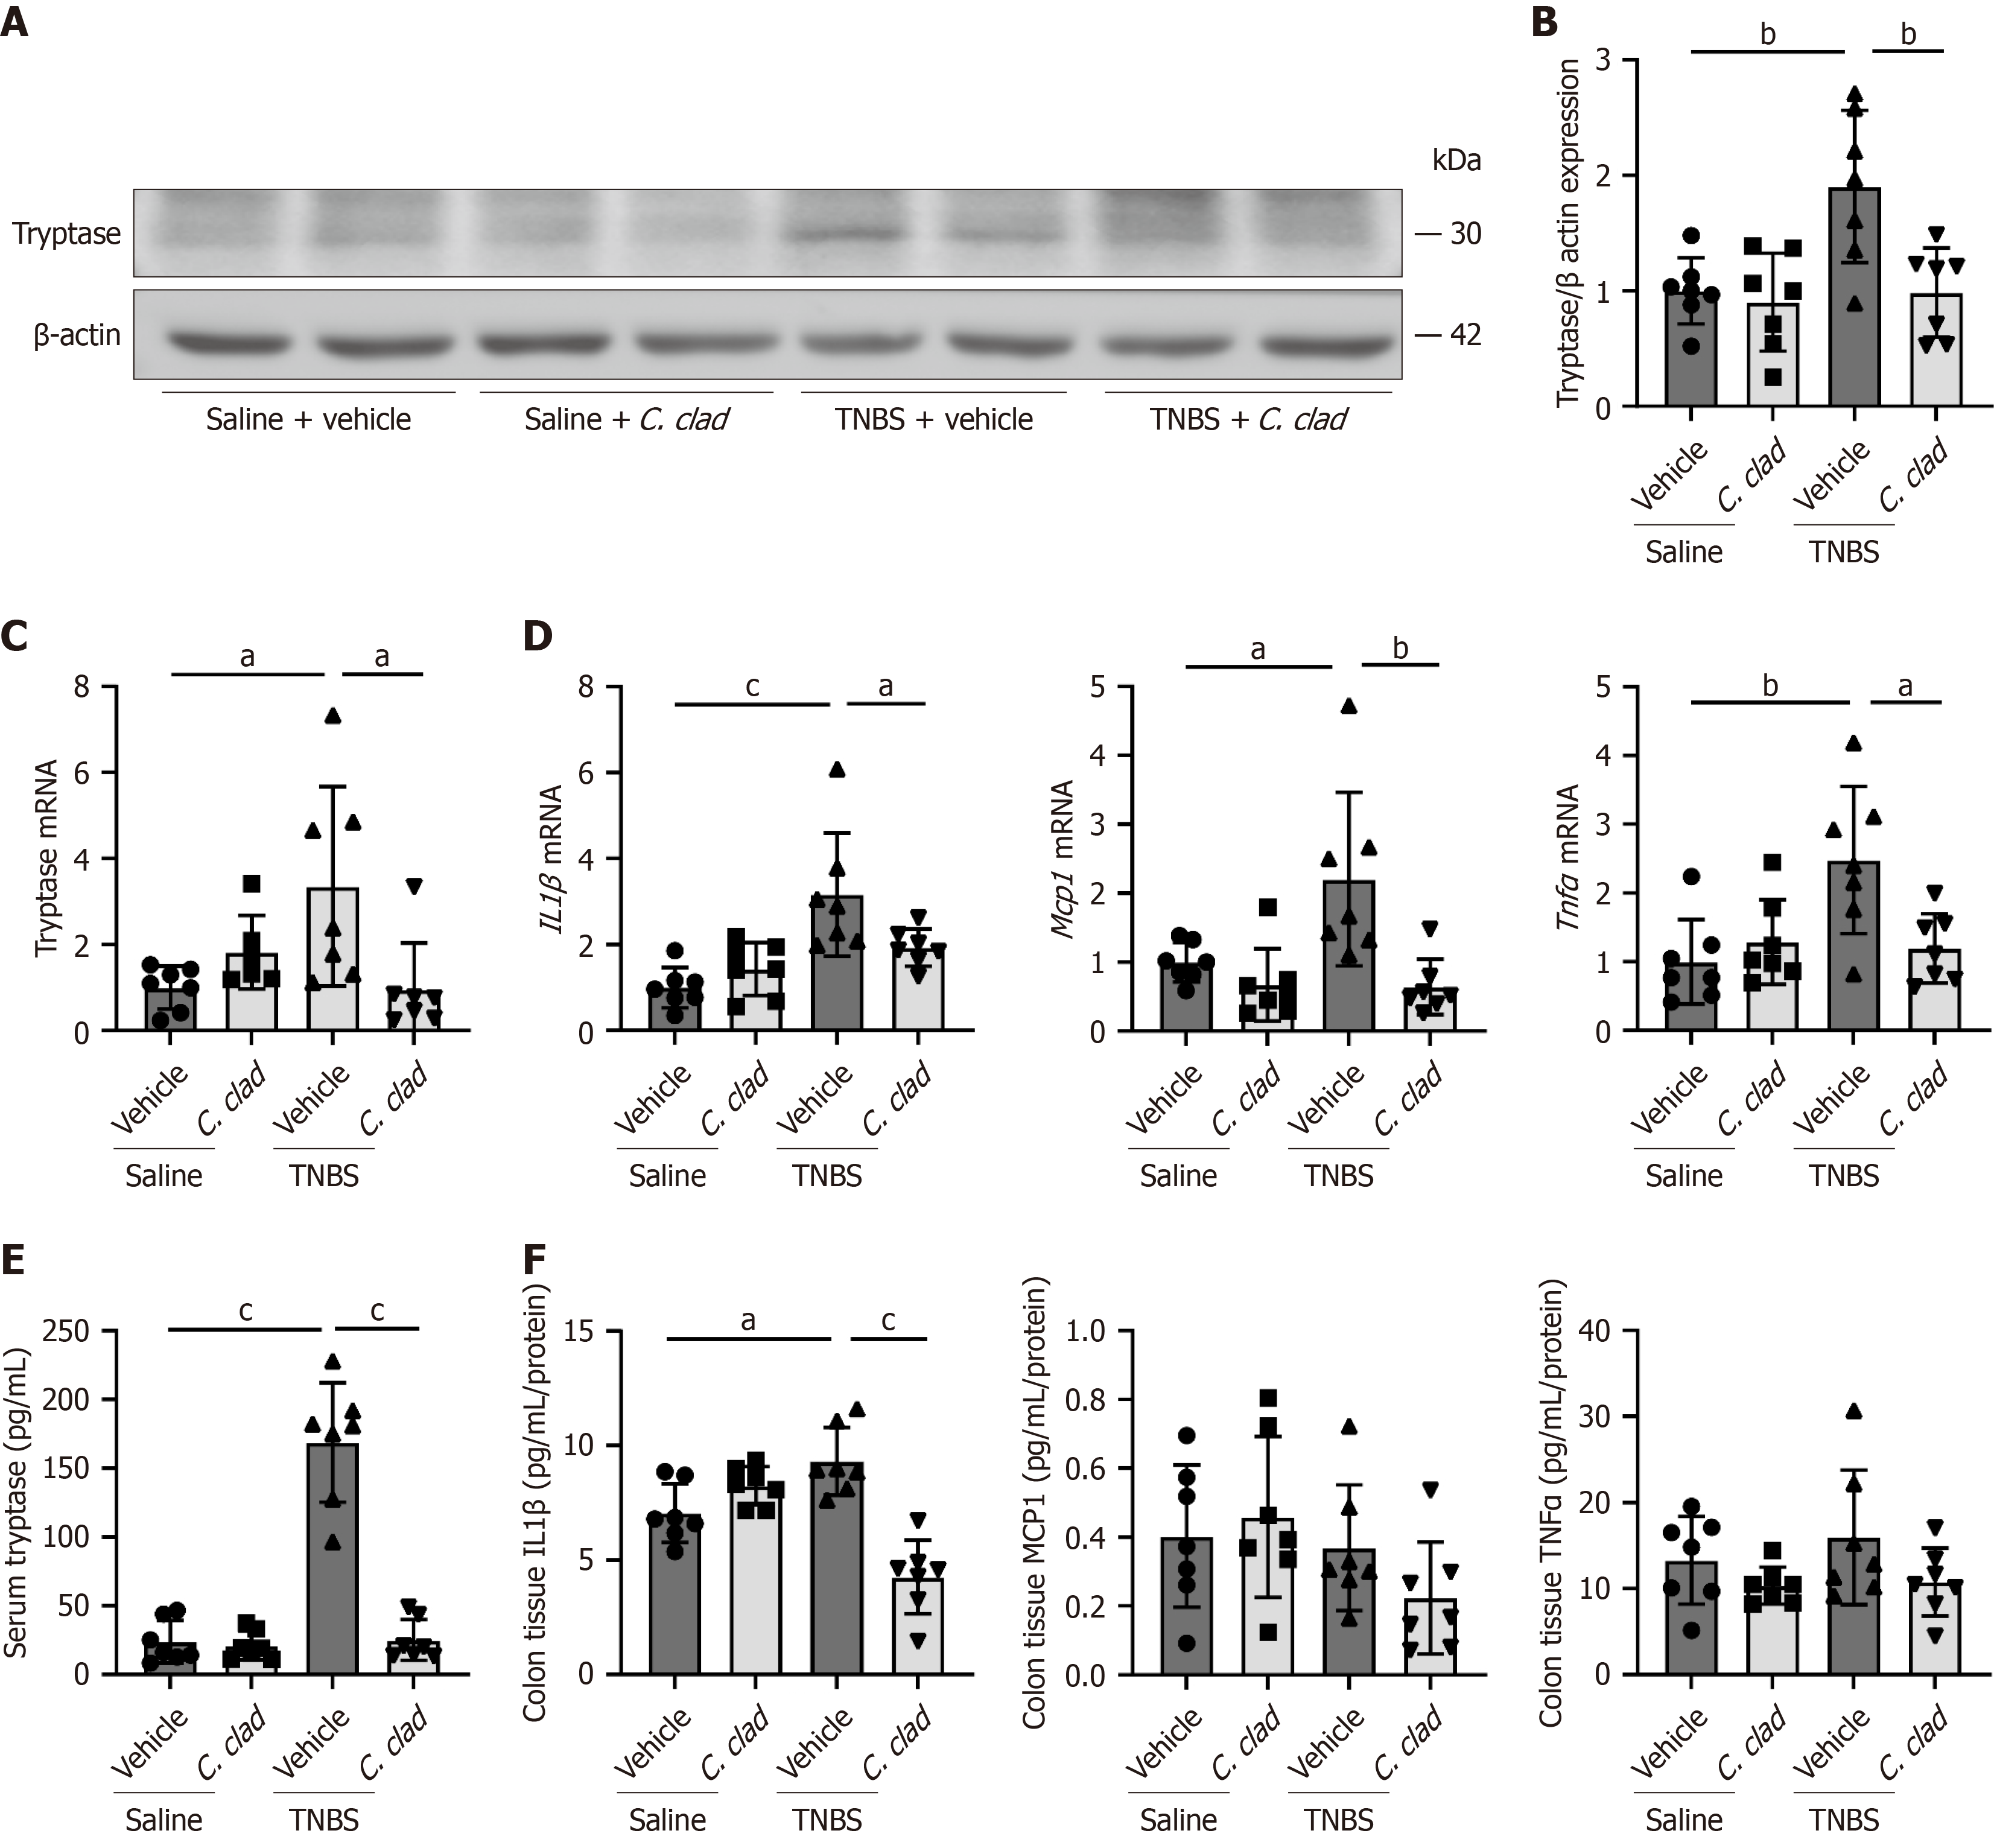
Figure 4 Gavage with Cladosporium cladosporioides inhibited colonic inflammation and mast cell activation.
A: Mast cell tryptase expression based on western blot analysis of colonic mucosa; B: Quantification of tryptase protein levels normalized to β-actin levels; C: Mast cell tryptase mRNA expression based on reverse transcription-quantitative polymerase chain reaction of colonic mucosa. One outlier identified and removed with Turkey outlier analysis in saline + Cladosporium cladosporioides group; D: Cytokine mRNA expression based on reverse transcription-quantitative polymerase chain reaction of colonic mucosa; E: Serum mast cell tryptase detected using enzyme-linked immunosorbent assay; F: Cytokine expression in colonic mucosa detected using enzyme-linked immunosorbent assay. Data are presented as the mean ± SD. Two-way ANOVA (n = 7). aP < 0.05, bP < 0.01, cP < 0.001. TNBS: Trinitrobenzene sulfonic acid; MCP: Monocyte chemoattractant protein; TNF: Tumor necrosis factor; IL: Interleukin.
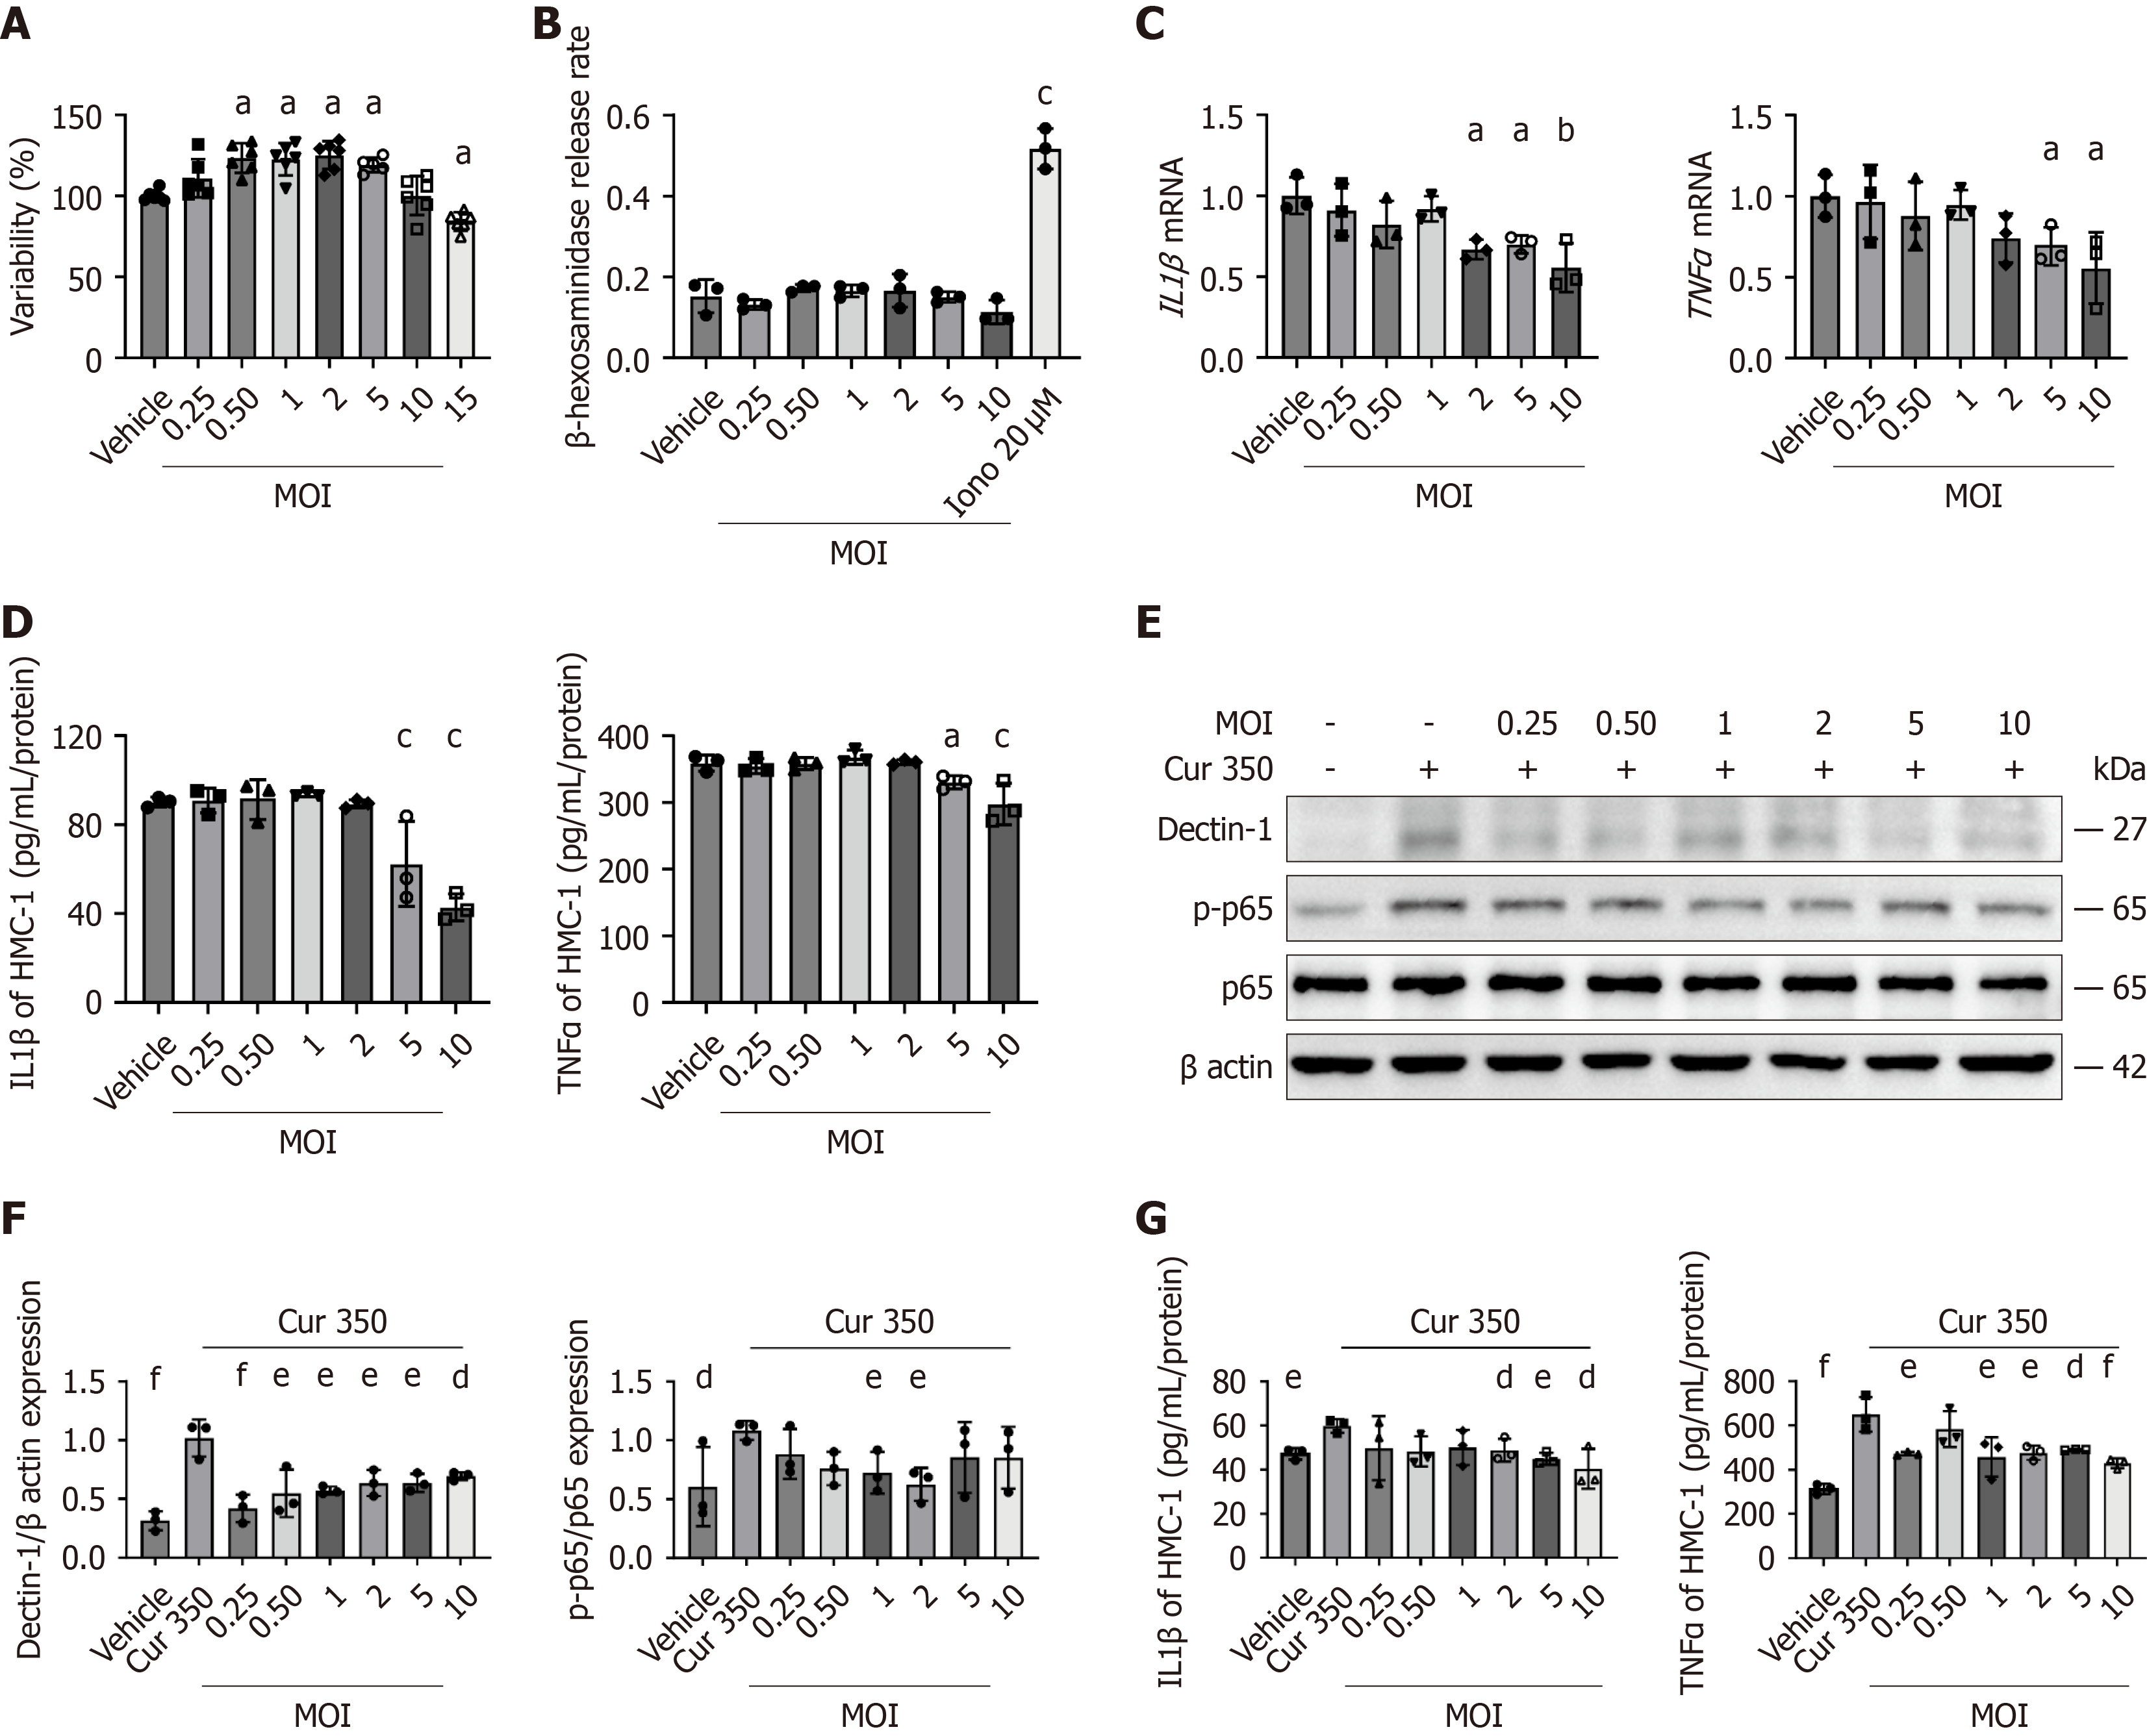
Figure 5 Cladosporium cladosporioides suppresses mast cell activation by inhibiting dectin-1/nuclear factor kappa B signaling.
A: Cell counting kit 8 assay of mast cell viability following coculture with Cladosporium cladosporioides (C. cladosporioides) at different multiplicities of infection (MOIs) for 48 hours. n = 6, one outlier identified and removed with Turkey outlier analysis in MOI 5; B: Mast cell degranulation detected using β-hexosaminidase releasing assay after treatment at different MOIs for 2 hours; C: Interleukin 1 beta (IL-1β) and tumor necrosis factor alpha (TNF-α) mRNA expression in mast cells detected using reverse transcription-quantitative polymerase chain reaction after treatment at different MOIs for 12 hours; D: IL-1β and TNF-α expression in mast cells detected using enzyme-linked immunosorbent assay after treatment at different MOIs for 24 hours; E: Dectin-1/nuclear factor kappa B expression in mast cells stimulated with curdlan (350 μg/mL) and cocultured with C. cladosporioides at different MOIs for 24 hours; F: Quantification of dectin-1 protein levels normalized to β-actin levels, and p-p65 levels normalized to p65 levels; G: IL-1β and TNF-α expression detected using enzyme-linked immunosorbent assay after treatment with curdlan and C. cladosporioides at different MOIs for 24 hours. Data are presented as the mean ± SD. One-way ANOVA followed by Tukey’s test and Student’s t-test (n = 3). aP < 0.05, bP < 0.01, cP < 0.001 compared to the vehicle group; dP < 0.05, eP < 0.01, fP < 0.001 compared to the curdlan 350 μg/mL group. MOI: Multiplicity of infection; Iono: Ionomycin; Cur 350: Curdlan 350 μg/mL; TNF: Tumor necrosis factor; IL: Interleukin.
- Citation: Guo CL, Zhang SQ, Zheng HN, Chi Y, Wang HH. Cladosporium cladosporioides ameliorates visceral hypersensitivity in irritable bowel syndrome-like mice by inhibiting dectin-1 signaling and mast cell activation. World J Gastroenterol 2026; 32(34): 119605
- URL: https://www.wjgnet.com/1007-9327/full/v32/i34/119605.htm
- DOI: https://dx.doi.org/10.3748/wjg.119605