
















Copyright: ©Author(s) 2026.
World J Gastroenterol. Sep 14, 2026; 32(34): 119605
Published online Sep 14, 2026. doi: 10.3748/wjg.119605
Published online Sep 14, 2026. doi: 10.3748/wjg.119605
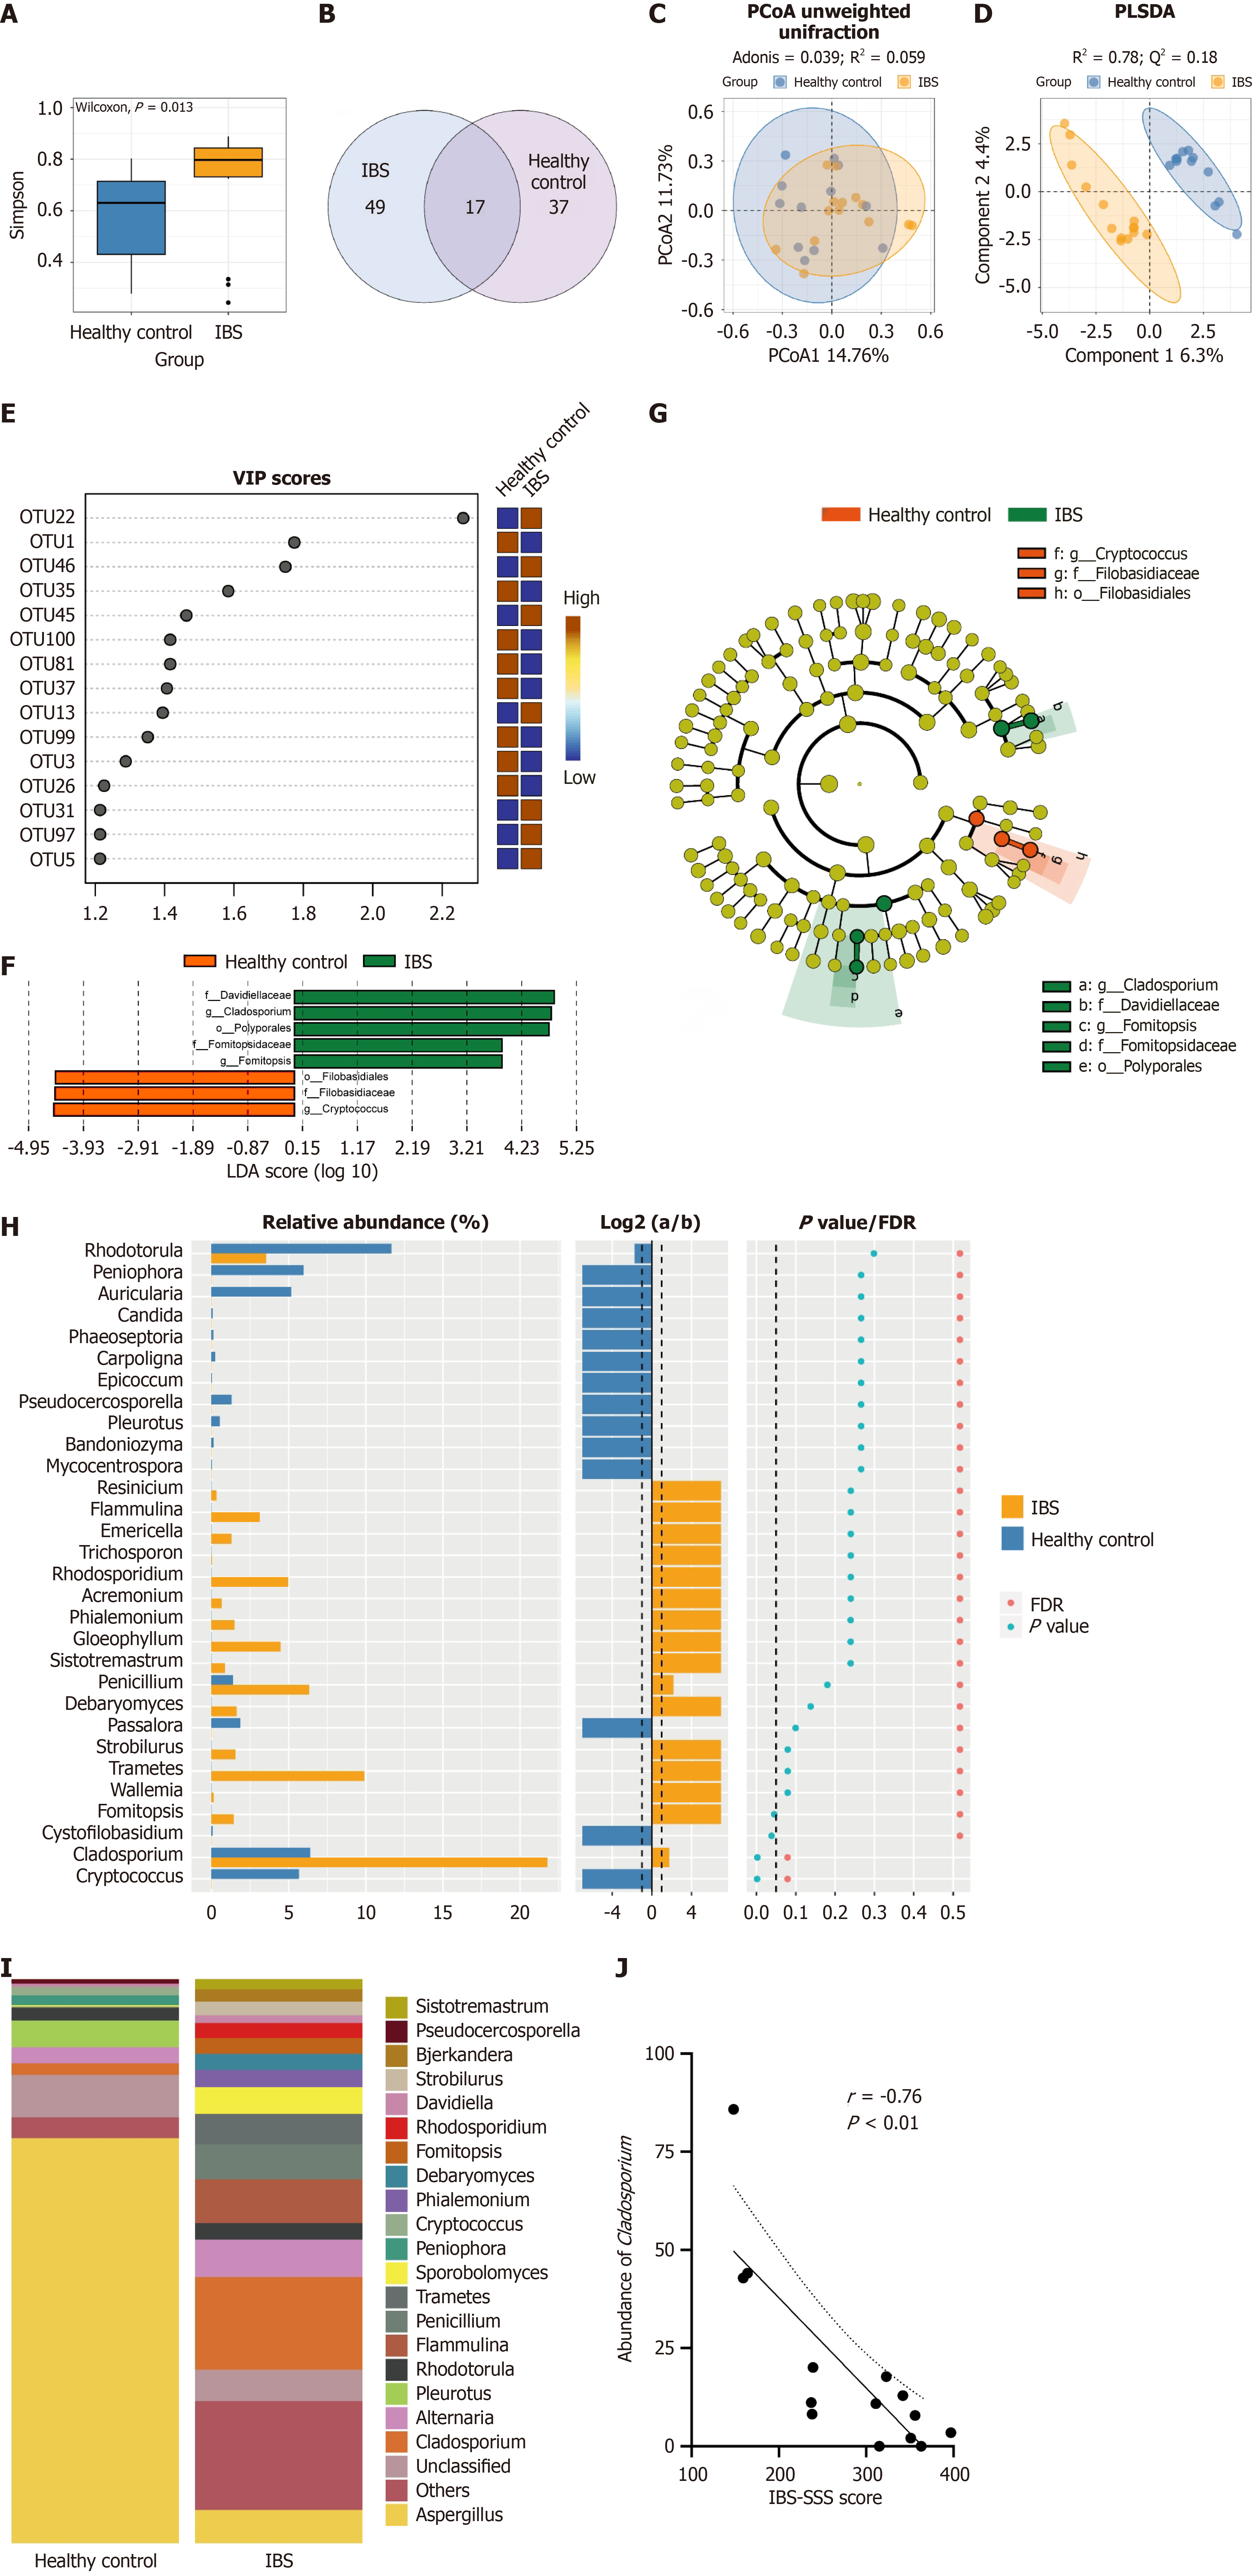
Figure 2 Colonic mucosal mycobiota differ between patients with diarrhea-predominant irritable bowel syndrome and healthy controls.
A: Simpson index of α-diversity; B: Venn plot of gut mucosal mycobiota; C: Principal coordinate analysis of β-diversity based on unweighted UniFrac distances; D: Partial least squares discriminant analysis of β-diversity; E: VIP scores of the top 15 operational taxonomic units; F: Biomarker fungus for patients with diarrhea-predominant irritable bowel syndrome (IBS-D) revealed by linear discriminant analysis effect size LDA; G: Linear discriminant analysis effect size cladogram of biomarker fungus; H: Mucosal fungi with differential abundances identified based on fold change and Wilcoxon analysis (a, refers to IBS-D. b refers to healthy controls); I: Bar plot of 20 most abundant mucosal genera in patients with IBS-D and healthy controls; J: Spearman correlation between Cladosporium abundance and irritable bowel syndrome severity scoring system score (r = -0.73, P < 0.01). IBS: Irritable bowel syndrome; PCoA: Principal coordinate analysis; OUT: Operational taxonomic unit; IBS-SSS: Irritable bowel syndrome severity scoring system.
- Citation: Guo CL, Zhang SQ, Zheng HN, Chi Y, Wang HH. Cladosporium cladosporioides ameliorates visceral hypersensitivity in irritable bowel syndrome-like mice by inhibiting dectin-1 signaling and mast cell activation. World J Gastroenterol 2026; 32(34): 119605
- URL: https://www.wjgnet.com/1007-9327/full/v32/i34/119605.htm
- DOI: https://dx.doi.org/10.3748/wjg.119605