Copyright
©The Author(s) 2020.
World J Gastroenterol. Mar 7, 2020; 26(9): 918-932
Published online Mar 7, 2020. doi: 10.3748/wjg.v26.i9.918
Published online Mar 7, 2020. doi: 10.3748/wjg.v26.i9.918
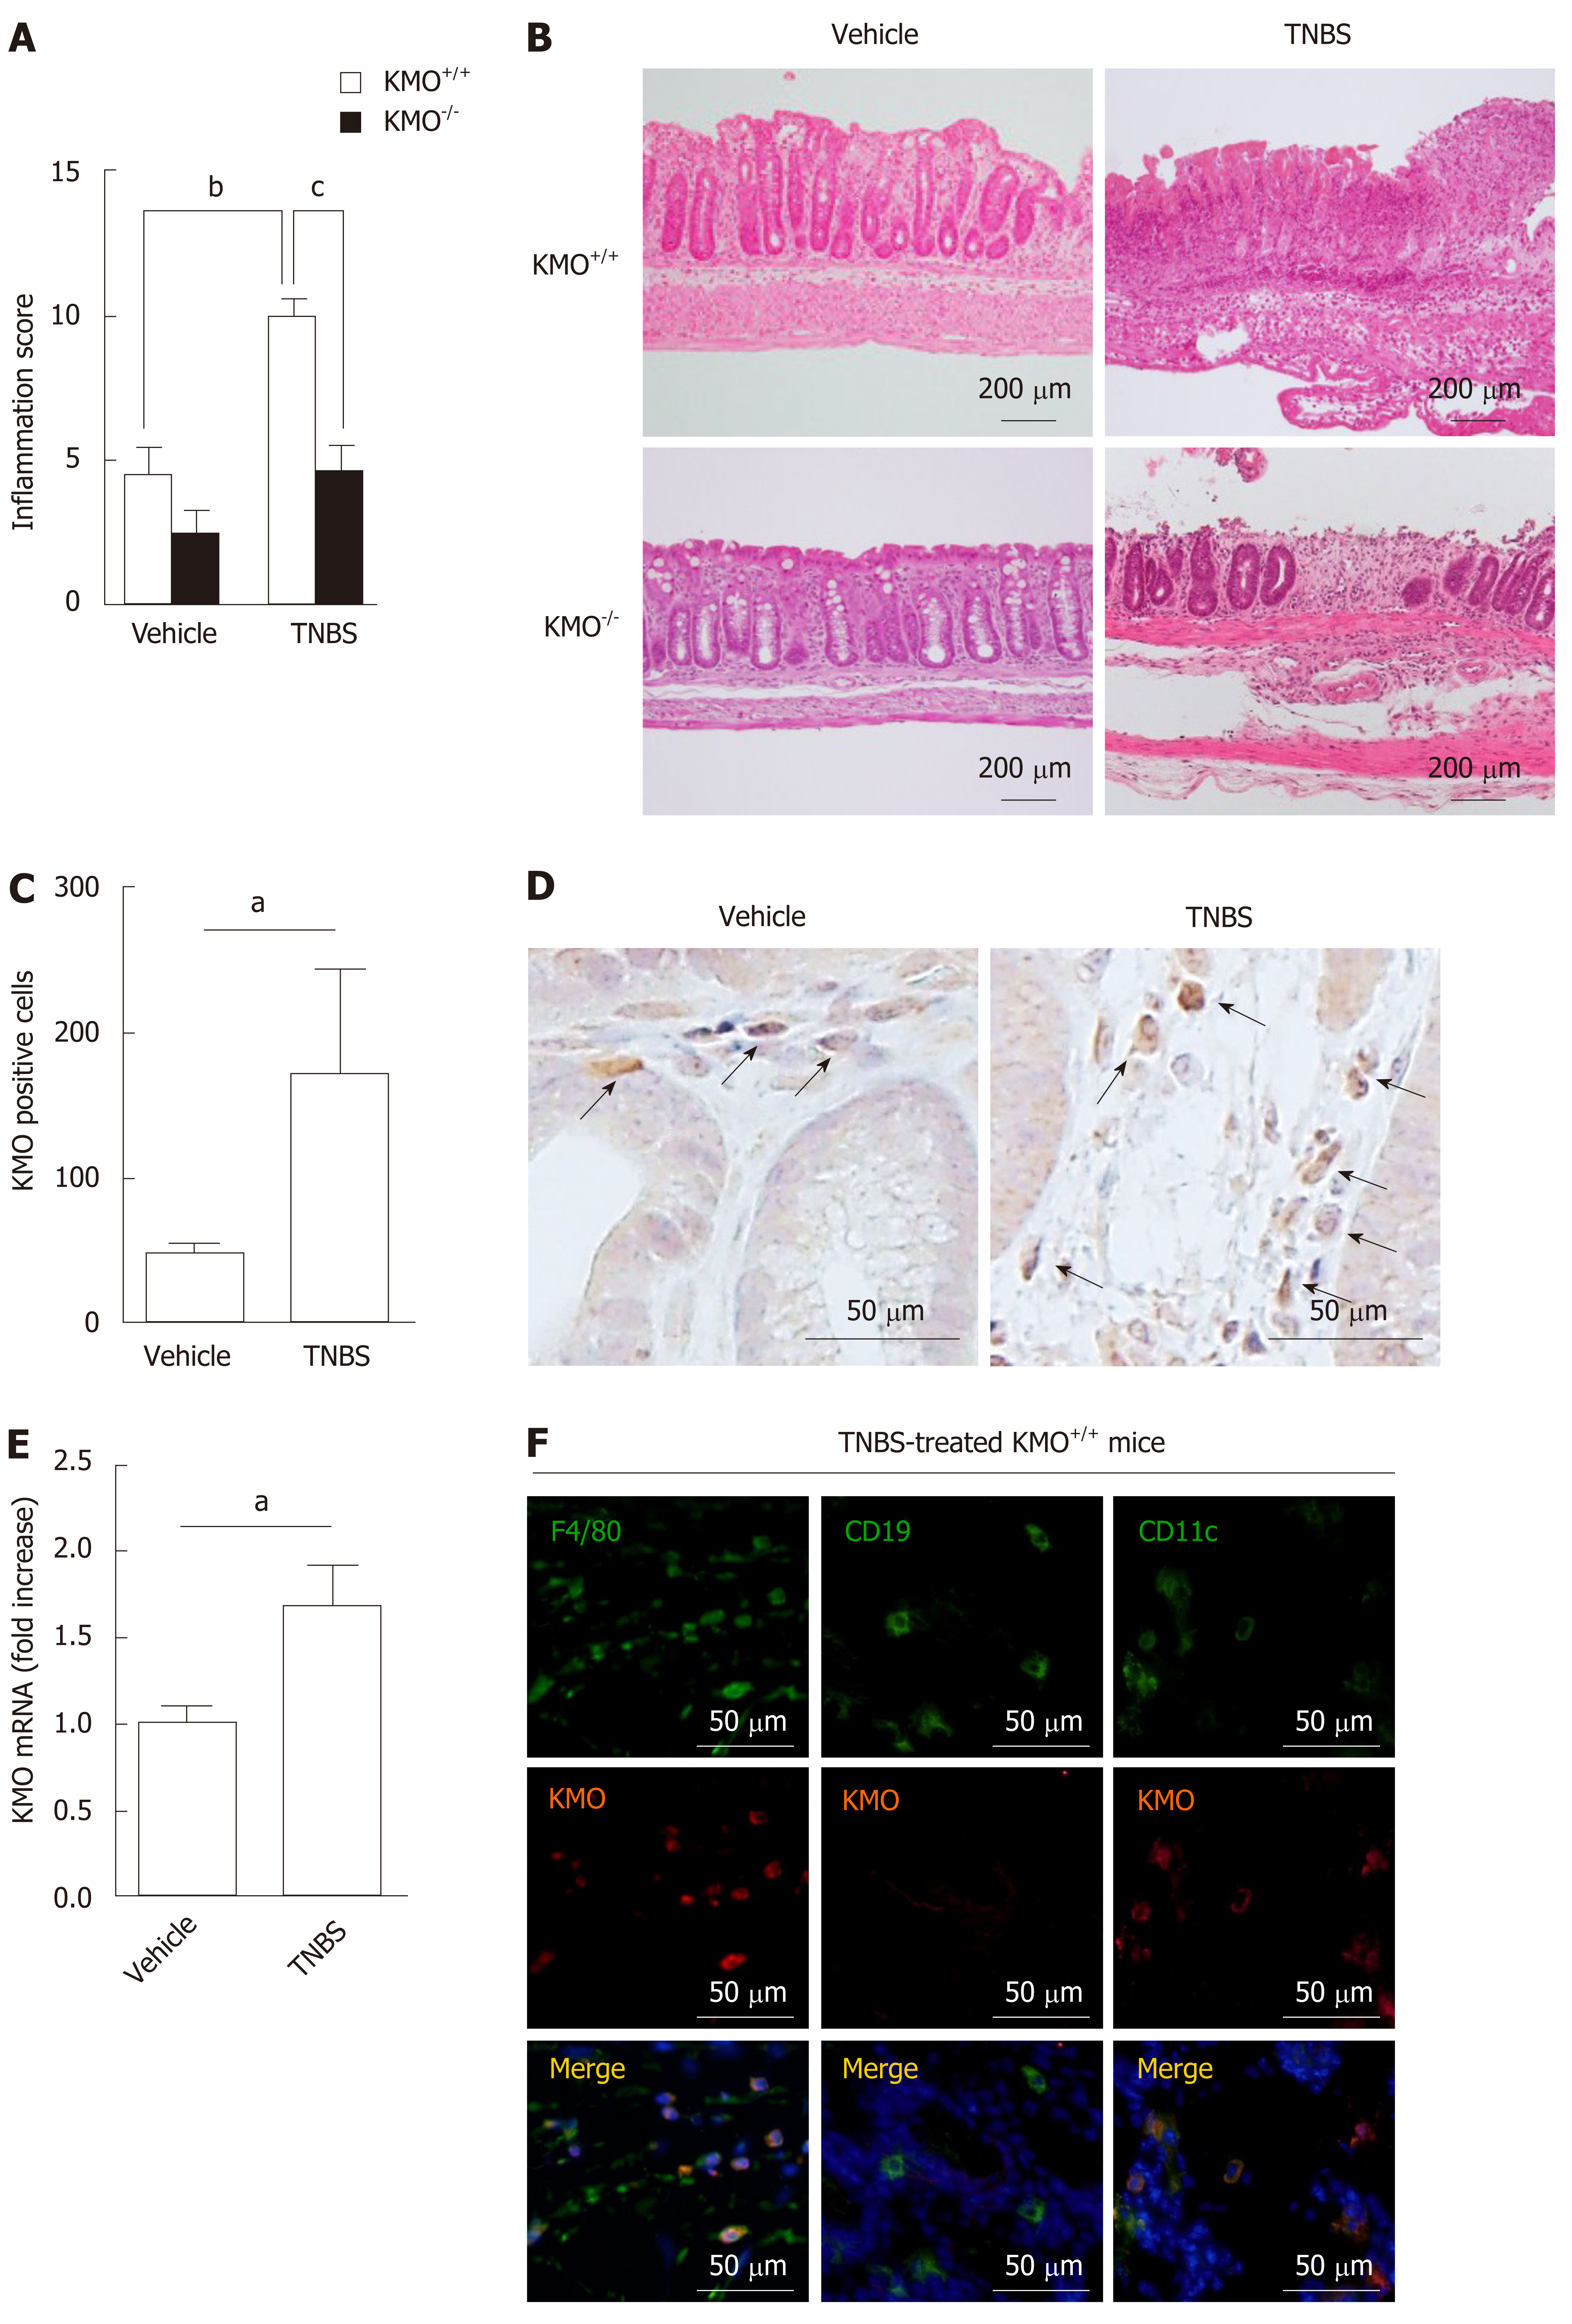
Figure 1 Increased number of F4/80+ KMO+ cells in the colon exacerbates TNBS-induced colitis.
Mice were treated with either TNBS or vehicle, and colons were collected three days after treatment. A: Histological scores determined based on a histological grading as described in Materials and Methods. B: Representative images of H&E-stained colons of the said mice. C, D: The KMO+ cells in the colons of the said mice were counted using immunohistochemical staining for KMO. E: KMO mRNA expression in the colon was determined by quantitative PCR. F: The colons of TNBS-treated mice were stained for F4/80, CD19, CD11c, KMO, and DAPI (nuclei) using immunofluorescence staining. The negative controls for F4/80, CD19, CD11c, and KMO were not stained (Supplementary Figure 2 and 3). aP < 0.05 vs Vehicle group, bP < 0.01 vs Vehicle group, cP < 0.05 vs TNBS-treated KMO+/+ mice group. KMO: Kynurenine 3-monooxygenase; TNBS: Trinitrobenzene sulfonic acid.
Figure 2 TNBS treatment increased the levels of colon L-Kyn in absence of KMO.
KP metabolite levels in the colon of the indicated mice were measured using HPLC. The data are represented as mean ± SE from at least four independent experiments: aP < 0.05 vs Vehicle or TNBS-treated KMO+/+ mice group; bP < 0.01 vs Vehicle or TNBS-treated KMO+/+ mice group; cP < 0.05 vs KMO−/− Vehicle group; and dP < 0.01 vs Vehicle group. KMO: Kynurenine 3-monooxygenase; TNBS: Trinitrobenzene sulfonic acid.
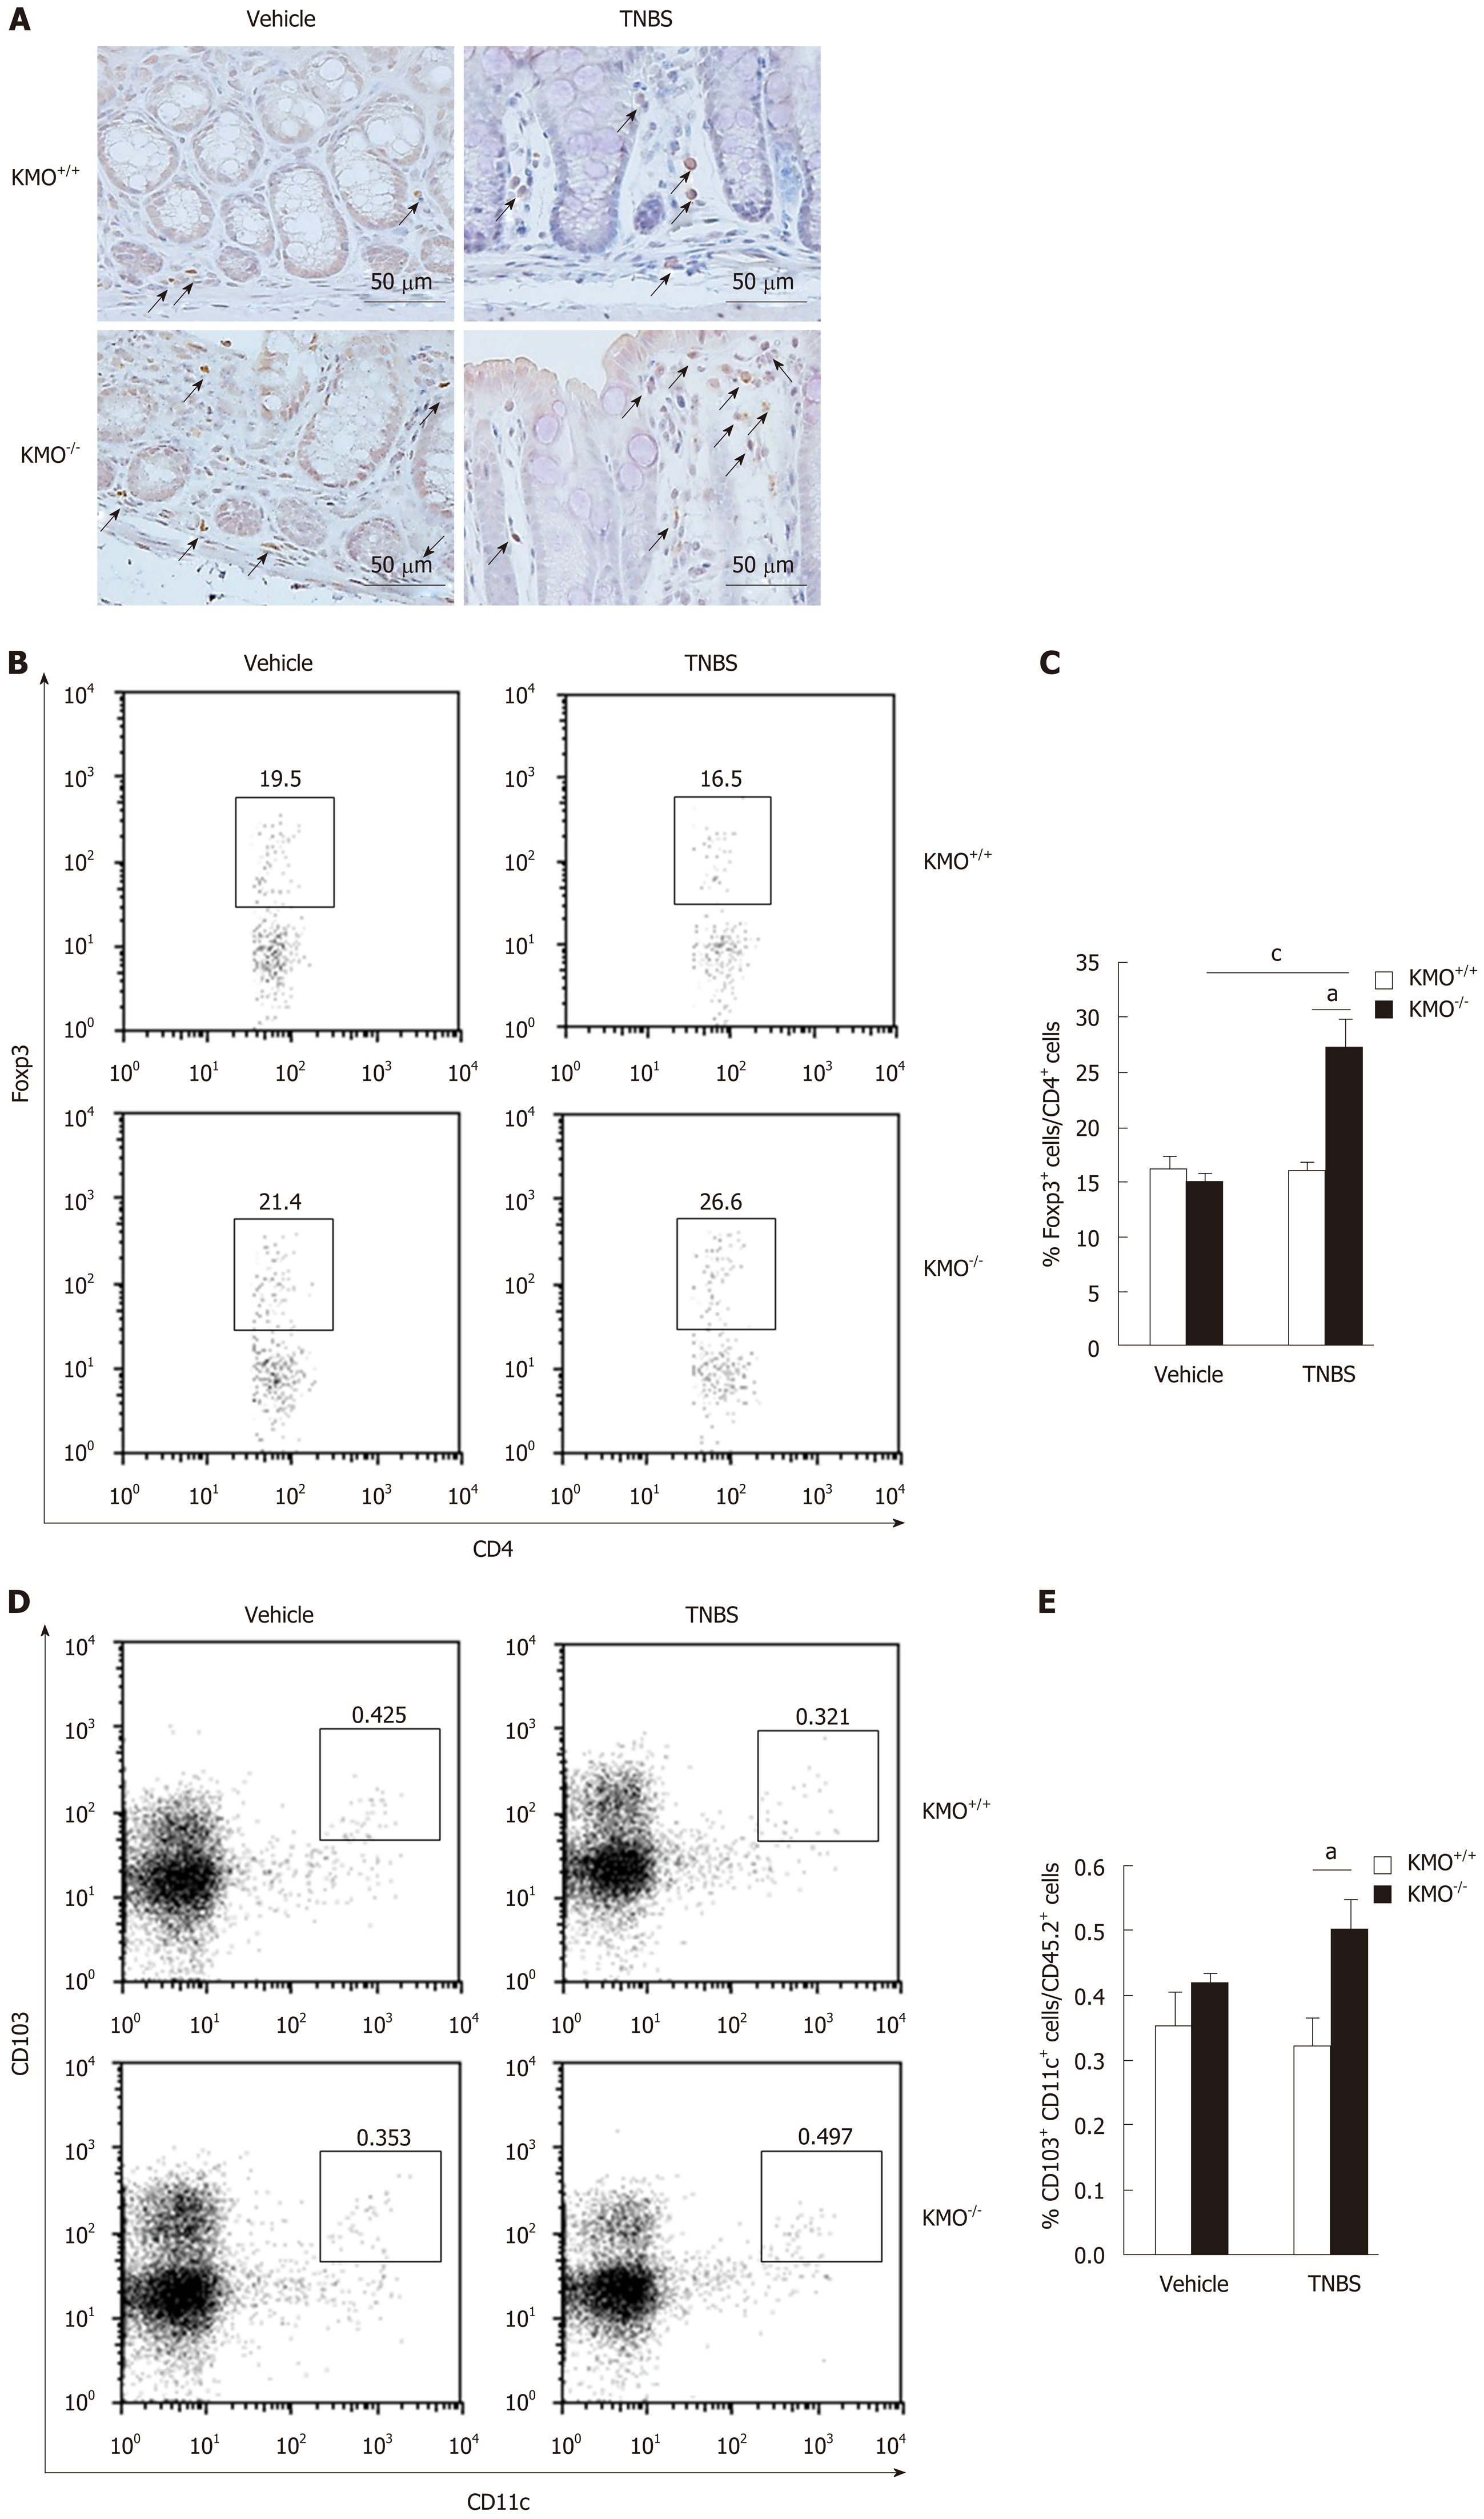
Figure 3 Regulation of KMO is involved in induction of Foxp3+ Treg cells.
A: Serial sections of the colons of the indicated mice were stained for Foxp3 and counterstained with hematoxylin. B–E: CD4+Foxp3+ cells and CD11c+CD103+ cells were analyzed using flow cytometry on colonic LP cells and MLN cells, respectively, from indicated mice, gated on 7-AAD-CD45.2+ cells. Representative flow cytometry plots and cumulative datagraphical summary are depicted. Data are representative of at least five independent experiments with similar results: aP < 0.05 vs TNBS-treated KMO+/+ mice group; cP < 0.05 vs KMO−/− Vehicle group. KMO: Kynurenine 3-monooxygenase; TNBS: Trinitrobenzene sulfonic acid.
Figure 4 TNBS-treatment increased the levels of anti-inflammatory cytokines in the colon of KMO-deficient mice.
A: mRNA levels of TGF-β, IL-10, TNF-α, IFN-γ, and IL-17 in the colons of indicated mice were determined by quantitative PCR. B–C: Serial sections of the colons from vehicle or TNBS-treated KMO+/+ mice and TNBS-treated KMO+/+ or KMO−/− mice were stained for TGF-β, IL-10, Foxp3, and DAPI (nuclei). D: The ratio of TGF-β+ cells or IL-10+ cells to Foxp3+ Treg cells in ILF of TNBS-treated KMO+/+ mice or TNBS-treated KMO−/− mice. Negative controls for of TGF-β, IL-10 and Foxp3 were not stained (Supplementary Figure 3). The data are represented as mean ± SE from at least four independent experiments: aP < 0.05 vs TNBS-treated KMO+/+ mice group; bP < 0.01 vs TNBS-treated KMO+/+ mice group; dP < 0.01 vs KMO−/− Vehicle group. KMO: Kynurenine 3-monooxygenase; TNBS: Trinitrobenzene sulfonic acid; TGF-β: Transforming growth factor-β; IL-10: Interleukin-10; TNF-α: Tumor necrosis factor-α; IFN-γ: Interferon-γ; IL-17: Interleukin-17; Foxp3: Forkhead boxprotein P3.
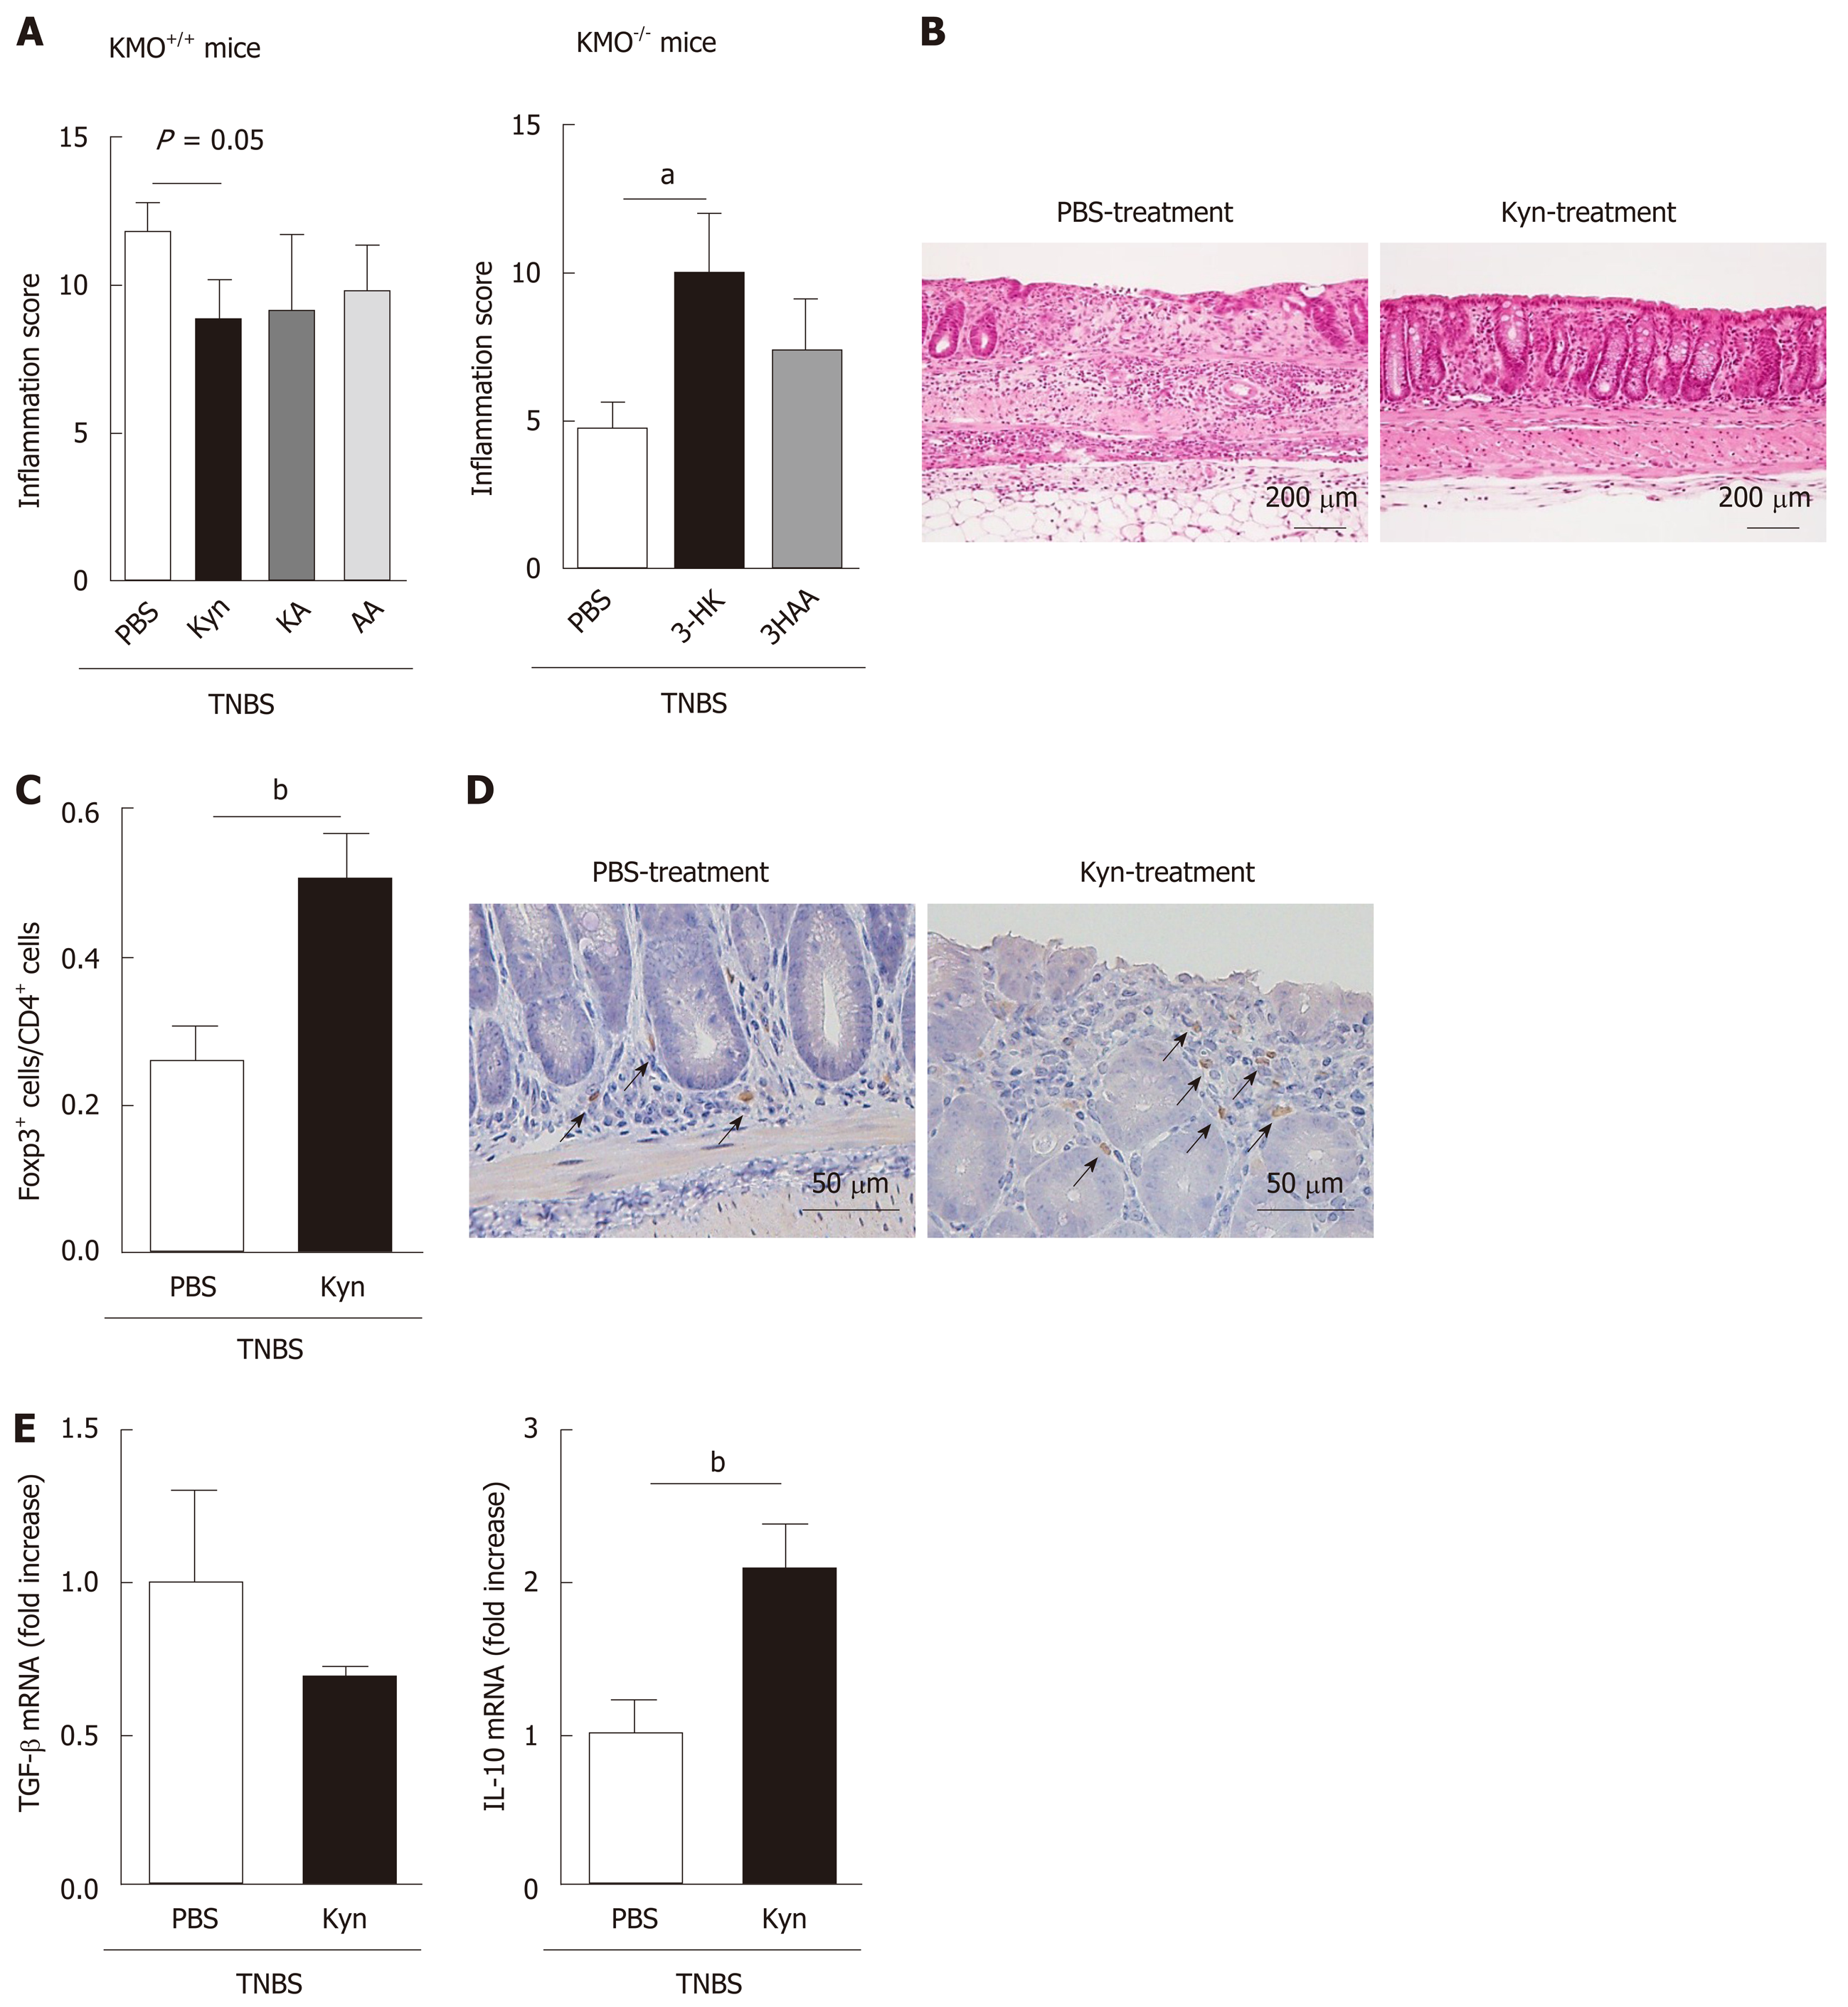
Figure 5 Administration of Kyn improved TNBS-induced colitis.
KMO+/+ and KMO−/− mice were treated with the indicated KP metabolites 12 h after TNBS injection, and the colons were collected on day 3. A: Histological inflammation scores for the colons of KP metabolite-treated mice or PBS-treated mice. B: Representative images of H&E-staining in the colon of indicated mice. C: The ratios of Foxp3+ Treg cells to total CD4+ T cells in the colons of mice. D: Serial sections of the colons of from indicated mice were stained for Foxp3 and counterstained with hematoxylin, allowing indication of Foxp3+ cells. E: The mRNA expression levels of TGF-β and IL-10 were determined by quantitative PCR. The data are represented as mean ± SE from at least four independent experiments: aP < 0.05 vs PBS-treated KMO−/− mice group; bP < 0.01 vs PBS-treated KMO+/+ mice group. KMO: Kynurenine 3-monooxygenase; TNBS: Trinitrobenzene sulfonic acid; Kyn: Kynurenine; KA: Kynurenic acid; AA: Anthranilic acid; 3-HK: 3-hydroxykynurenine; 3-HAA: 3-hydroxyanthranilic acid; TGF-β: Transforming growth factor-β; IL-10: Interleukin-10; Foxp3: Forkhead boxprotein P3.
- Citation: Tashita C, Hoshi M, Hirata A, Nakamoto K, Ando T, Hattori T, Yamamoto Y, Tezuka H, Tomita H, Hara A, Saito K. Kynurenine plays an immunosuppressive role in 2,4,6-trinitrobenzene sulfate-induced colitis in mice. World J Gastroenterol 2020; 26(9): 918-932
- URL: https://www.wjgnet.com/1007-9327/full/v26/i9/918.htm
- DOI: https://dx.doi.org/10.3748/wjg.v26.i9.918


