Copyright
©The Author(s) 2020.
World J Gastroenterol. Feb 14, 2020; 26(6): 627-644
Published online Feb 14, 2020. doi: 10.3748/wjg.v26.i6.627
Published online Feb 14, 2020. doi: 10.3748/wjg.v26.i6.627
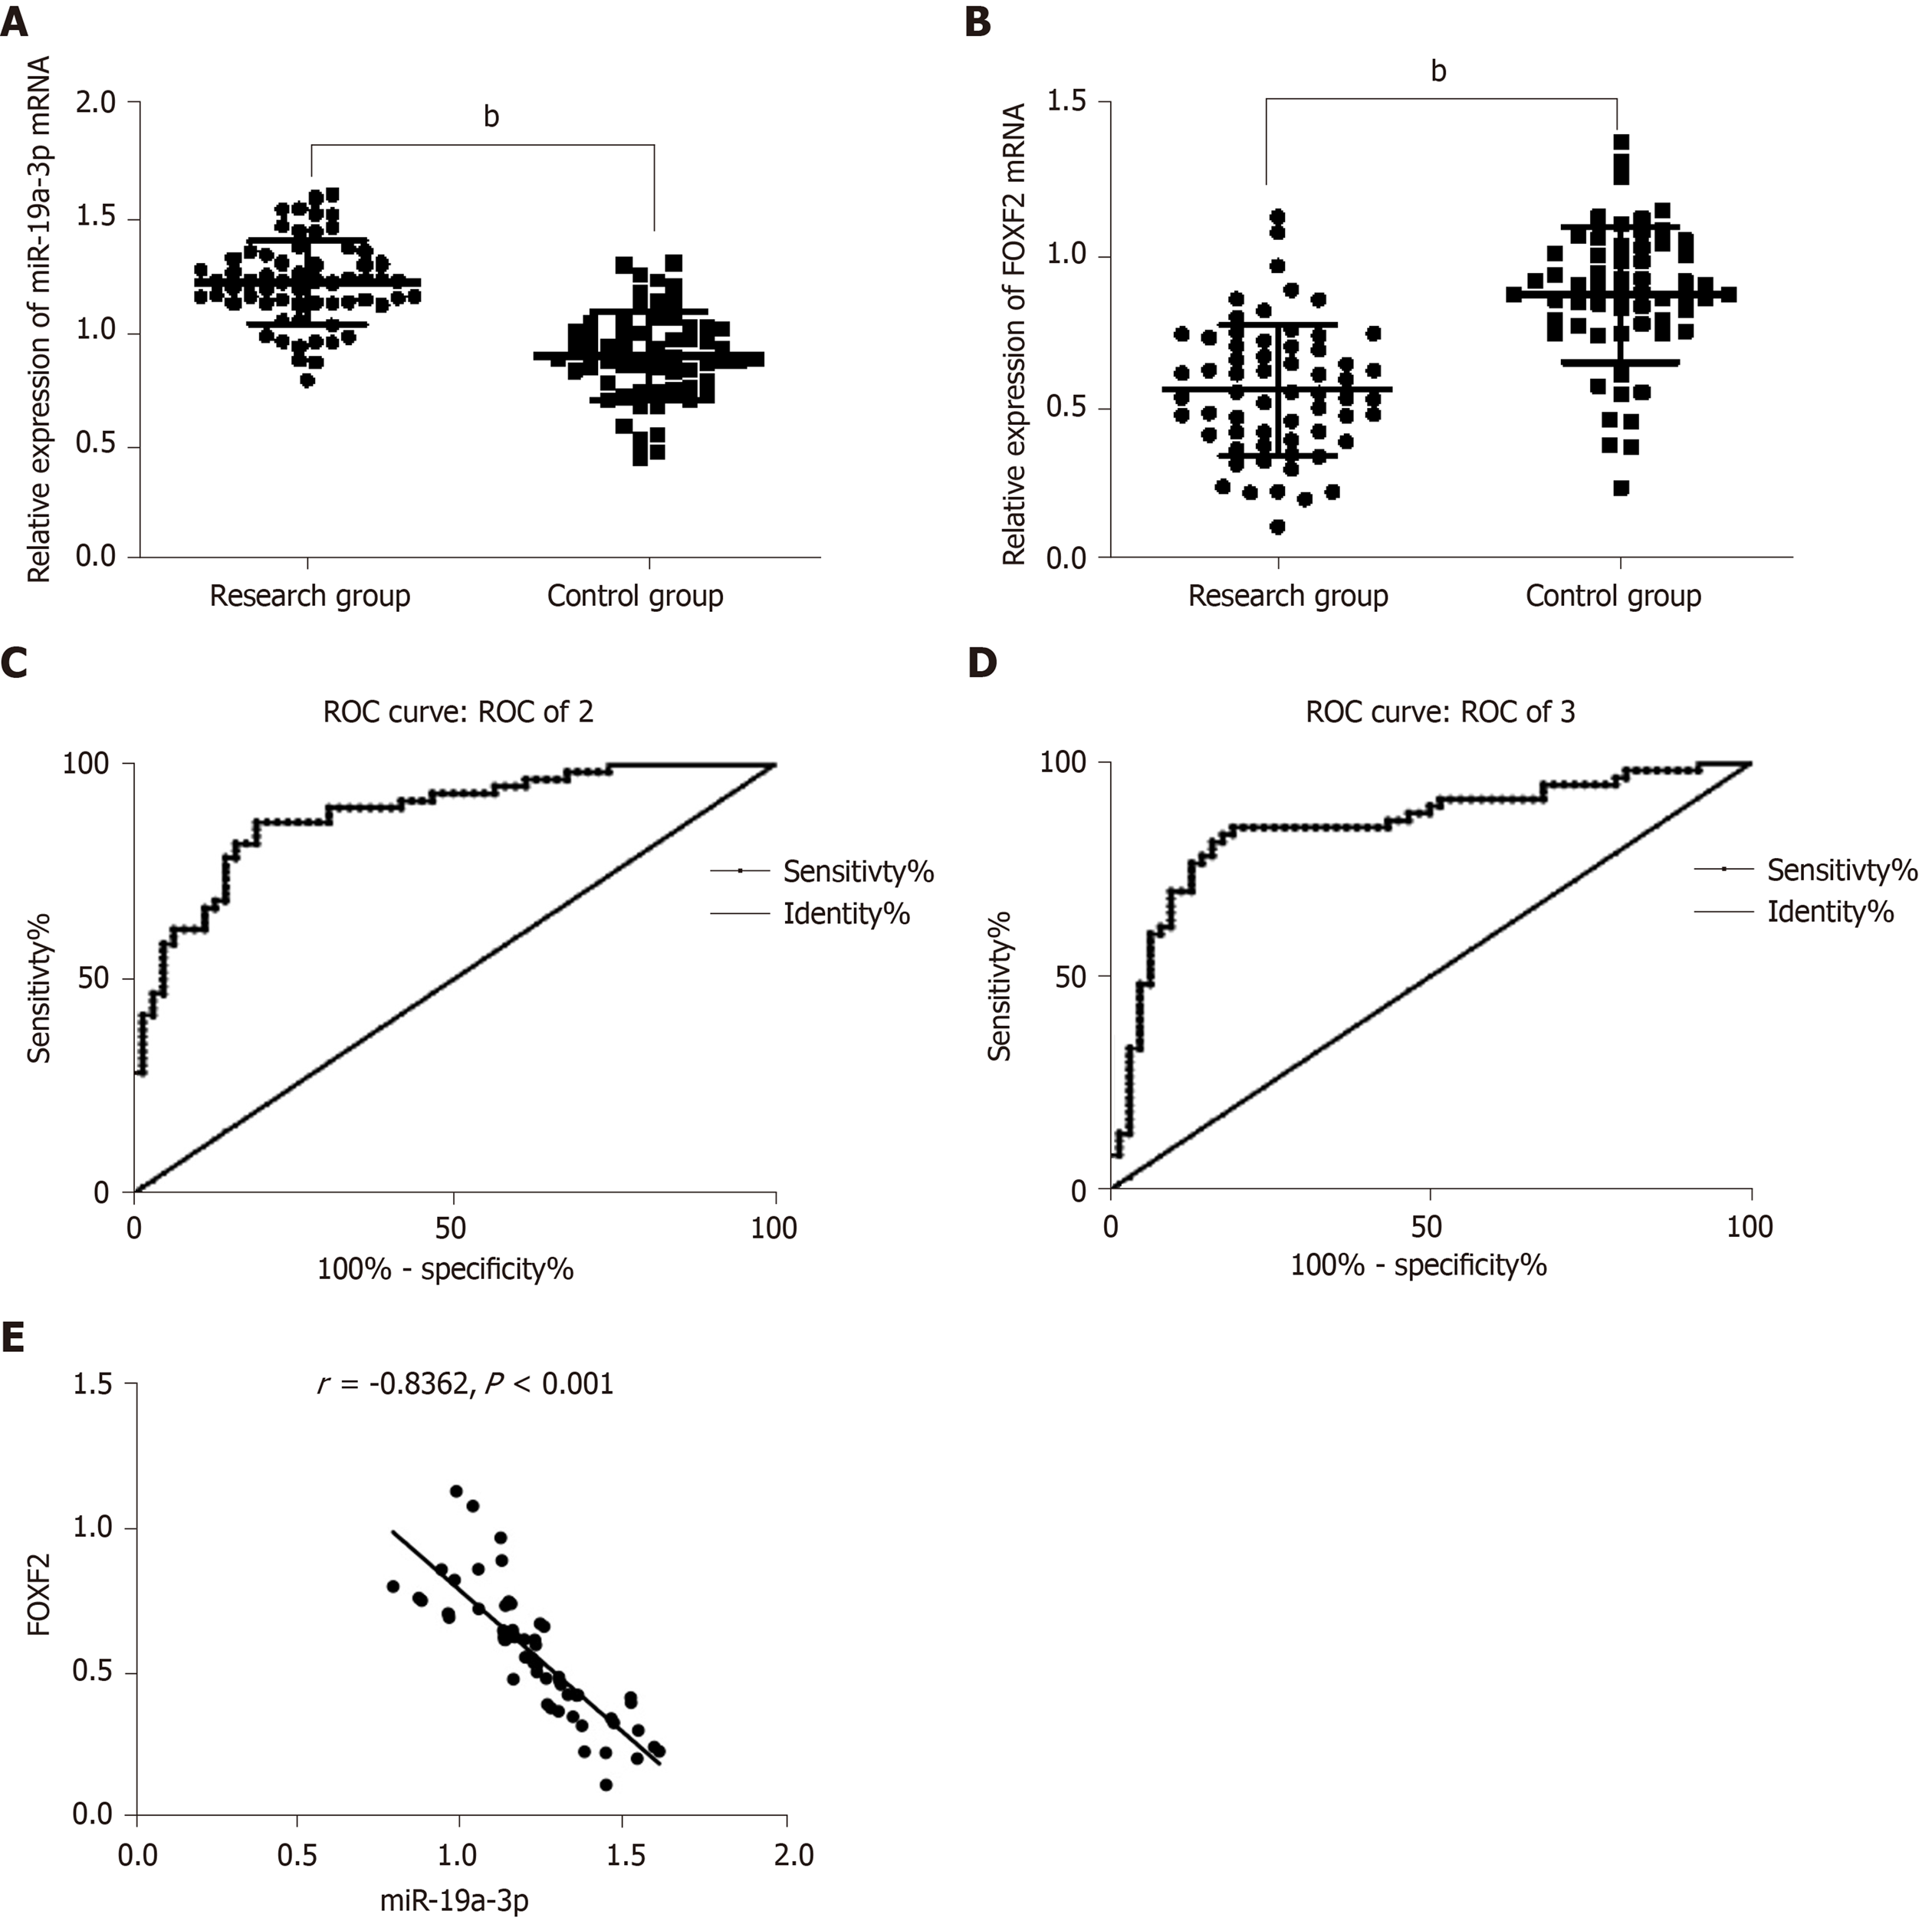
Figure 1 Expression of serum miR-19a-3p and Forkhead box F2 in colorectal cancer patients and their clinical value.
A: The study group showed significantly higher miR-19a-3p expression than the control group, and miR-19a-3p was highly expressed in serum of colorectal cancer (CRC) patients. bP < 0.001; B: The study group showed significantly lower expression of Forkhead box F2 (FOXF2) than the control group, and FOXF2 had low expression in the CRC patients. bP < 0.001; C: The area under the curve of miR-19a-3p was 0.883; D: The area under the curve of FOXF2 was 0.850; E: The expression of serum miR-19a-3p was negatively related to that of FOXF2 in CRC patients (r = -0.836, bP < 0.001). CRC: Colorectal cancer; FOXF2: Forkhead box F2.
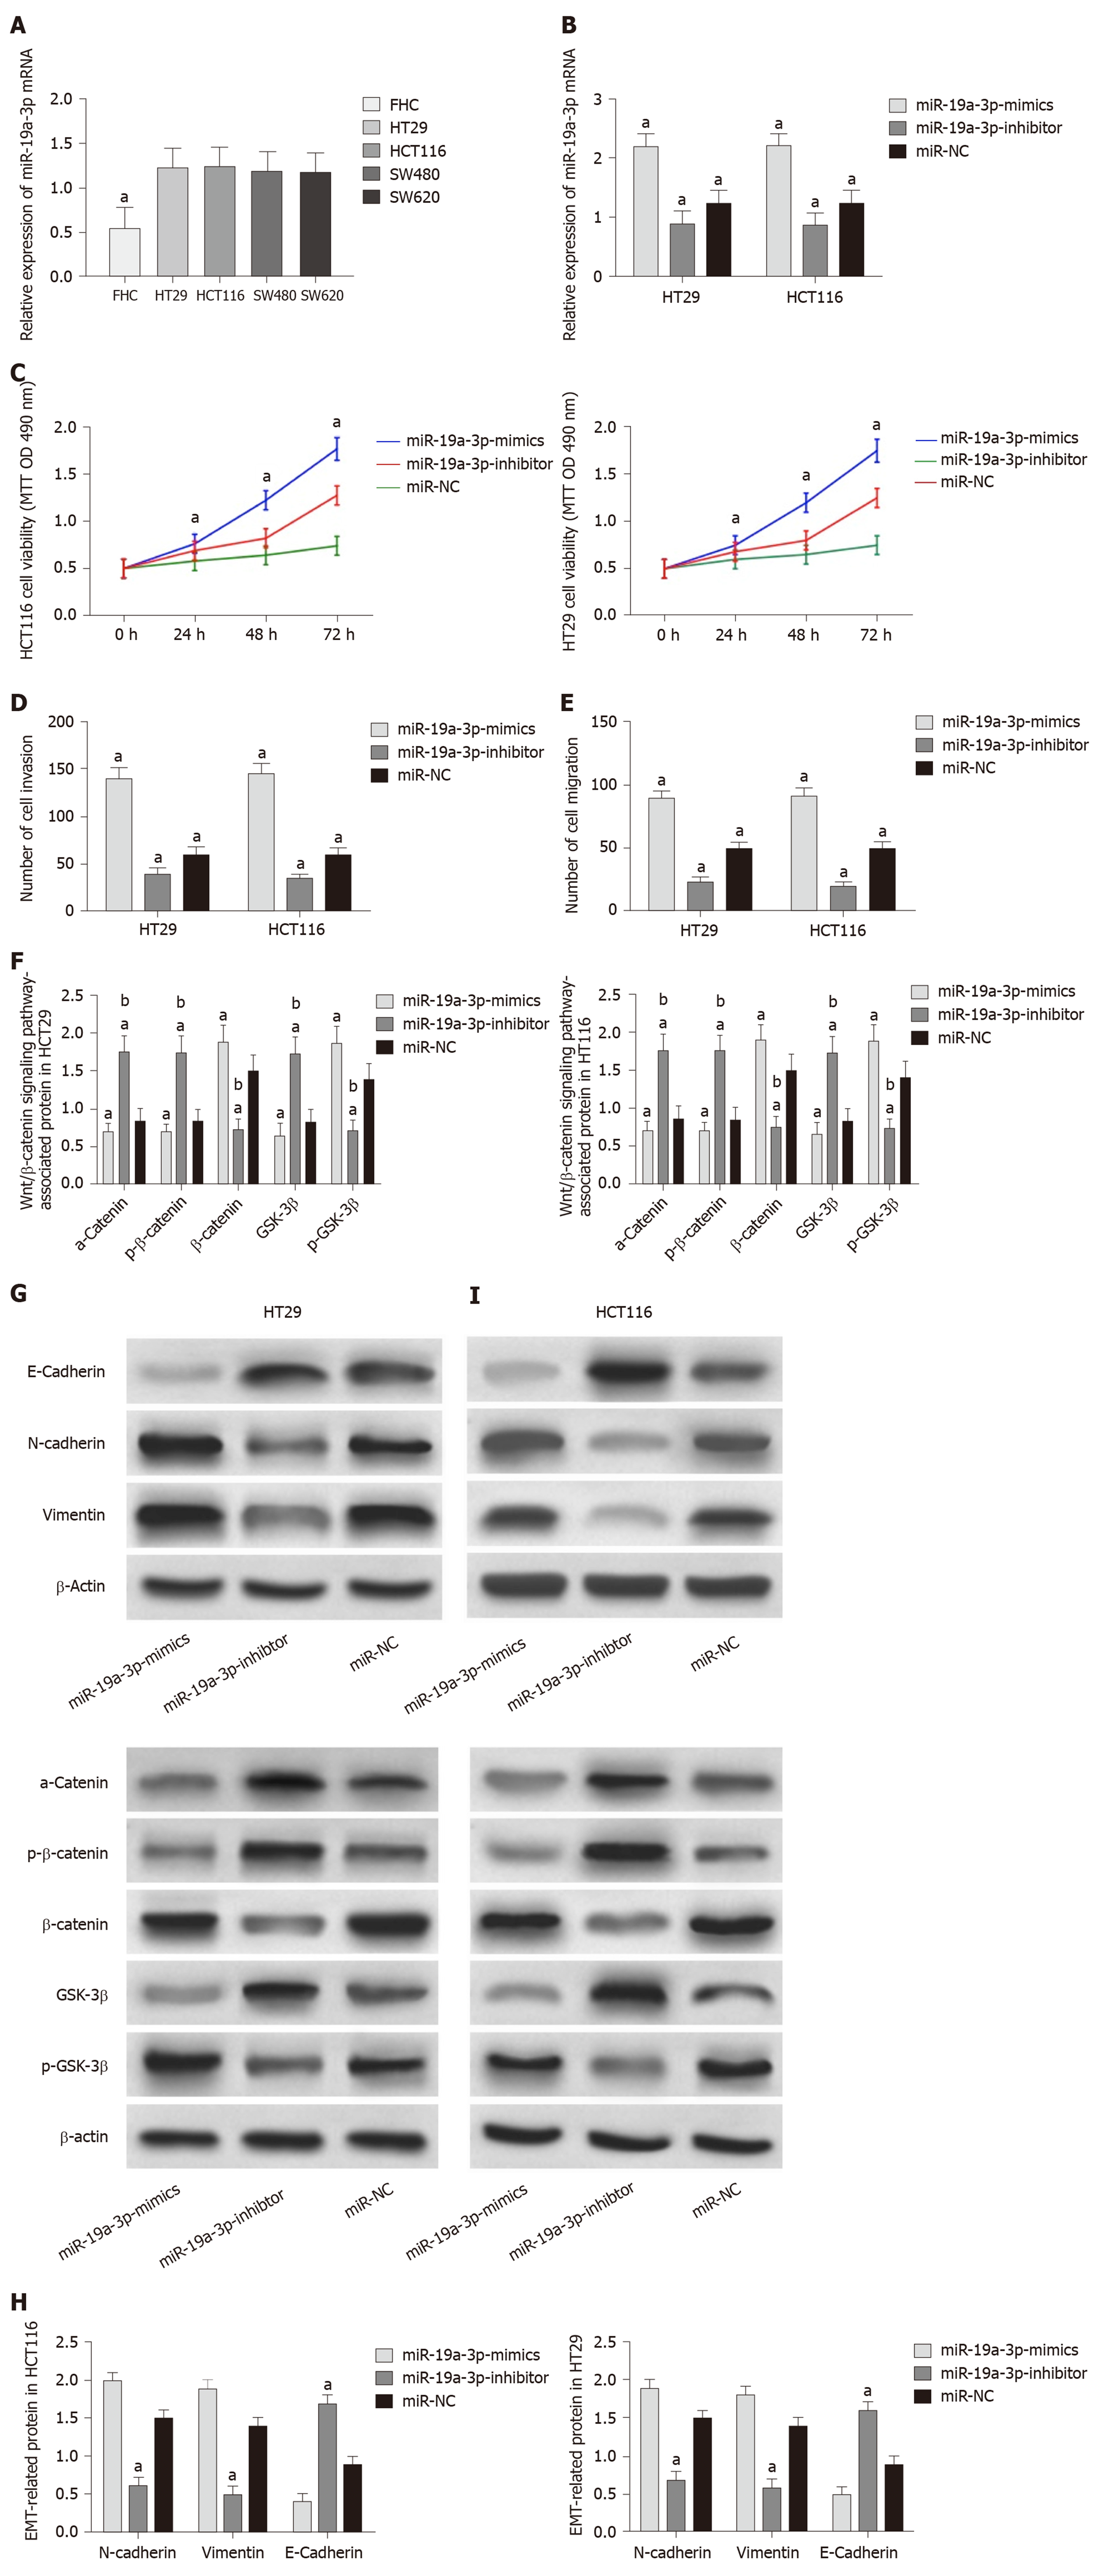
Figure 2 Effects of miR-19a-3p on the proliferation, invasion, migration, and epithelial-mesenchymal transition of colorectal cancer cells.
A: miR-19a-3p was highly expressed in colorectal cancer cells; B: Compared with cells transfected with miR negative control (miR-NC), cells transfected with miR-19a-3p-mimics showed significantly upregulated expression of miR-19a-3p, and cells transfected with miR-19a-3p-inhibitor showed significantly downregulated expression of miR-19a-3p; C: Compared with cells transfected with miR-NC, cells transfected with miR-19a-3p-mimics showed significantly increased cell proliferation ability, and cells transfected with miR-19a-3p-inhibitor showed significantly decreased cell proliferation ability; D: Compared with cells transfected with miR-NC, cells transfected with miR-19a-3p-mimics showed significantly increased cell invasion ability, and cells transfected with miR-19a-3p-inhibitor showed significantly decreased cell invasion ability; E: Compared with cells transfected with miR-NC, cells transfected with miR-19a-3p-mimics showed significantly increased cell migration ability, and cells transfected with miR-19a-3p-inhibitor showed significantly decreased cell migration ability; F: Compared with cells transfected with miR-NC, cells transfected with miR-19a-3p-mimics showed significantly upregulated expression of p-GSK-3β and β-catenin, and significantly downregulated expression of GSK-3β and p-β-catenin, and cells transfected with miR-19a-3p-inhibitor showed significantly downregulated expression of p-GSK-3β and β-catenin, and significantly upregulated expression of GSK-3β and p-β-catenin; G: Western blot map; H: Compared with cells transfected with miR-NC, cells transfected with miR-19a-3p-mimics showed significantly upregulated expression of N-cadherin and vimentin, and significantly downregulated expression of E-cadherin, and cells transfected with miR-19a-3p-inhibitor showed significantly downregulated expression of N-cadherin and vimentin and significantly upregulated expression of E-cadherin; I: Western blot results. Note: a indicates that in comparison with cells transfected with miR-NC, bP < 0.001; b indicates that in comparison with cells transfected with miR-19a-3p-inhibitor, bP < 0.001. miR-NC: MiR negative control.
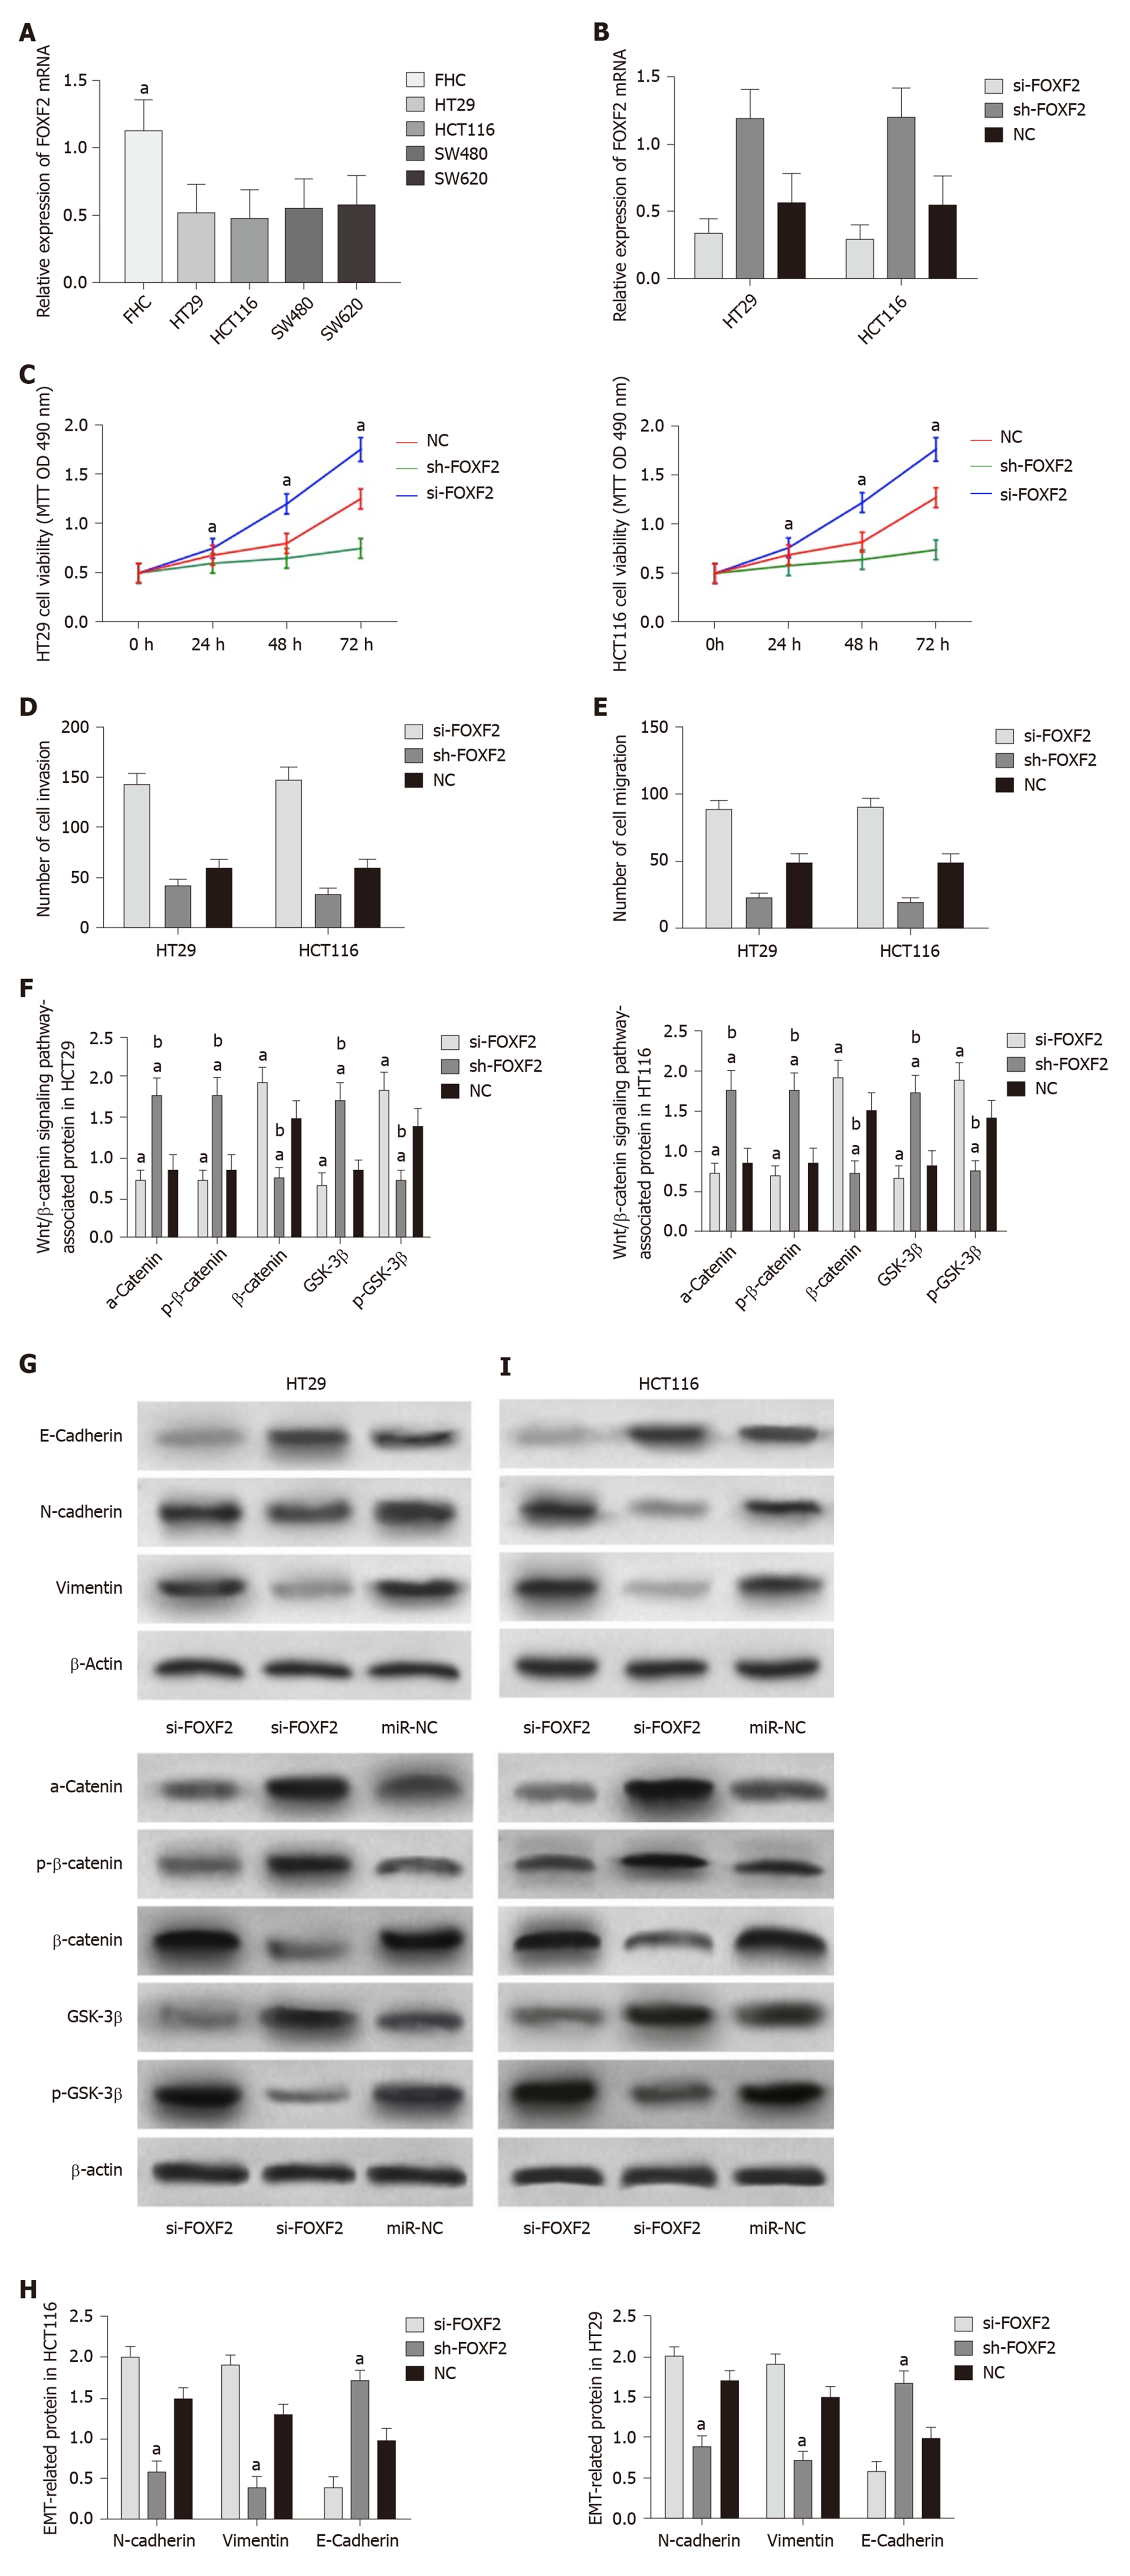
Figure 3 Effects of Forkhead box F2 on proliferation, invasion, migration and epithelial-mesenchymal transition of colorectal cancer cells.
A: Forkhead box F2 (FOXF2) had low expression in colorectal cancer cells; B: Compared with cells transfected with MiR negative control (miR-NC), cells transfected with sh-FOXF2 showed significantly upregulated expression of FOXF2, and cells transfected with si-FOXF2 showed significantly down-regulated expression of FOXF2; C: Compared with cells transfected with miR-NC, cells transfected with si-FOXF2 showed significantly stronger cell proliferation ability, while cells transfected with sh-FOXF2 showed significantly weaker cell proliferation ability; D: Compared with cells transfected with miR-NC, cells transfected with si-FOXF2 showed significantly stronger cell invasion ability, while cells transfected with sh-FOXF2 showed significantly weaker cell invasion ability; E: Compared with cells transfected with miR-NC, cells transfected with si-FOXF2 showed significantly stronger cell invasion ability, while cells transfected with sh-FOXF2 showed significantly weaker cell invasion ability; F: Compared with cells transfected with miR-NC, cells transfected with si-FOXF2 showed significantly up-regulated expression of p-GSK-3β and β-catenin, and significantly down-regulated expression of GSK-3β and p-β-catenin, and cells transfected with Sh-FOXF2 showed significantly downregulated expression of p-GSK-3β and β-catenin, and significantly upregulated expression of GSK-3β and p-β-catenin; G: Western Blot results; H: Compared with cells transfected with miR-NC, cells transfected with si-FOXF2 showed significantly up-regulated expression of N-cadherin and vimentin, and significantly down-regulated expression of E-cadherin, and cells transfected with sh-FOXF2 showed significantly down-regulated expression of N-cadherin and vimentin and significantly up-regulated expression of E-cadherin; I: Western blot results. Note: a indicates that in comparison with cells transfected with miR-NC, bP < 0.001; b indicates that in comparison with cells transfected with sh-FOXF2, bP < 0.001. FOXF2: Forkhead box F2; miR-NC: MiR negative control.
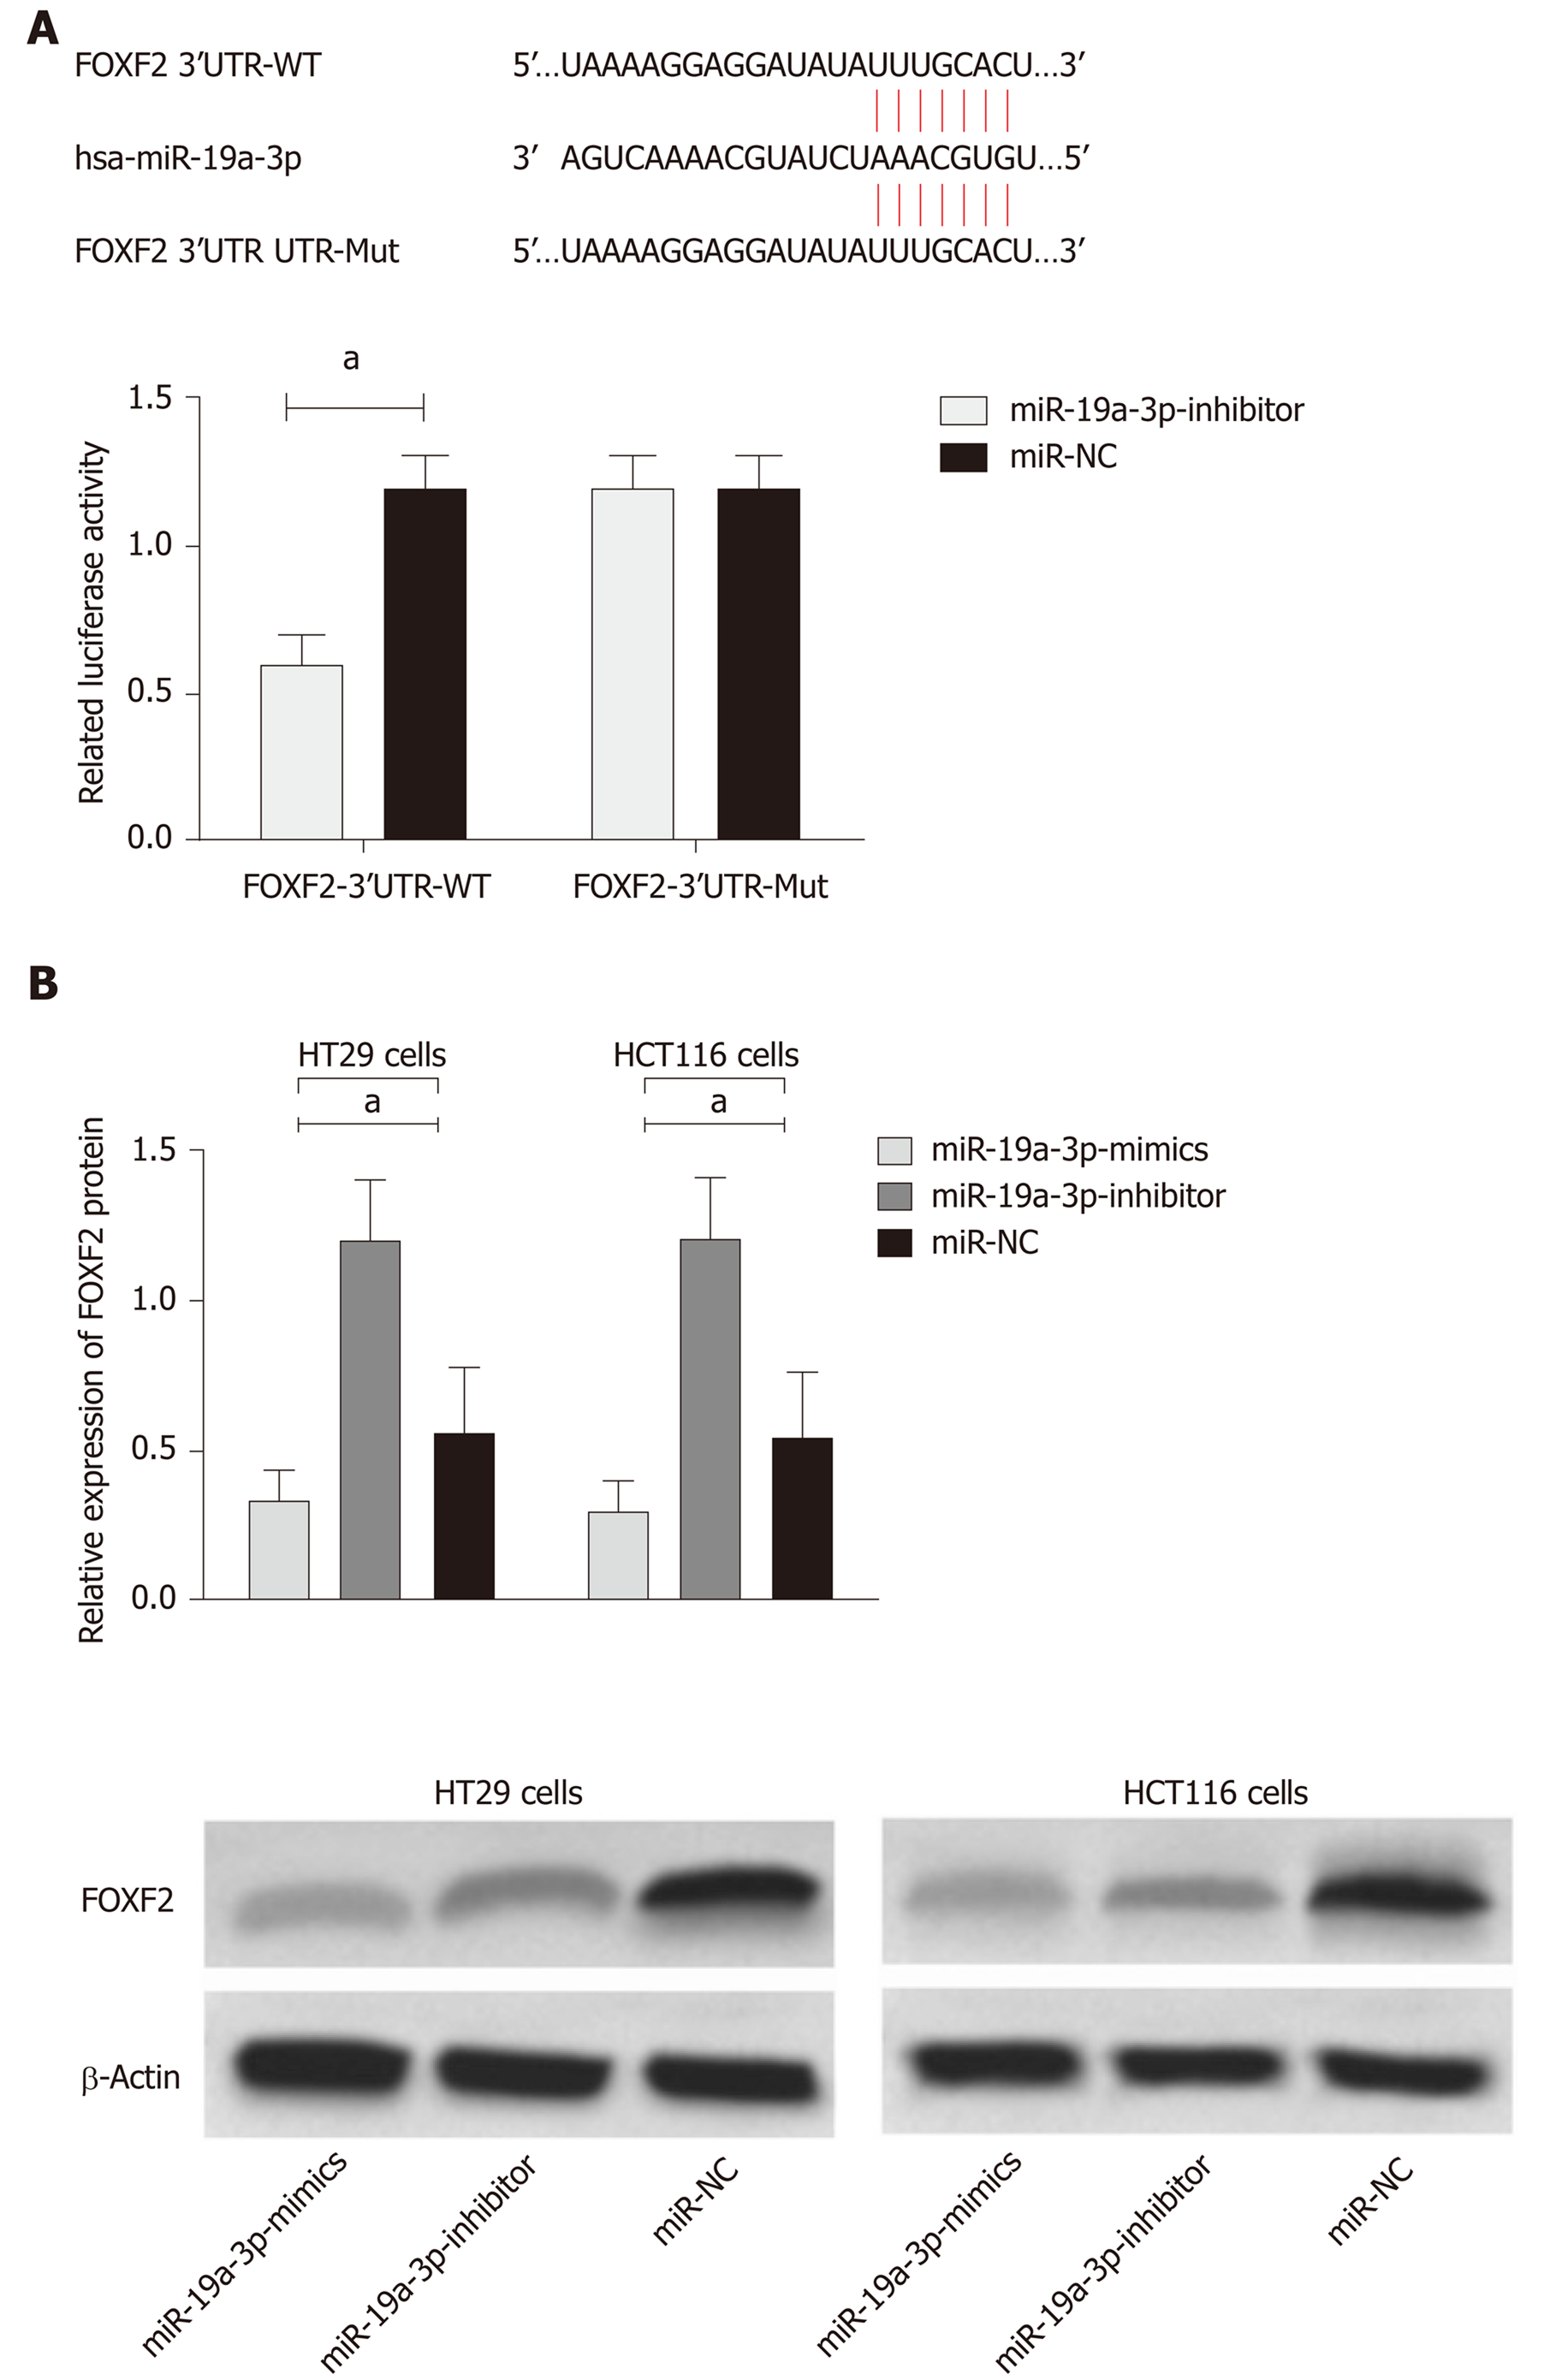
Figure 4 Luciferase detection.
A: Binding sites between miR-19a-3p and Forkhead box F2, and relative luciferase activity - dual luciferase reporter assay; B: Expression of Forkhead box F2 in HT29 and HCT116 cells after transfection. aP < 0.001.
Figure 5 Rescue experiment.
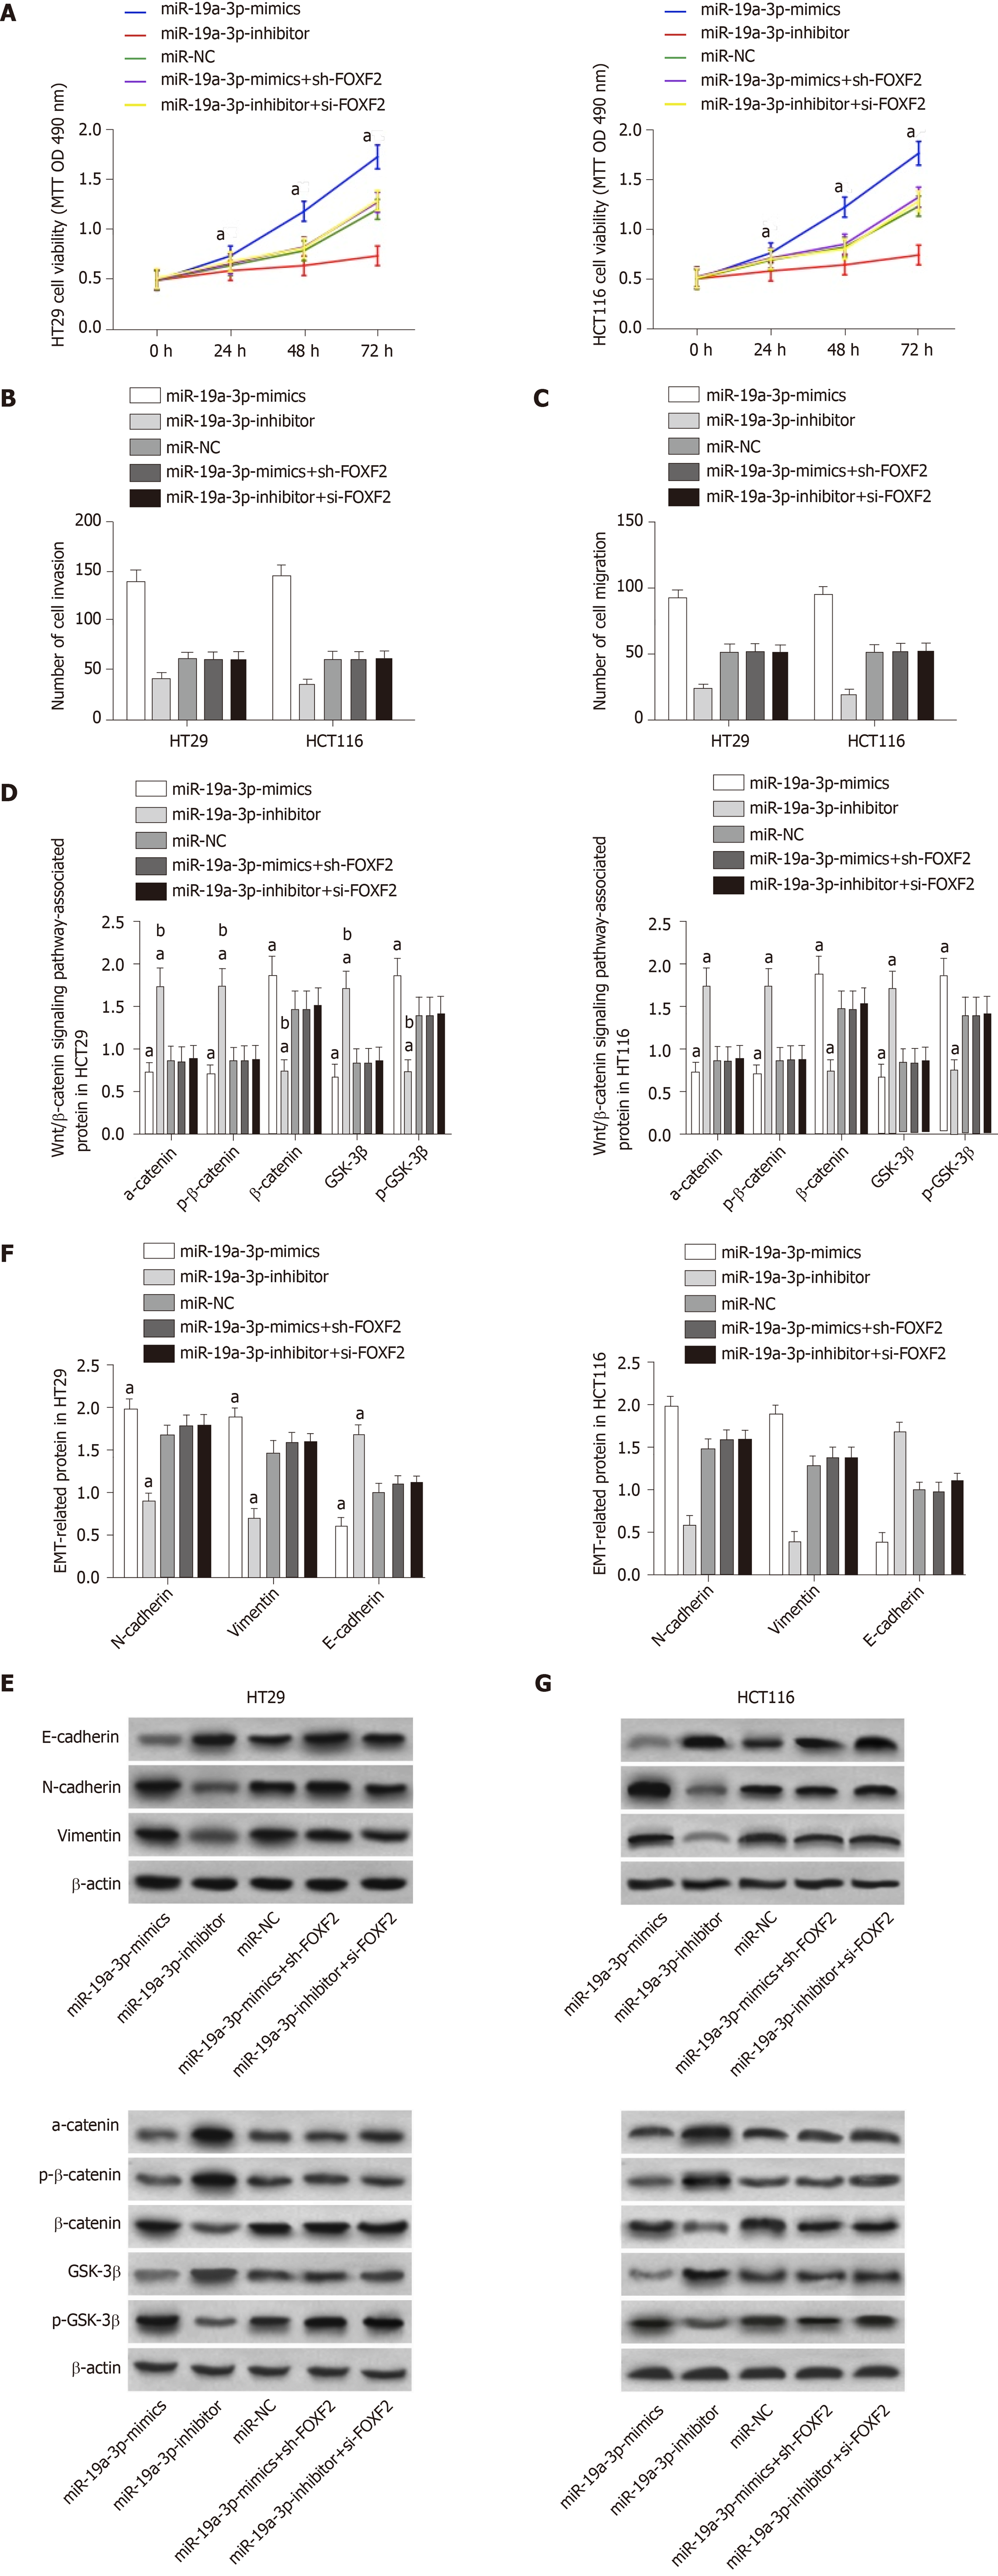
A: Cell proliferation ability after transfection with miR-19a-3p-mimics + sh-Forkhead box F2 (FOXF2) or miR-19a-3p-inhibitor + si-FOXF2; B: Cell invasion ability after transfection with miR-19a-3p-mimics + sh-FOXF2 or miR-19a-3p-inhibitor + si-FOXF2; C: Cell migration ability after transfection with miR-19a-3p-mimics + sh-FOXF2 or miR-19a-3p-inhibitor + si-FOXF2; D: Expression of p-GSK-3β, β-catenin, α-catenin,, GSK-3β and p-β-catenin in cells transfected with miR-19a-3p-mimics + sh-FOXF2 or miR-19a-3p-inhibitor + si-FOXF2; E: Western blot map; F: Expression of E-cadherin, N-cadherin, and vimentin in cells transfected with miR-19a-3p-mimics+sh-FOXF2 or miR-19a-3p-inhibitor+si-FOXF2; G: Western blot map; aP < 0.05 vs cells transfected with miR- negative control or miR-19a-3p-mimics + sh-FOXF2 or with cells transfected with miR-19a-3p-inhibitor+si-FOXF2, bP < 0.001 vs cells transfected with miR-19a-3p-inhibitor. FOXF2: Forkhead box F2.
Figure 6 Effects of inhibiting miR-19a-3p expression on tumor growth in nude mice.
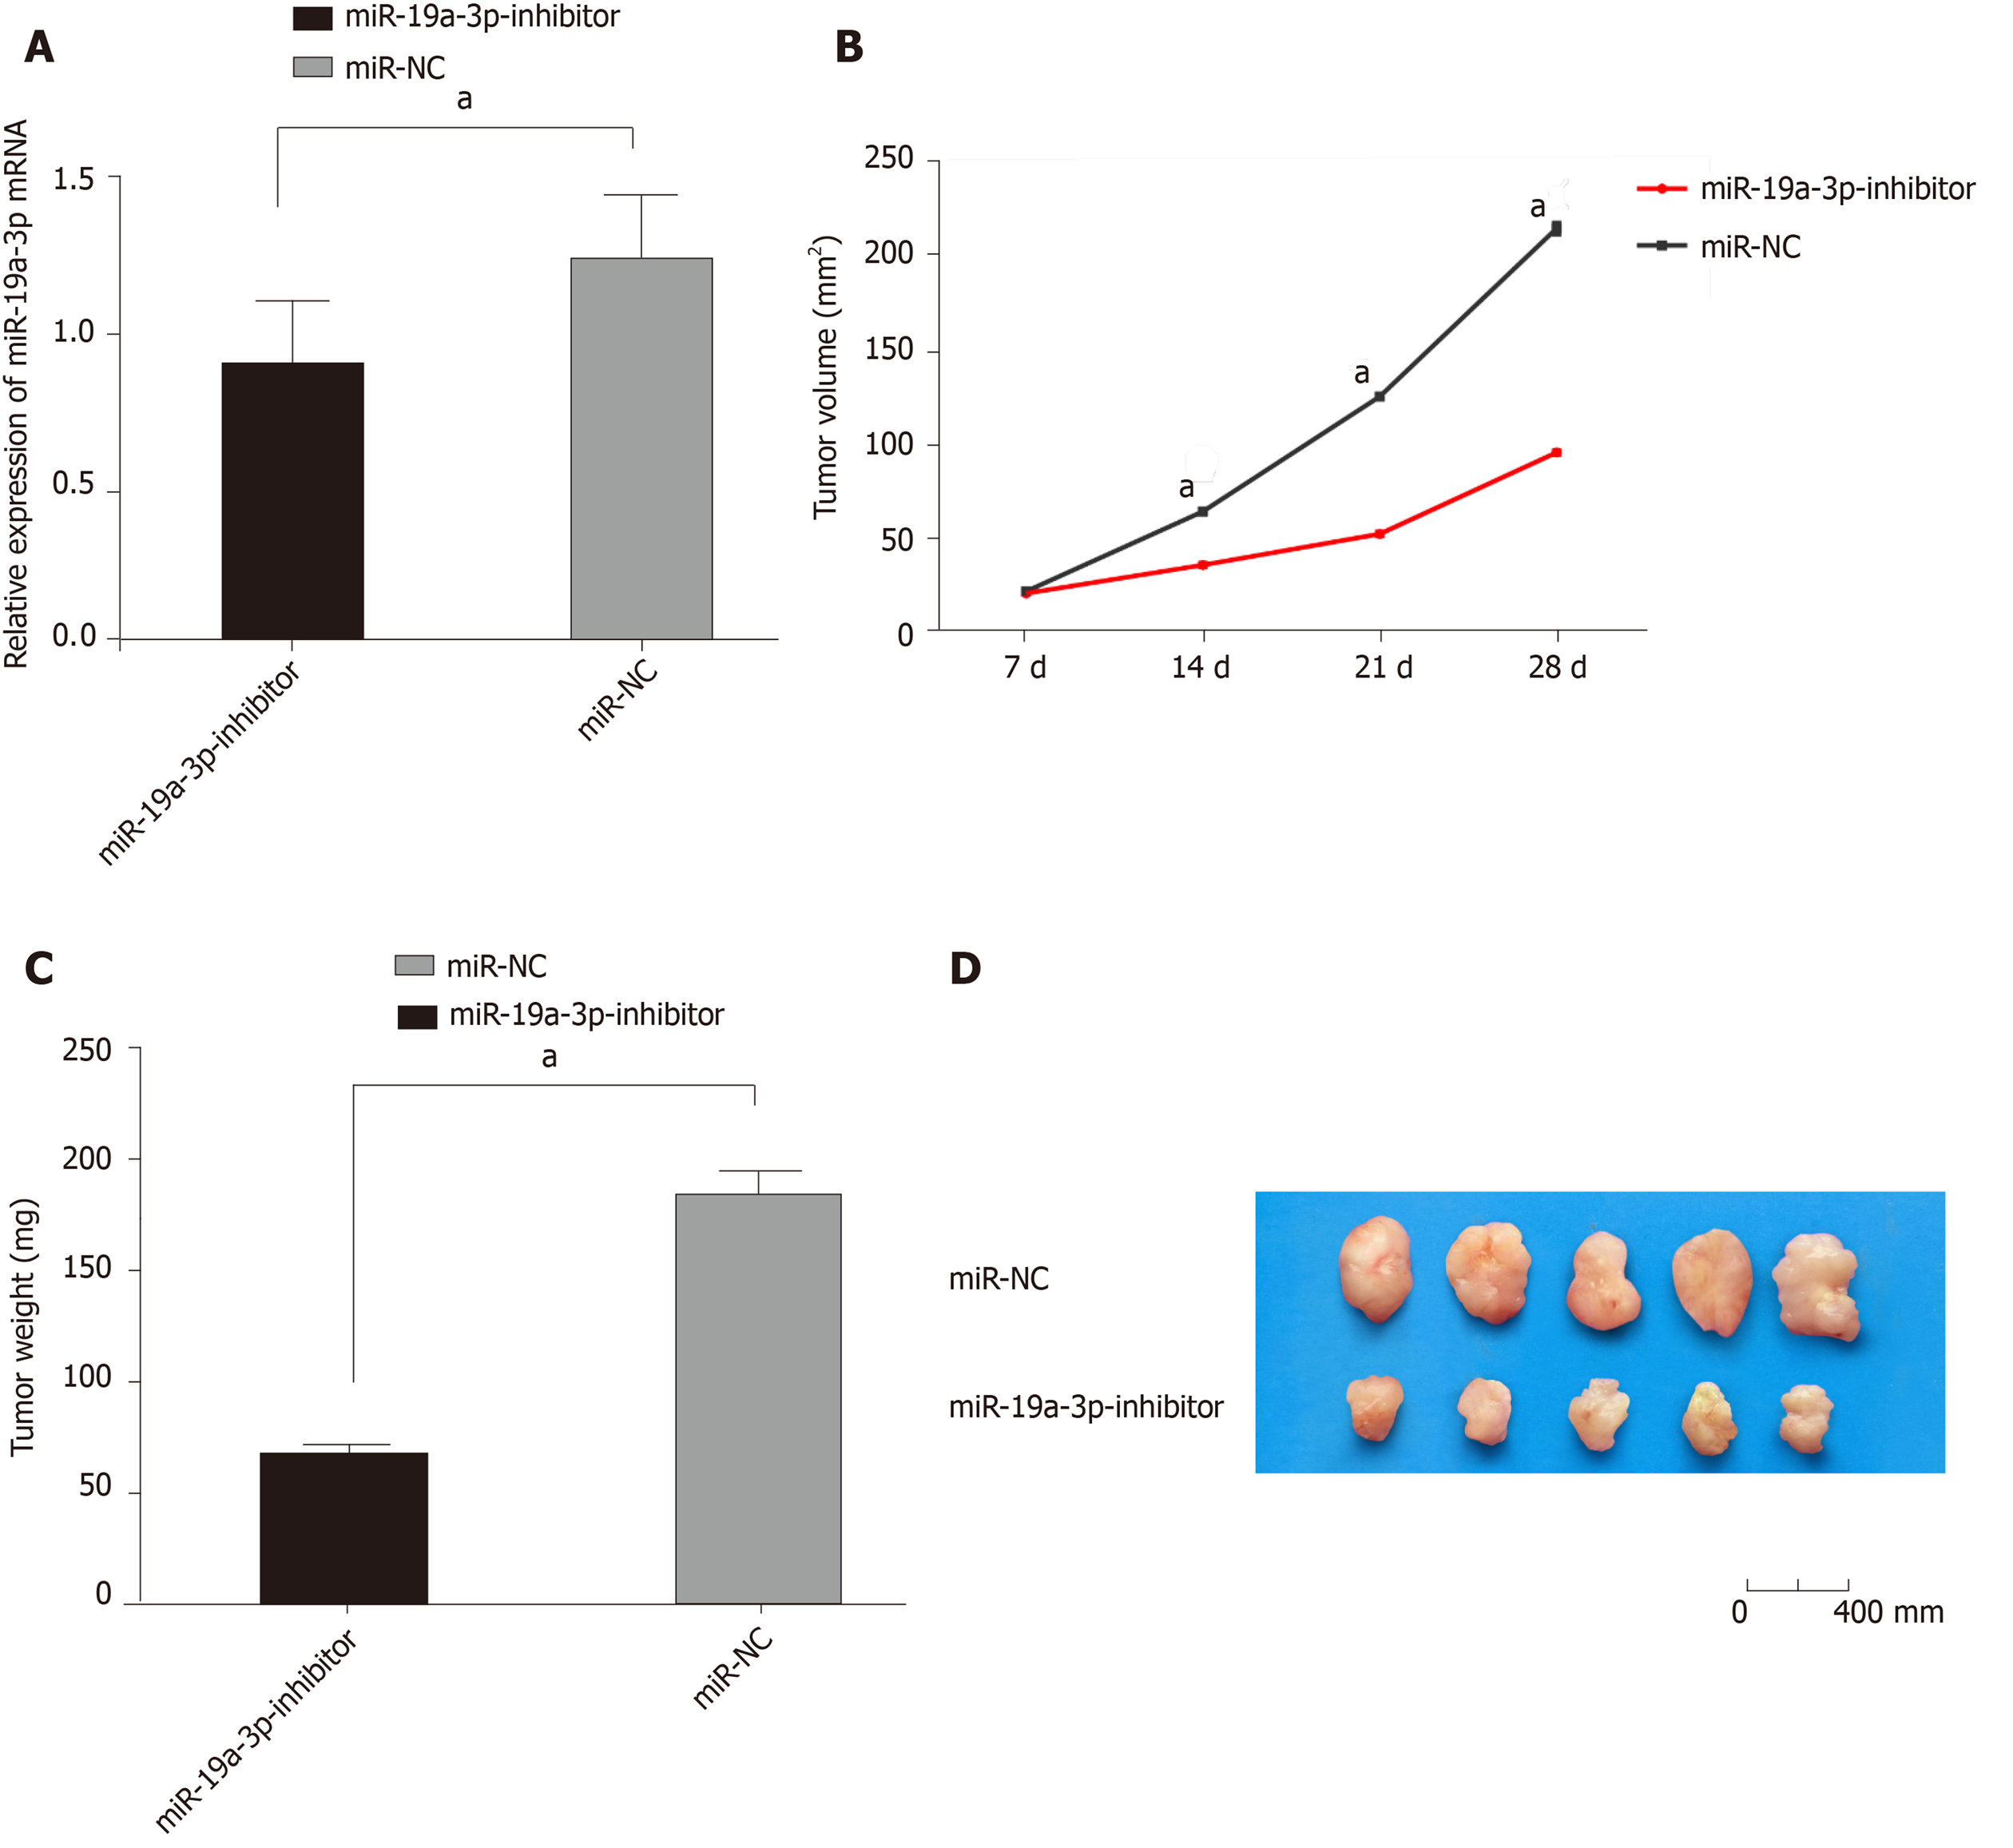
A: Comparison between the two groups revealed that tumor tissues with miR-19a-3p-inhibitor showed lower expression of miR-19a-3p; B: Comparison between the two groups revealed that the mice with miR-19a-3p-inhibitor showed slower tumor growth rate; C: Comparison between the two groups revealed that the mice with miR-19a-3p-inhibitor showed lighter tumor weight; D: Comparison between the two groups revealed that the mice with miR-19a-3p-inhibitor showed smaller tumor size. aP < 0.001.
- Citation: Yu FB, Sheng J, Yu JM, Liu JH, Qin XX, Mou B. MiR-19a-3p regulates the Forkhead box F2-mediated Wnt/β-catenin signaling pathway and affects the biological functions of colorectal cancer cells. World J Gastroenterol 2020; 26(6): 627-644
- URL: https://www.wjgnet.com/1007-9327/full/v26/i6/627.htm
- DOI: https://dx.doi.org/10.3748/wjg.v26.i6.627


