Copyright
©The Author(s) 2020.
World J Gastroenterol. Oct 21, 2020; 26(39): 6057-6073
Published online Oct 21, 2020. doi: 10.3748/wjg.v26.i39.6057
Published online Oct 21, 2020. doi: 10.3748/wjg.v26.i39.6057
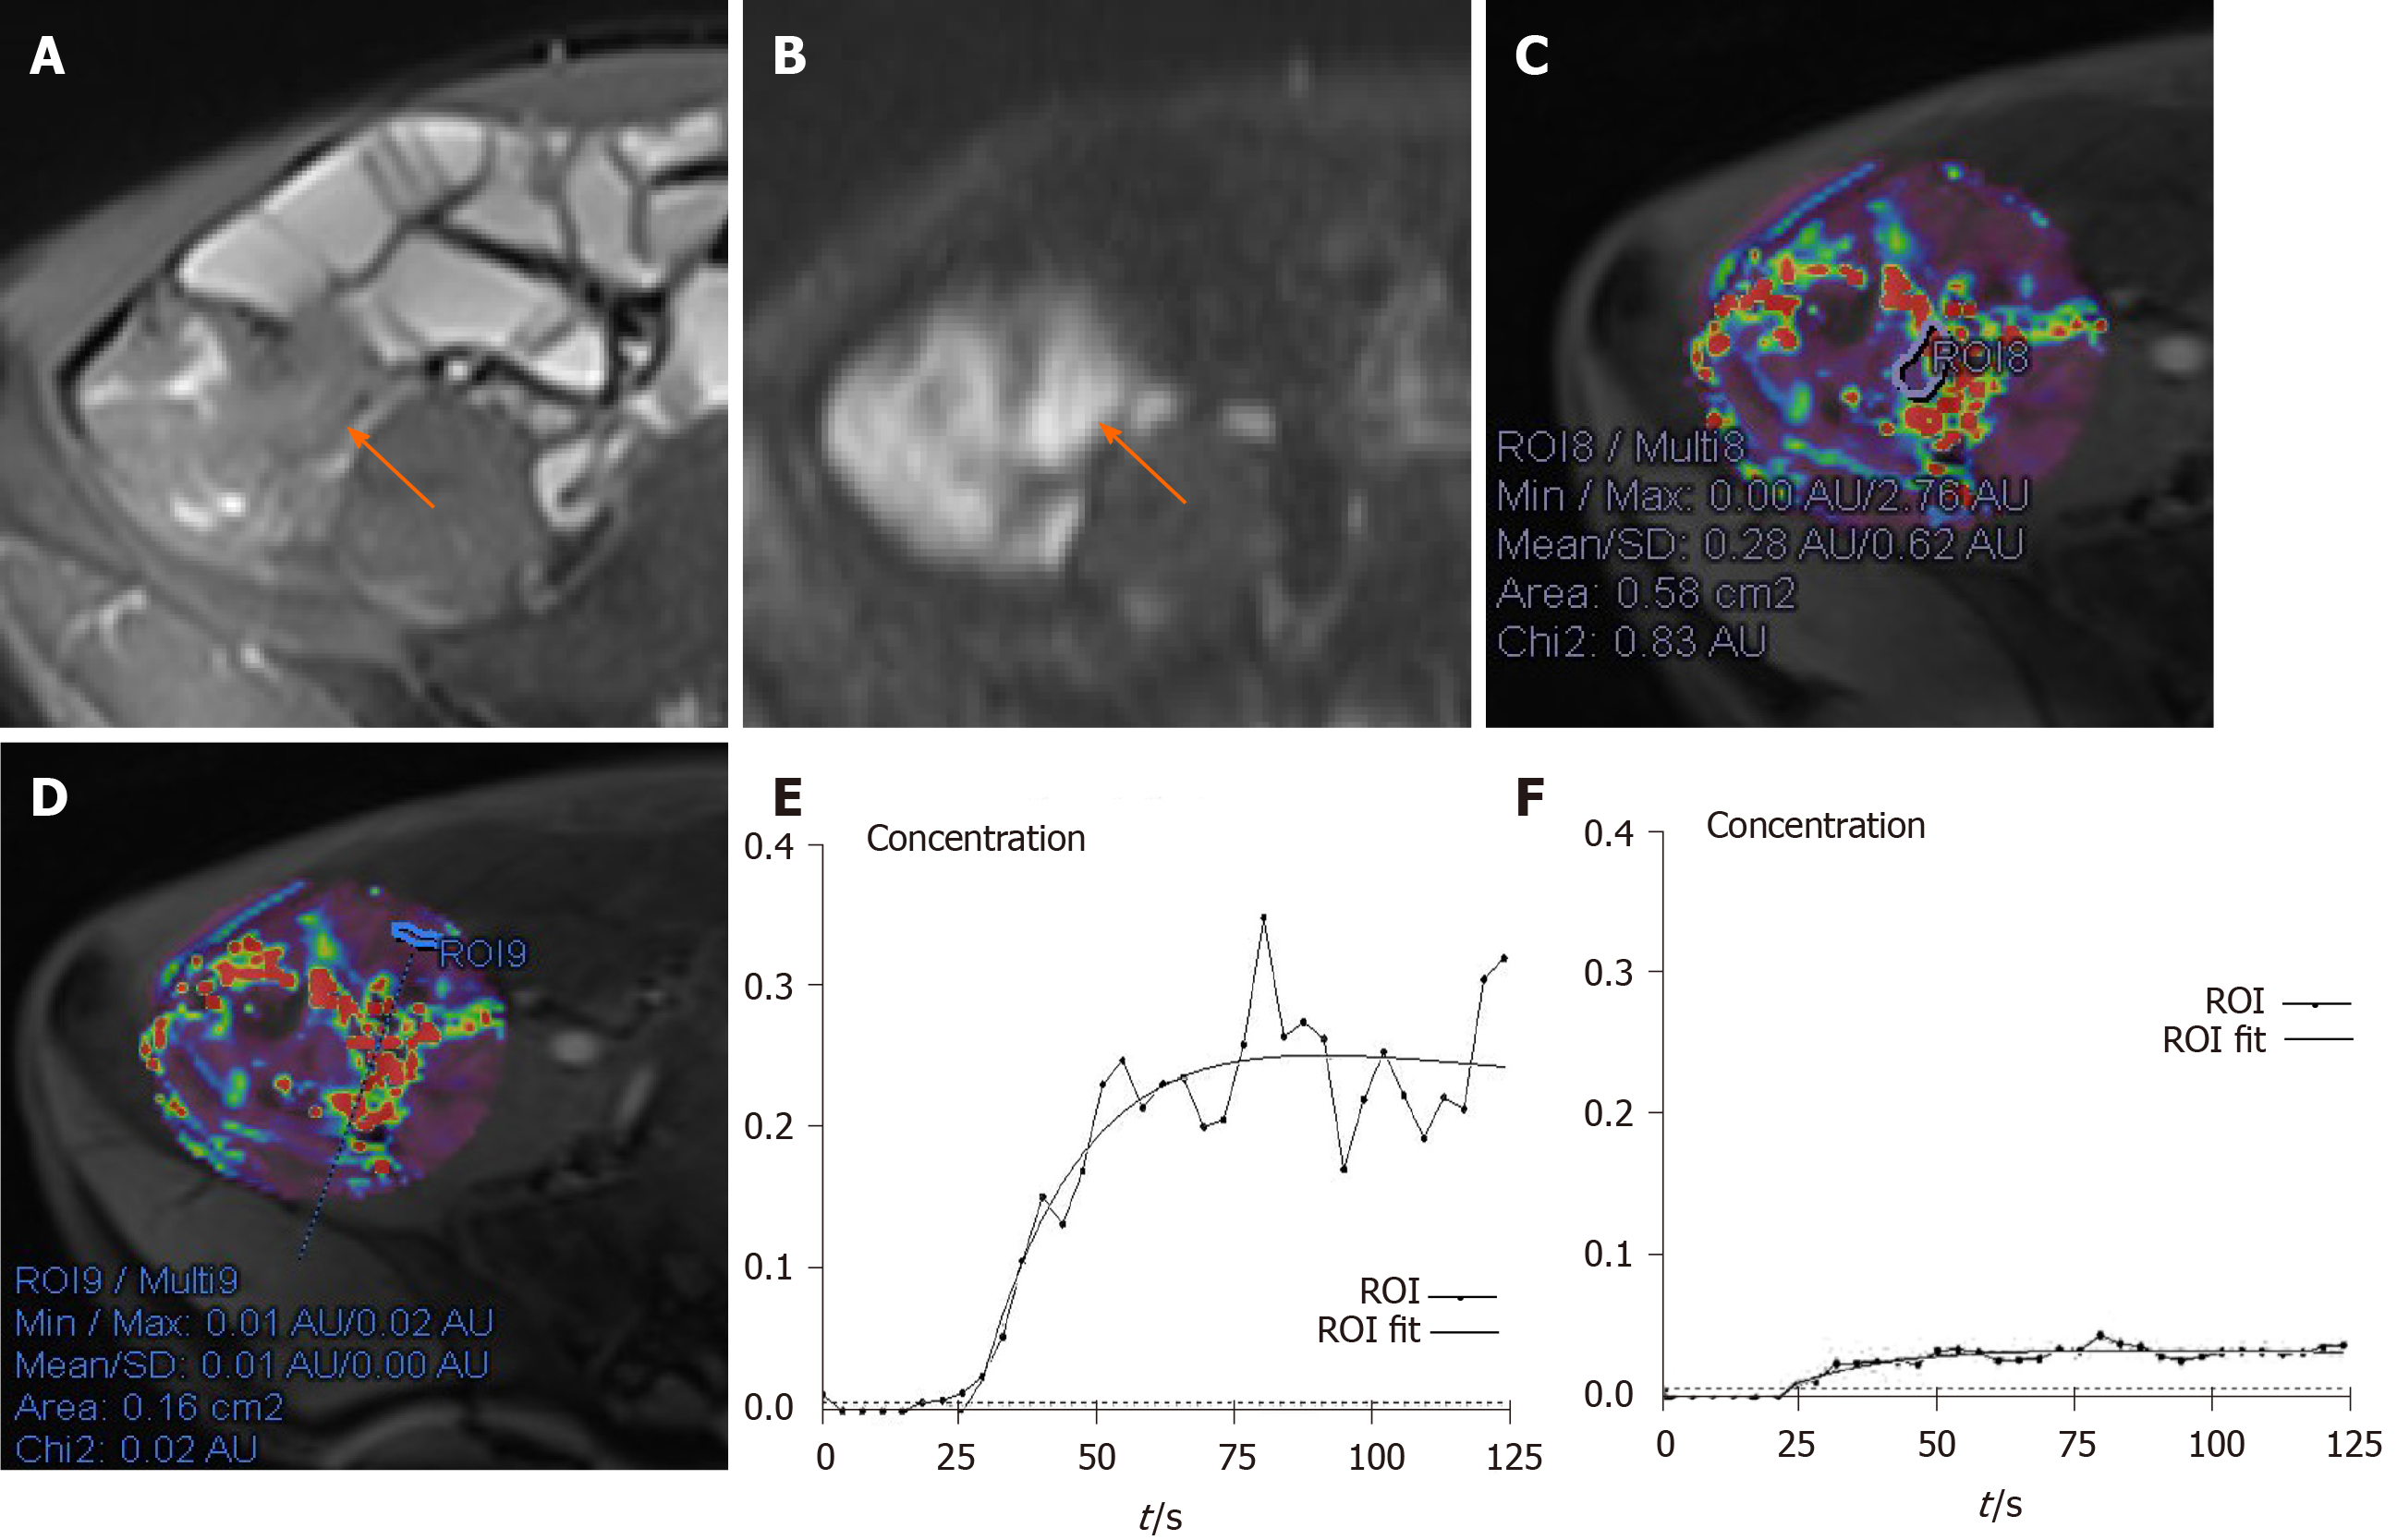
Figure 1 A 41-year-old male with moderate active Crohn’s disease in the terminal ileum and a Crohn’s Disease Activity Index of 267 and Crohn’s Disease Endoscopic Index of Severity of 12.
A: Terminal ileum demonstrates wall thickening and increased signal on axial T2-weighted image; B: Terminal ileum wall has a high signal. Axial diffusion-weighted imaging image (b = 800 s/mm2) demonstrates high signal (arrow) in the same bowel segment. Region of interest (ROI) for the inflammatory bowel wall shows that apparent diffusion coefficient = 1.11×10⁻³ mm2/s; C: ROI for the inflammatory bowel wall shows that Ktrans = 0.10 min-1 (Kep = 0.87 min-1, Ve = 0.11); D: In contrast, ROI of the normal appearing ileal loop shows that Ktrans = 0.01 min-1 (Kep = 0.80 min-1, Ve = 0.02); E: The contrast concentration curve of inflammatory bowel is plotted as ROI (line with circle) and fitted with the model (line); F: The contrast concentration curve of normal loop is plotted as ROI (line with circle) and fitted with the model (line). ROI: Region of interest.
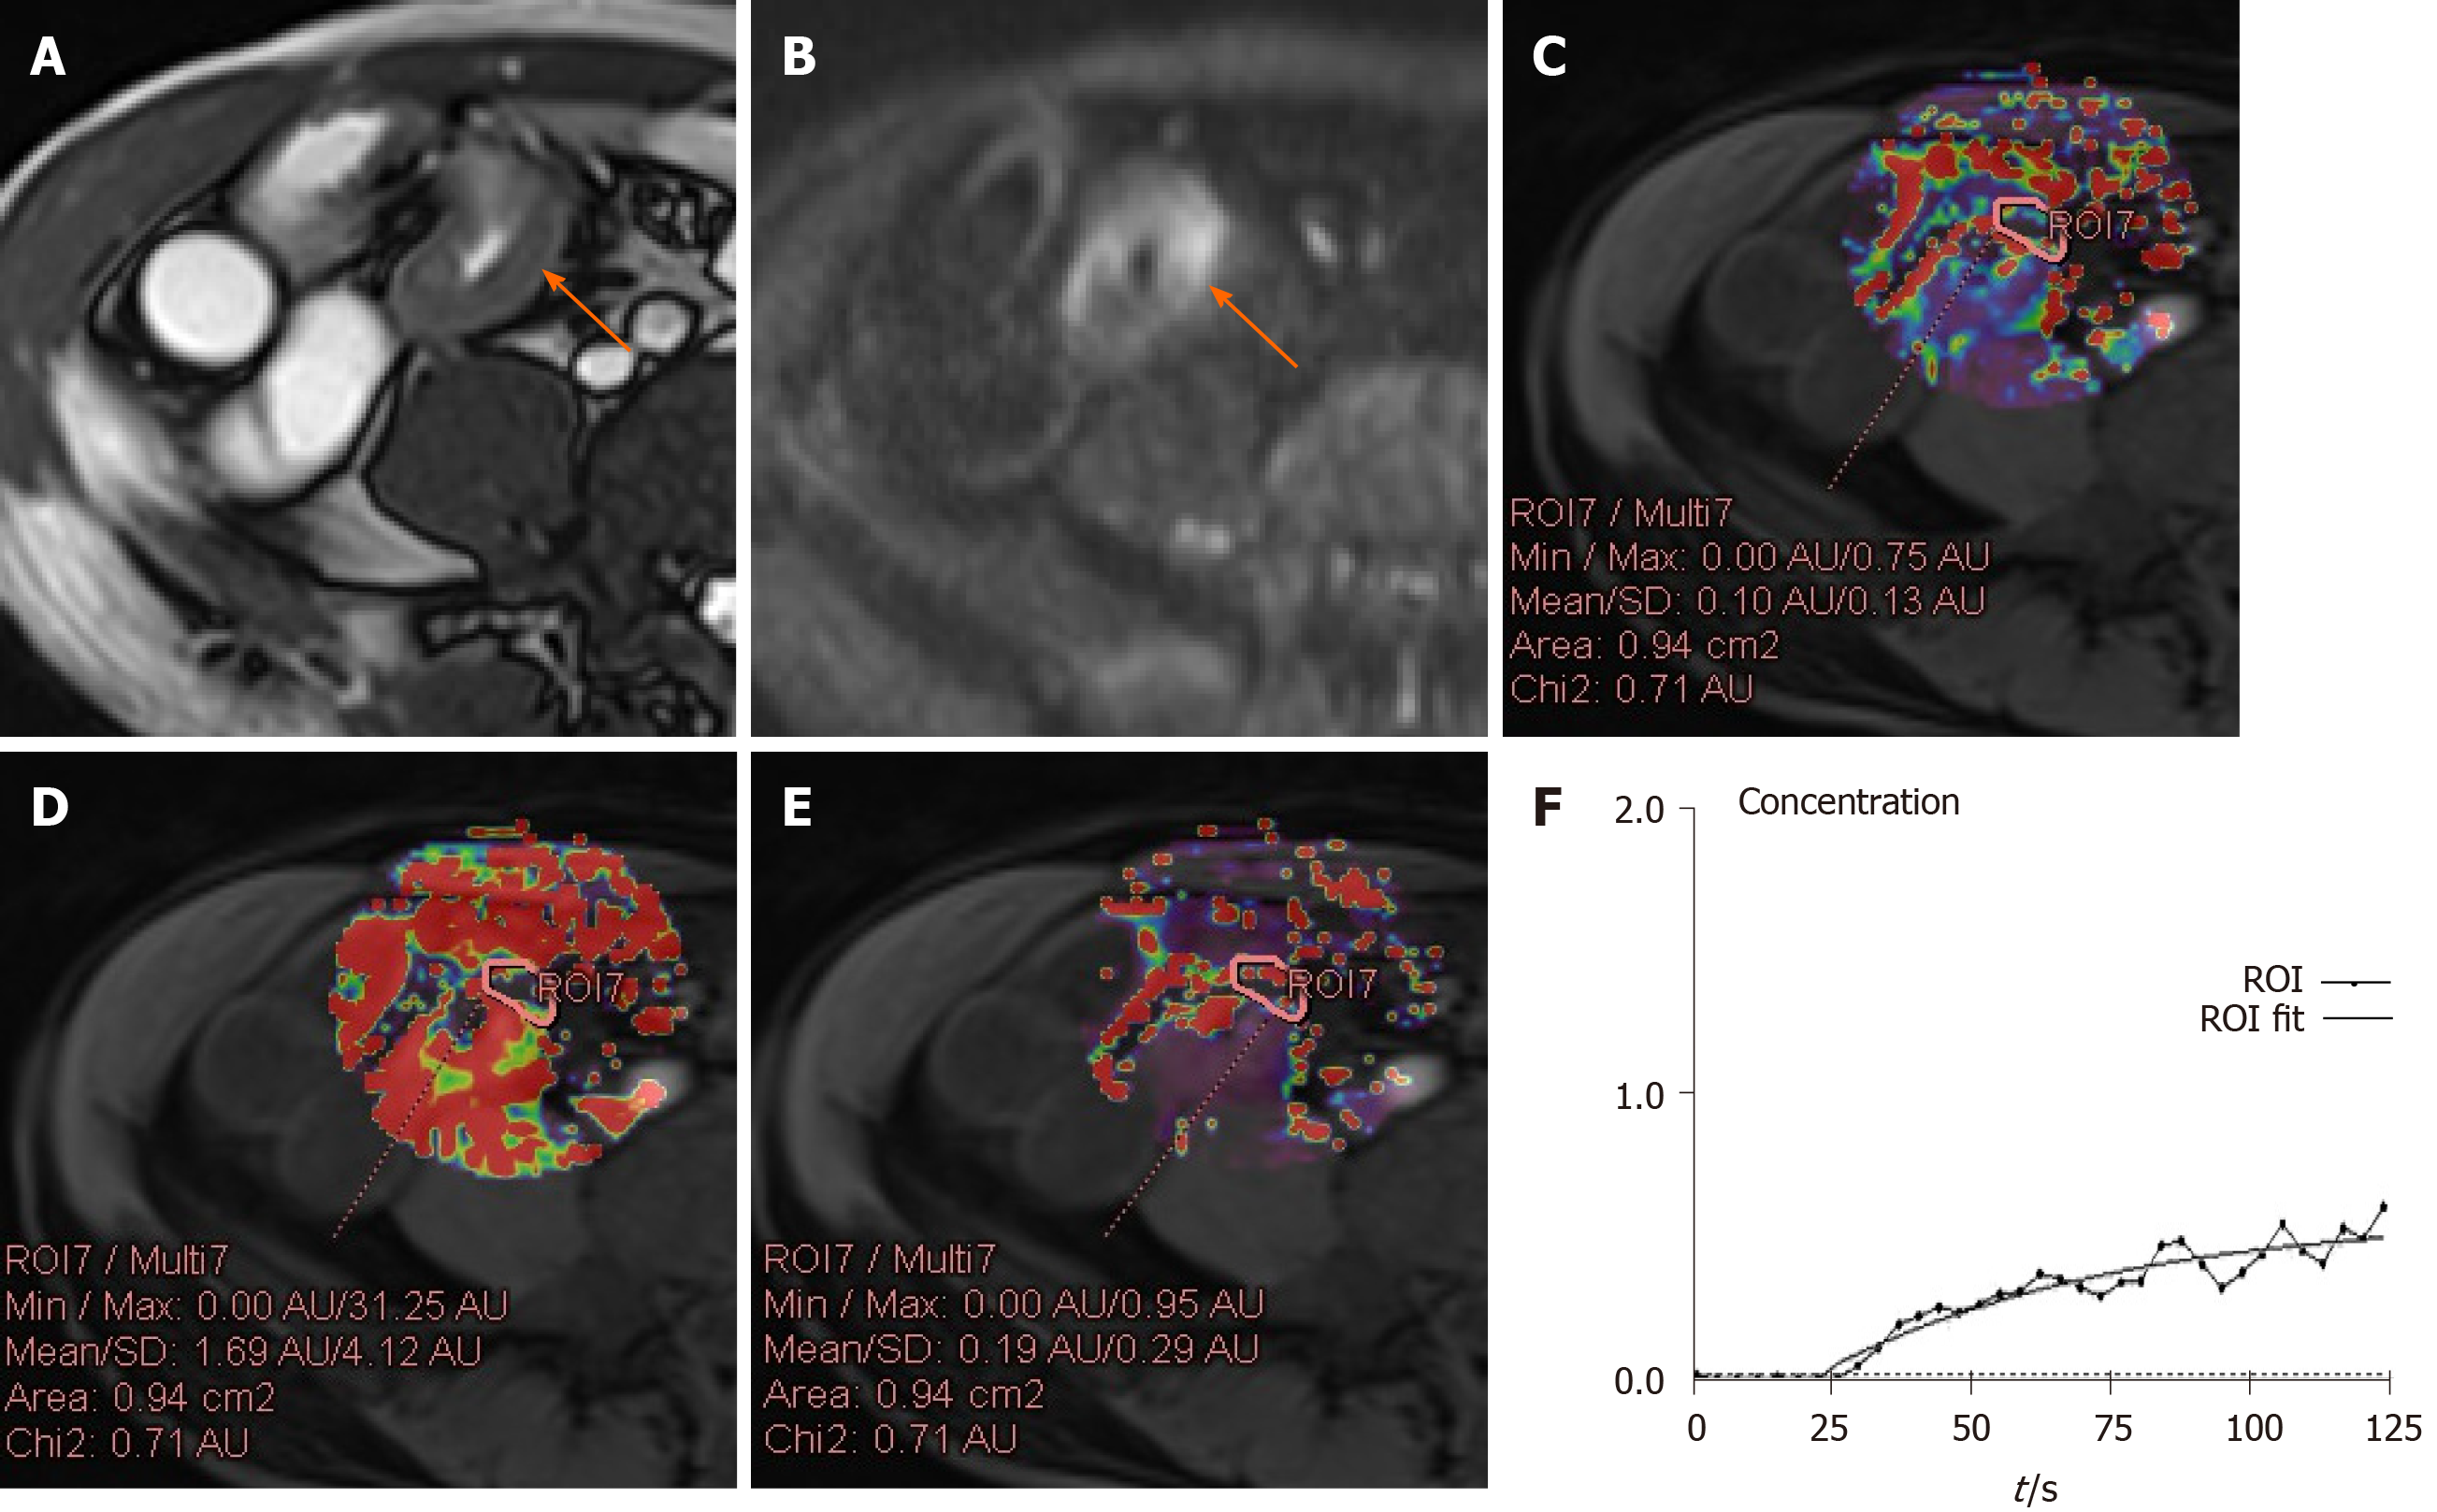
Figure 2 A 42-year-old male with remission of Crohn’s disease in the terminal ileum and a Crohn’s Disease Activity Index of 108 and Crohn’s Disease Endoscopic Index of Severity of 2.
A: Axial T2-weighted image shows mural thickening and hyperintensity in the terminal ileum (arrow); B: Axial diffusion-weighted imaging image (b = 800 s/mm2) demonstrates high signal (arrow) in the same bowel segment. Regions of interest (ROI) for the inflammatory bowel wall shows that apparent diffusion coefficient = 1.89×10⁻³ mm2/s; C: Ktrans map is obtained through the relevant phase. The perfusion parameters of the ROI placed in the terminal ileum is calculated by TCM (Ktrans = 0.18 min-1); D: Kep map is obtained through the relevant phase. The Kep of the ROI placed is 0.98 min-1; E: Ve map is obtained through the relevant phase. The Ve of the ROI placed is 0.19; F: The contrast concentration curve is plotted as ROI (line with circle) and fitted with the model (line). ROI: Region of interest.
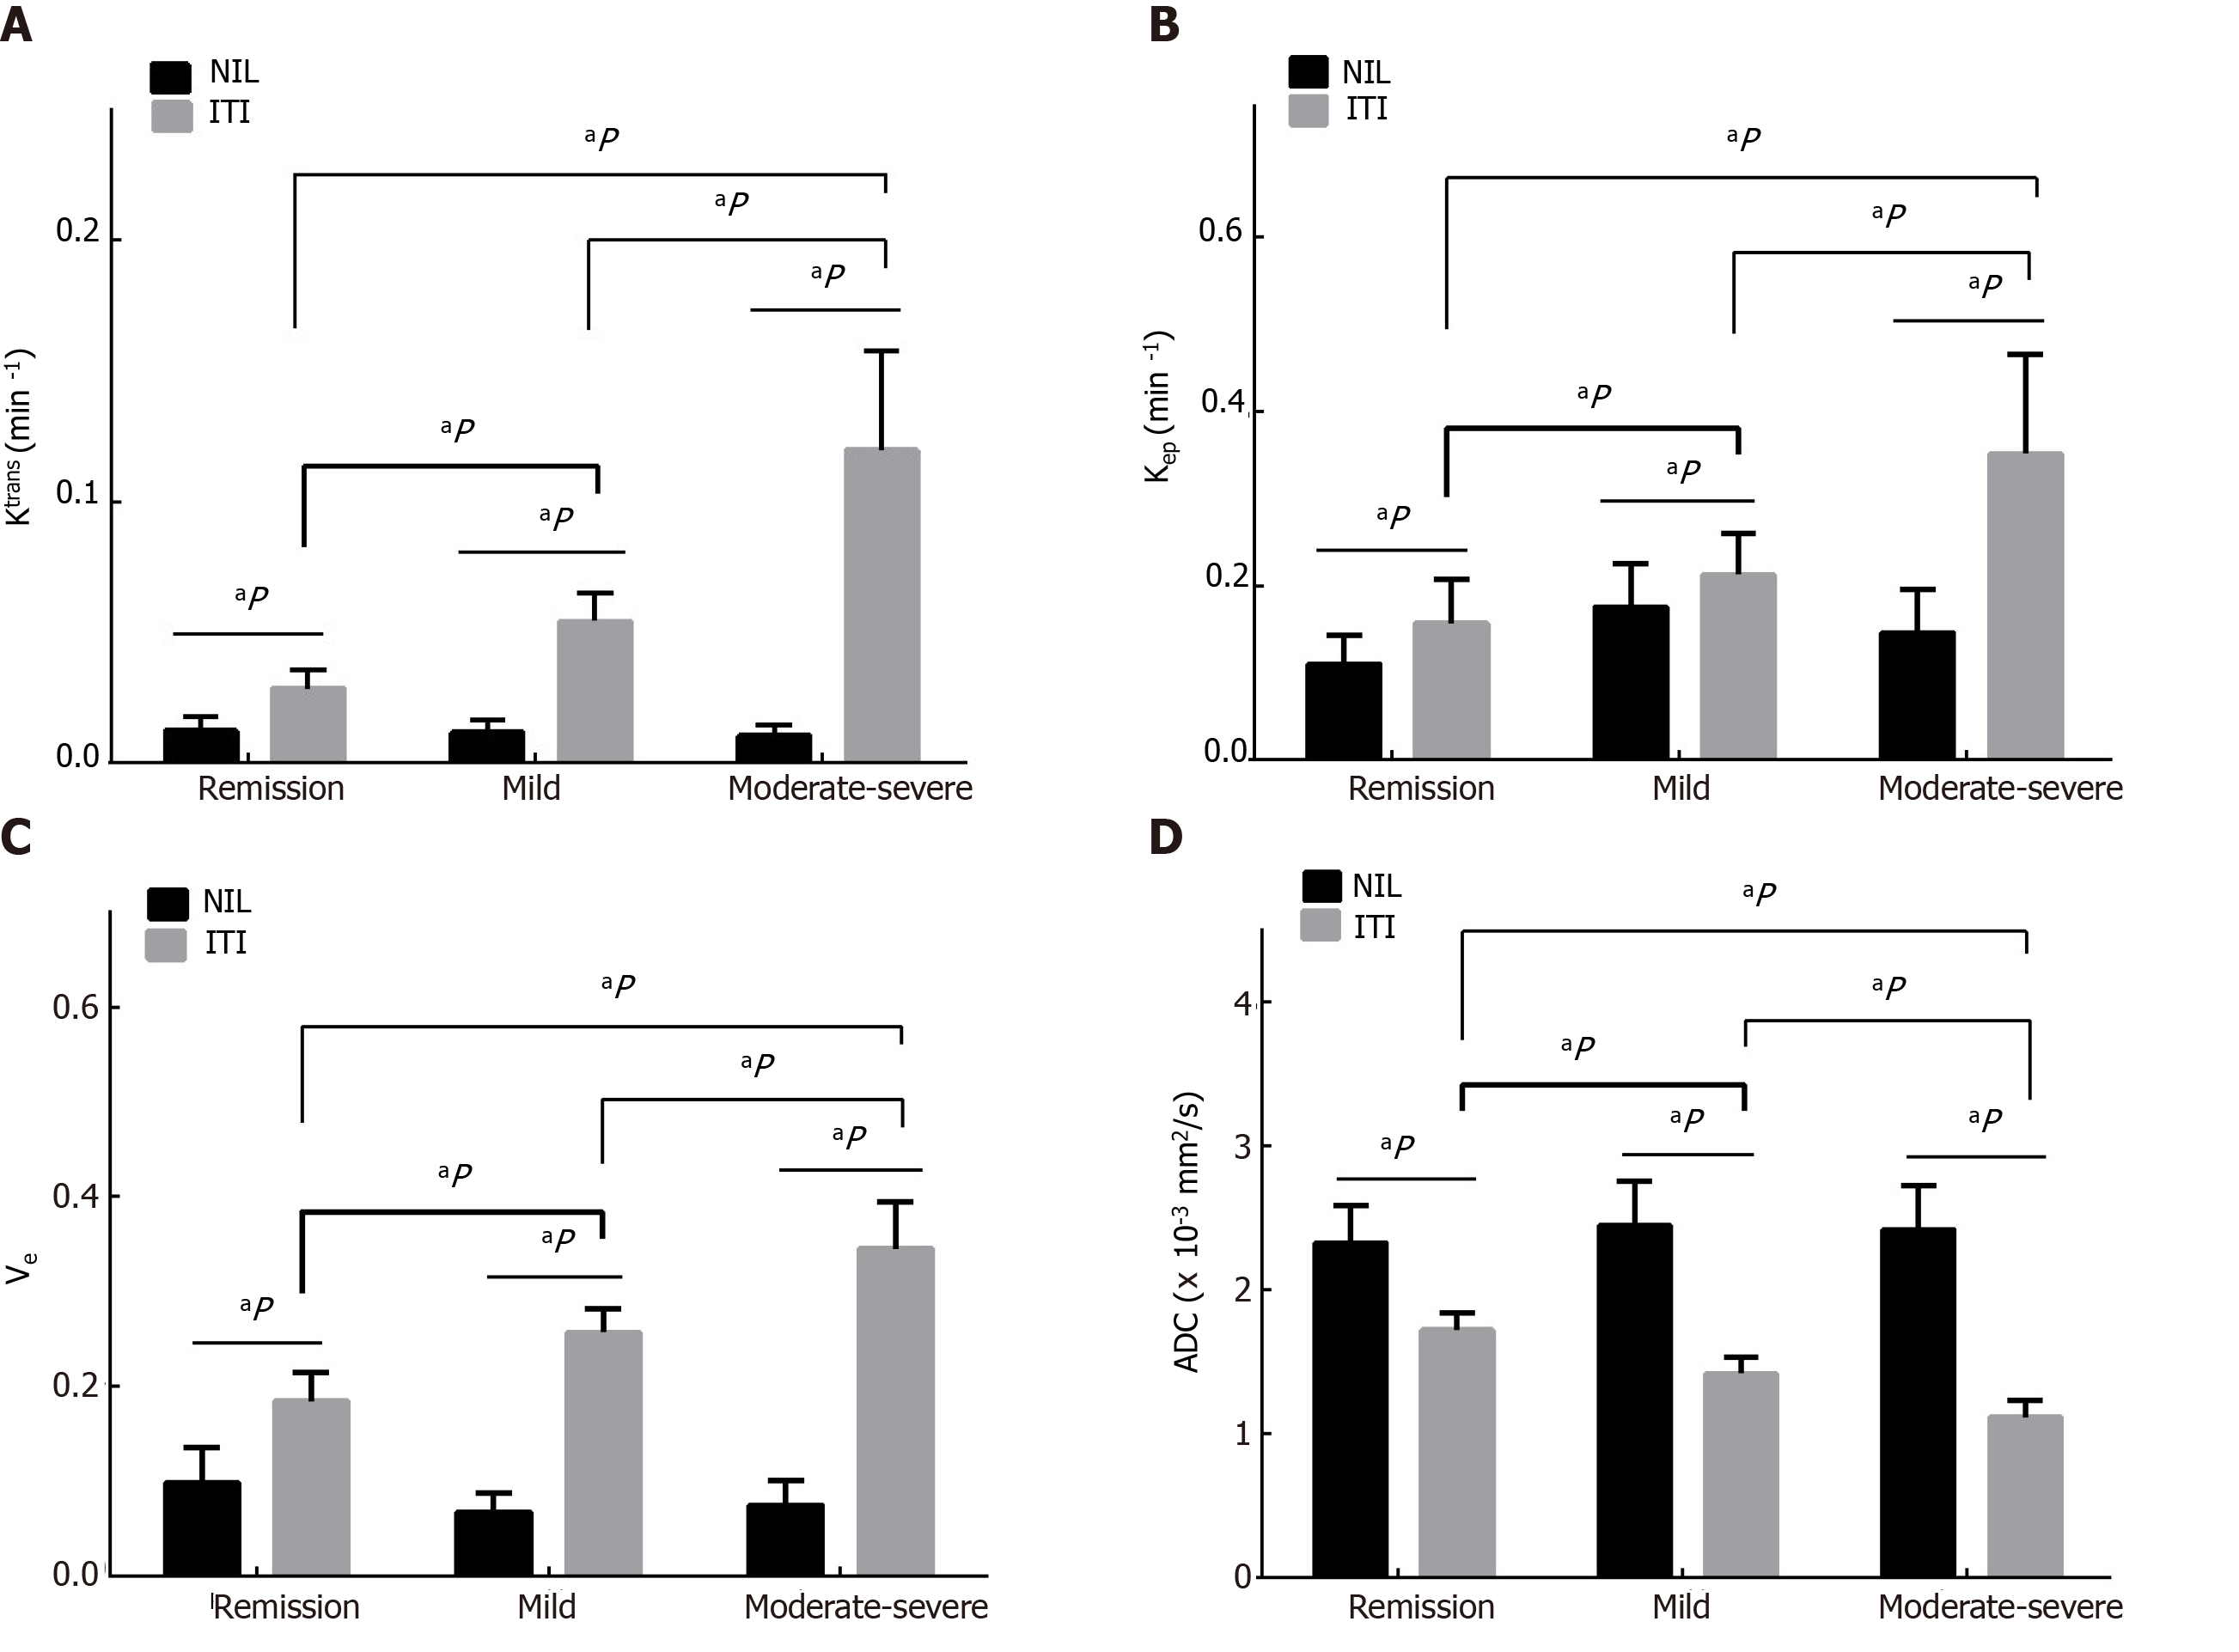
Figure 3 The Ktrans, Kep, Ve and apparent diffusion coefficient among the three groups.
A: Bar charts show increasing Ktrans, between the normal ileal loop (NIL) and the inflamed terminal ileum (ITI) and pairwise comparisons of them is different (all P < 0.001); B: Kep between the NIL and the ITI is different (all P < 0.001); C: Ve between the NIL and the ITI is different (all P < 0.001); D: Apparent diffusion coefficient between the NIL and the ITI is different (all P < 0.001). Furthermore, increasing Ktrans, Kep and Ve are shown with activity of CD in remission, mild and moderate-severe CD while decreasing apparent diffusion coefficients are shown (all P < 0.001). aP indicate difference with P < 0.001. NIL: Normal ileal loop; ITI: Inflamed terminal ileum.
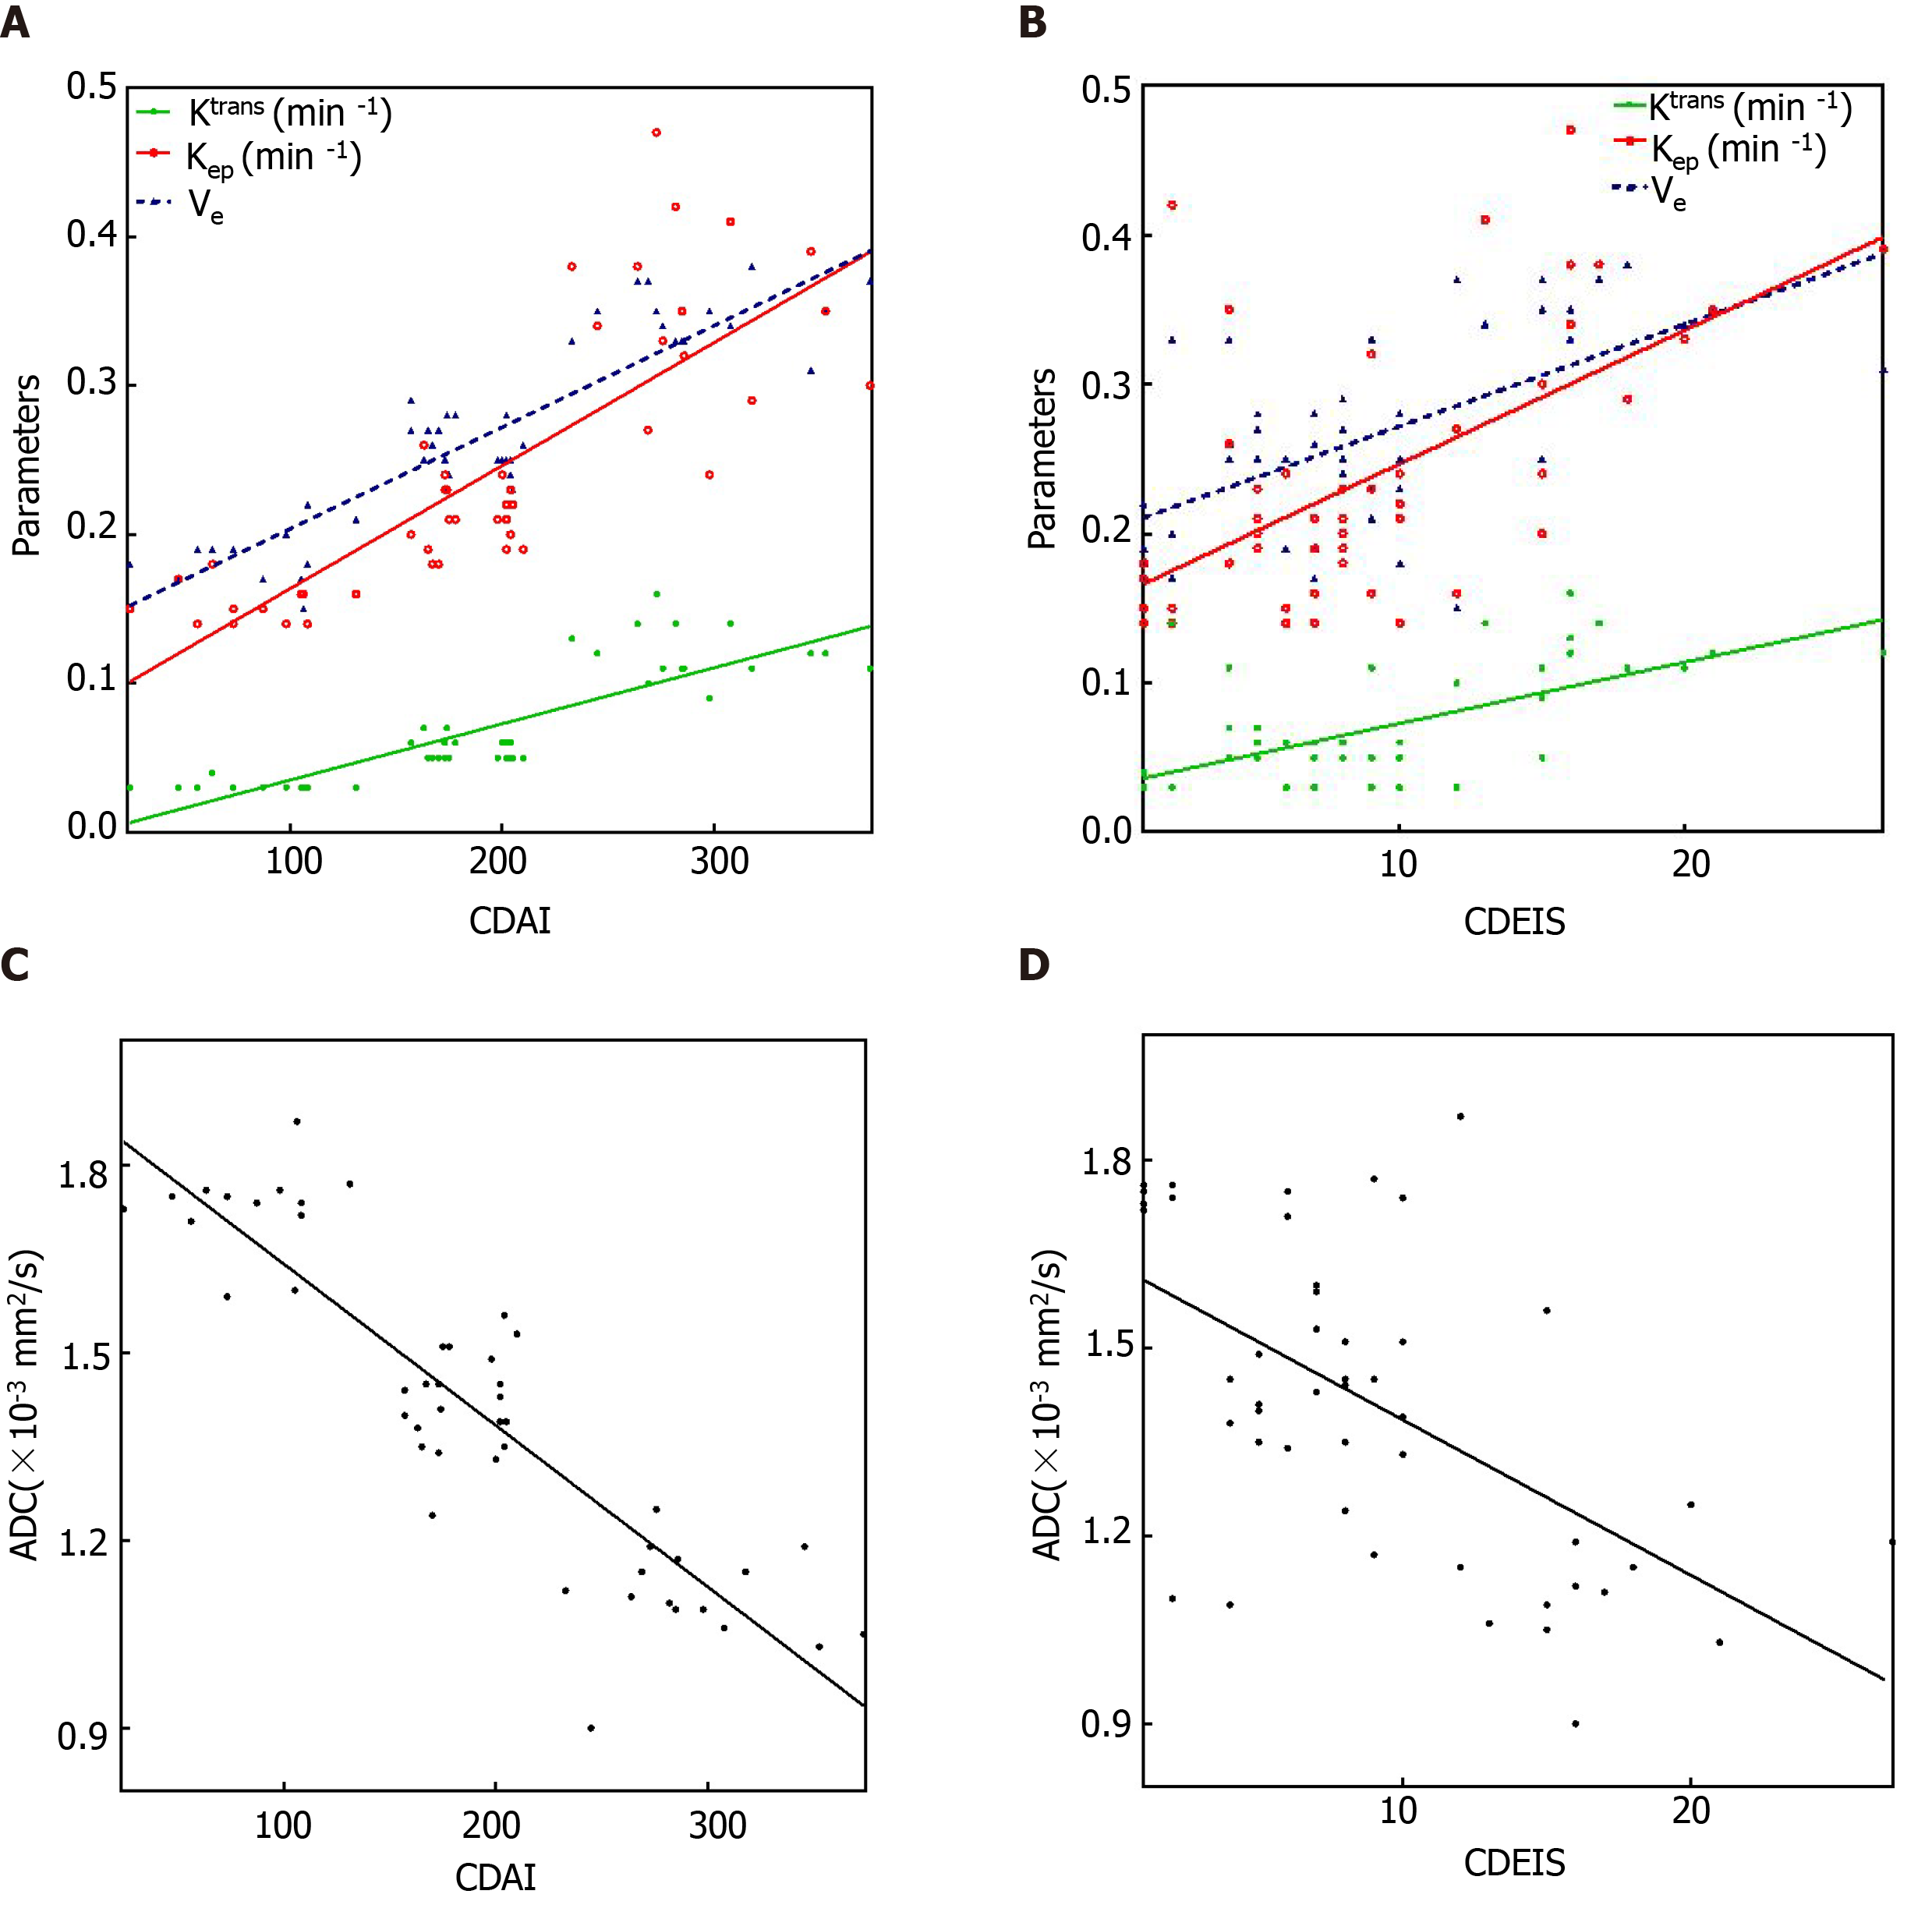
Figure 4 Correlations of inflamed terminal ileum with Crohn’s Disease Activity Index and Crohn’s Disease Endoscopic Index of Severity in Crohn’s disease.
A and C: Scatterplots show positive correlation of Ktrans, Kep and Ve and negative correlation of apparent diffusion coefficient in inflamed terminal ileum of Crohn’s disease patients with Crohn’s Disease Activity Index score; B and D: Positive correlation of Ktrans, Kep and Ve and negative correlation of apparent diffusion coefficient in inflamed terminal ileum of Crohn’s disease patients with Crohn’s Disease Endoscopic Index of Severity score. CDAI: Crohn’s Disease Activity Index; CDEIS: Crohn’s Disease Endoscopic Index of Severity; ADC: Apparent diffusion coefficient.
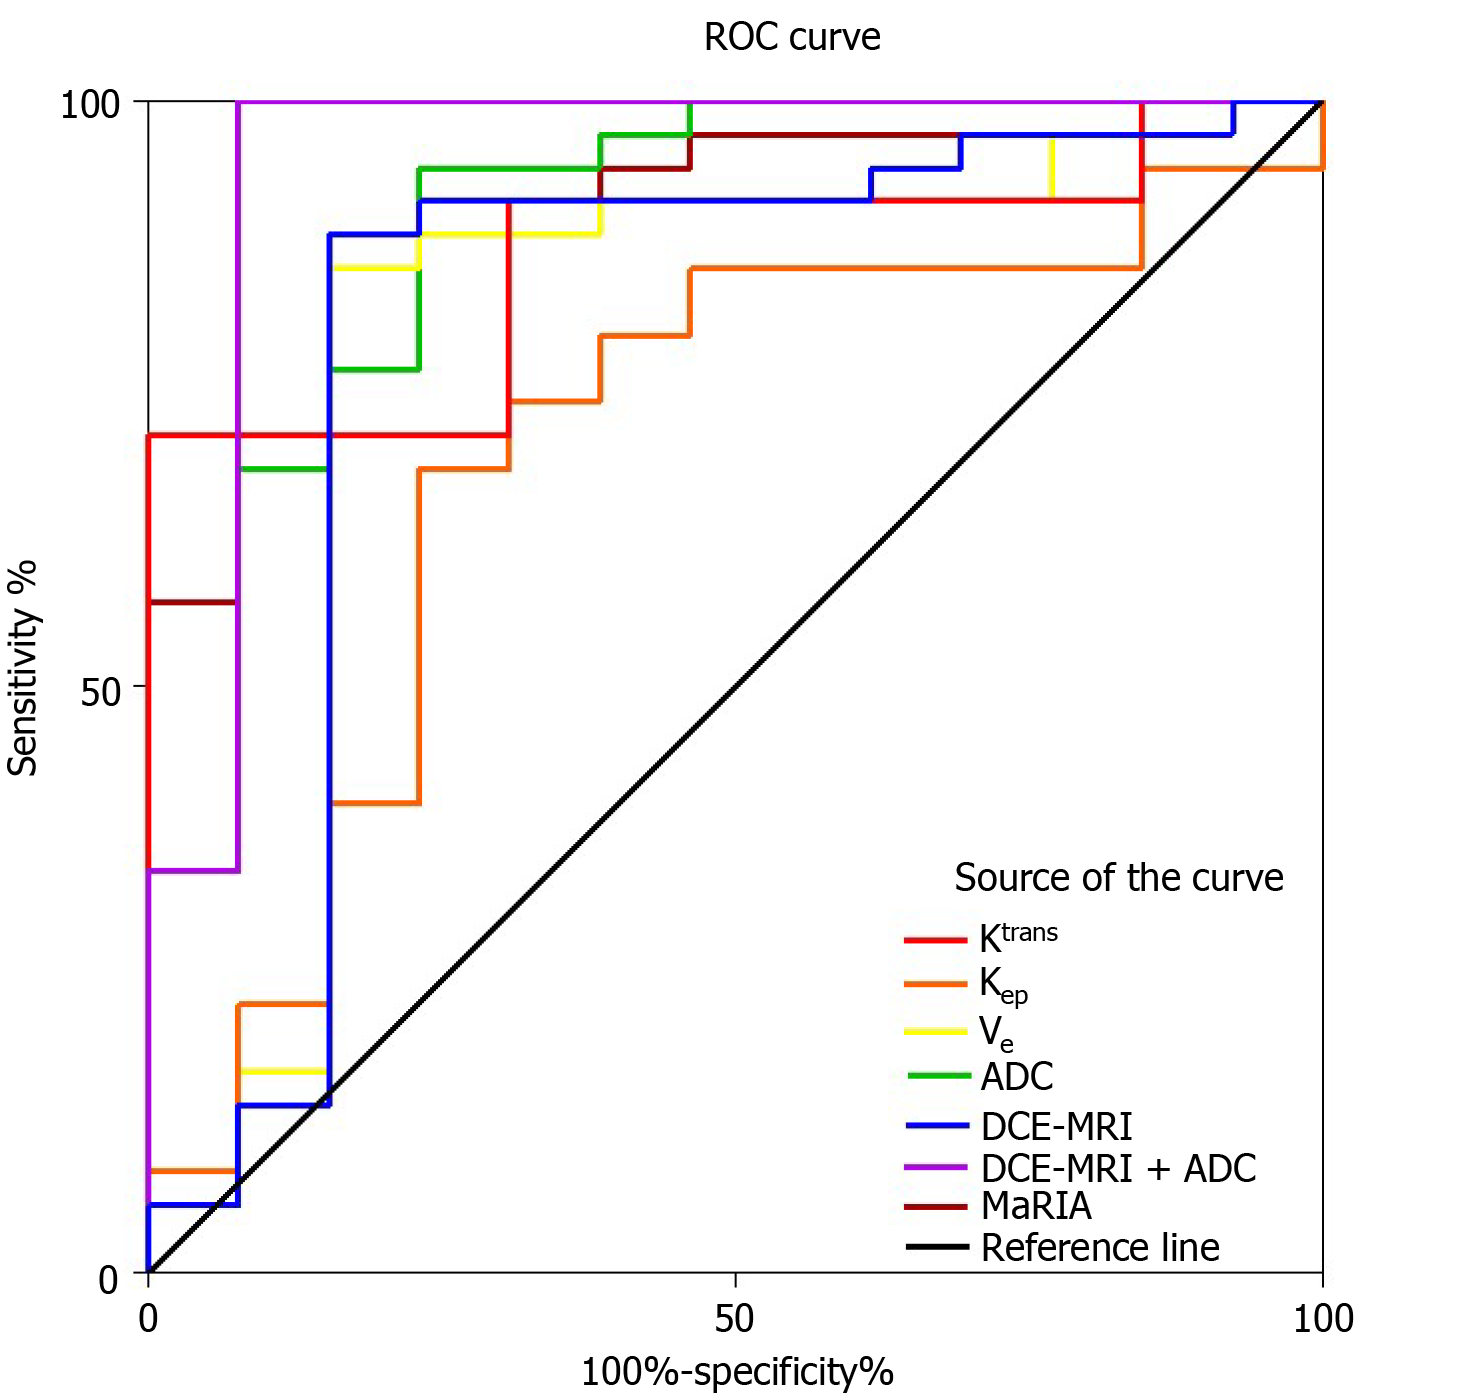
Figure 5 Receiver operating characteristic curve analysis.
Receiver operating characteristic curve analysis shows high accuracy of Ktrans (areas under the curve [AUC] = 0.76), Ve (AUC = 0.78), Kep (AUC = 0.68), apparent diffusion coefficient (AUC = 0.89) and Magnetic Resonance Index of Activity (AUC = 0.91) for differentiating inactive from active Crohn’s disease. Accuracy of combining the Ktrans, Kep and Ve (AUC = 0.80) is higher than the individual dynamic contrast-enhanced magnetic resonance imaging parameters. The highest AUC is observed when combining dynamic contrast-enhanced magnetic resonance imaging and diffusion-weighted imaging parameters (AUC = 0.95). ROC: Receiver operating characteristic; ADC: Apparent diffusion coefficient; DCE-MRI: Dynamic contrast-enhanced magnetic resonance imaging; MaRIA: Magnetic Resonance Index of Activity.
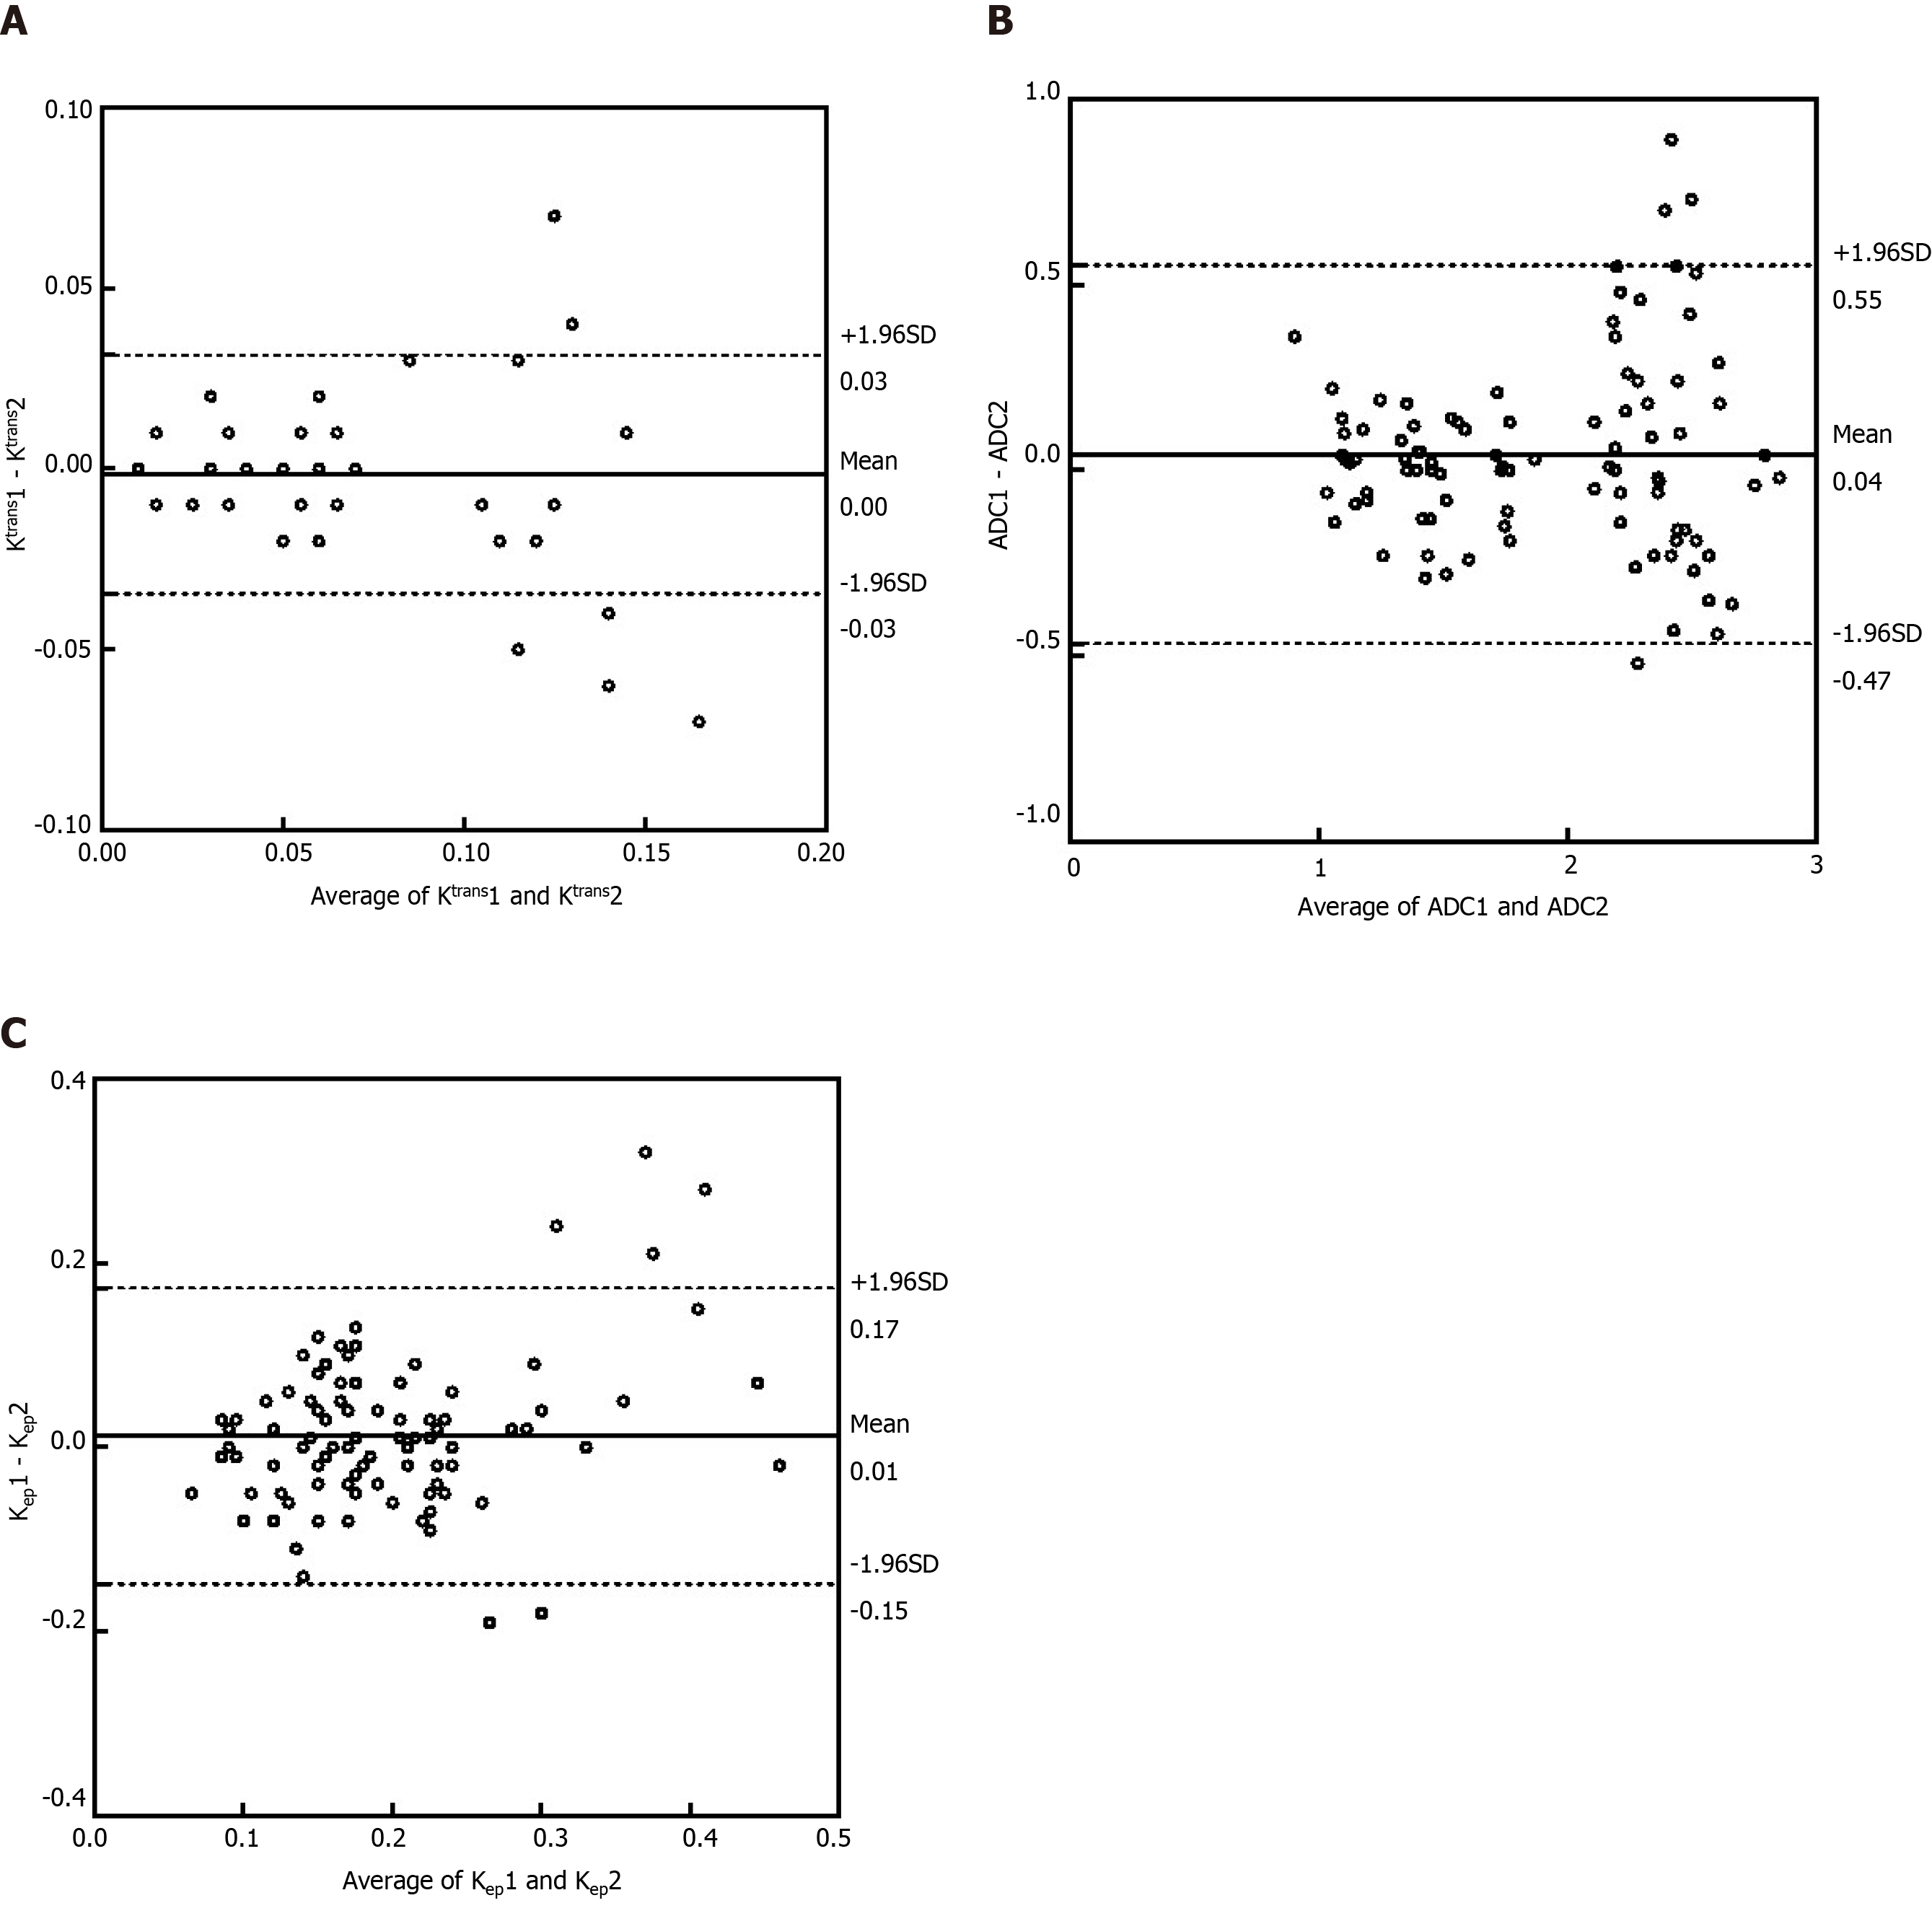
Figure 6 Bland-Altman analysis for the intraclass and interclass coefficients.
A: Bland-Altman analysis of the difference between the two observers’ average results for Ktrans; B: Bland-Altman analysis of the difference between the two observers’ average results for apparent diffusion coefficient; C: Bland-Altman analysis of the difference between the two observers’ average results for Kep. ADC: Apparent diffusion coefficient; SD: Standard deviation.
- Citation: Wu YC, Xiao ZB, Lin XH, Zheng XY, Cao DR, Zhang ZS. Dynamic contrast-enhanced magnetic resonance imaging and diffusion-weighted imaging in the activity staging of terminal ileum Crohn's disease. World J Gastroenterol 2020; 26(39): 6057-6073
- URL: https://www.wjgnet.com/1007-9327/full/v26/i39/6057.htm
- DOI: https://dx.doi.org/10.3748/wjg.v26.i39.6057


