Copyright
©The Author(s) 2020.
World J Gastroenterol. Oct 21, 2020; 26(39): 6057-6073
Published online Oct 21, 2020. doi: 10.3748/wjg.v26.i39.6057
Published online Oct 21, 2020. doi: 10.3748/wjg.v26.i39.6057
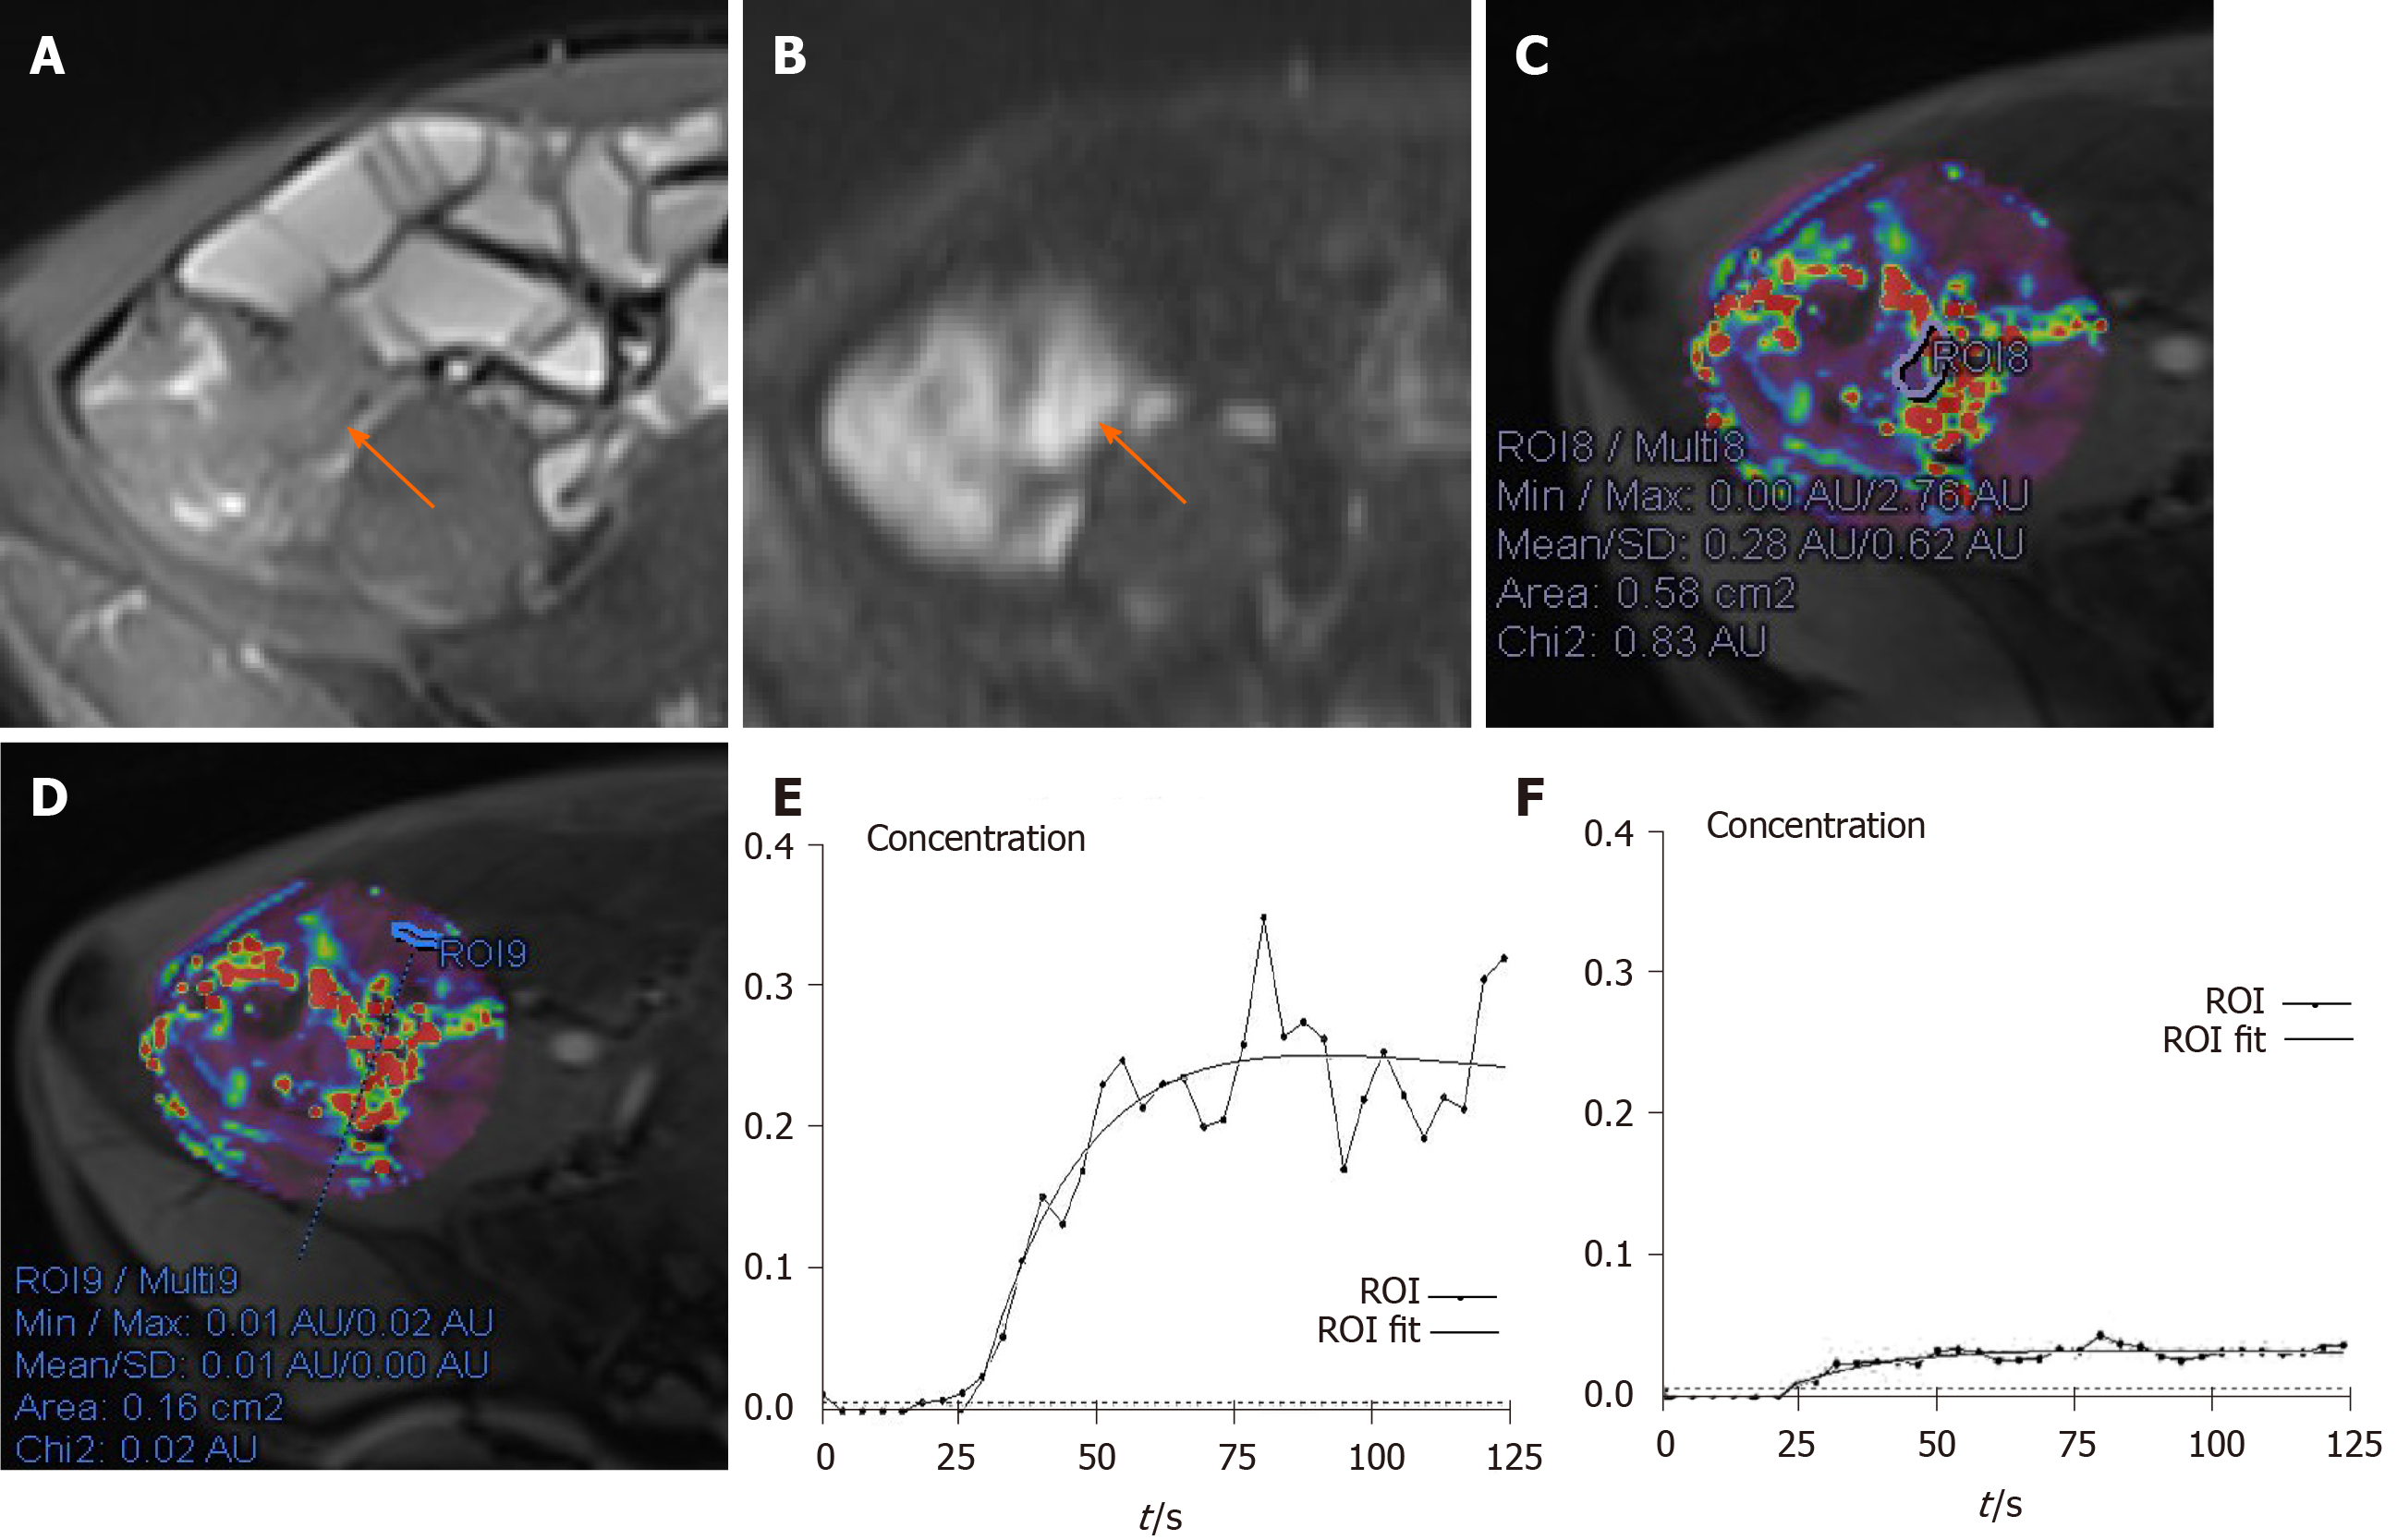
Figure 1 A 41-year-old male with moderate active Crohn’s disease in the terminal ileum and a Crohn’s Disease Activity Index of 267 and Crohn’s Disease Endoscopic Index of Severity of 12.
A: Terminal ileum demonstrates wall thickening and increased signal on axial T2-weighted image; B: Terminal ileum wall has a high signal. Axial diffusion-weighted imaging image (b = 800 s/mm2) demonstrates high signal (arrow) in the same bowel segment. Region of interest (ROI) for the inflammatory bowel wall shows that apparent diffusion coefficient = 1.11×10⁻³ mm2/s; C: ROI for the inflammatory bowel wall shows that Ktrans = 0.10 min-1 (Kep = 0.87 min-1, Ve = 0.11); D: In contrast, ROI of the normal appearing ileal loop shows that Ktrans = 0.01 min-1 (Kep = 0.80 min-1, Ve = 0.02); E: The contrast concentration curve of inflammatory bowel is plotted as ROI (line with circle) and fitted with the model (line); F: The contrast concentration curve of normal loop is plotted as ROI (line with circle) and fitted with the model (line). ROI: Region of interest.
- Citation: Wu YC, Xiao ZB, Lin XH, Zheng XY, Cao DR, Zhang ZS. Dynamic contrast-enhanced magnetic resonance imaging and diffusion-weighted imaging in the activity staging of terminal ileum Crohn's disease. World J Gastroenterol 2020; 26(39): 6057-6073
- URL: https://www.wjgnet.com/1007-9327/full/v26/i39/6057.htm
- DOI: https://dx.doi.org/10.3748/wjg.v26.i39.6057


