Copyright
©The Author(s) 2020.
World J Gastroenterol. Oct 21, 2020; 26(39): 6057-6073
Published online Oct 21, 2020. doi: 10.3748/wjg.v26.i39.6057
Published online Oct 21, 2020. doi: 10.3748/wjg.v26.i39.6057
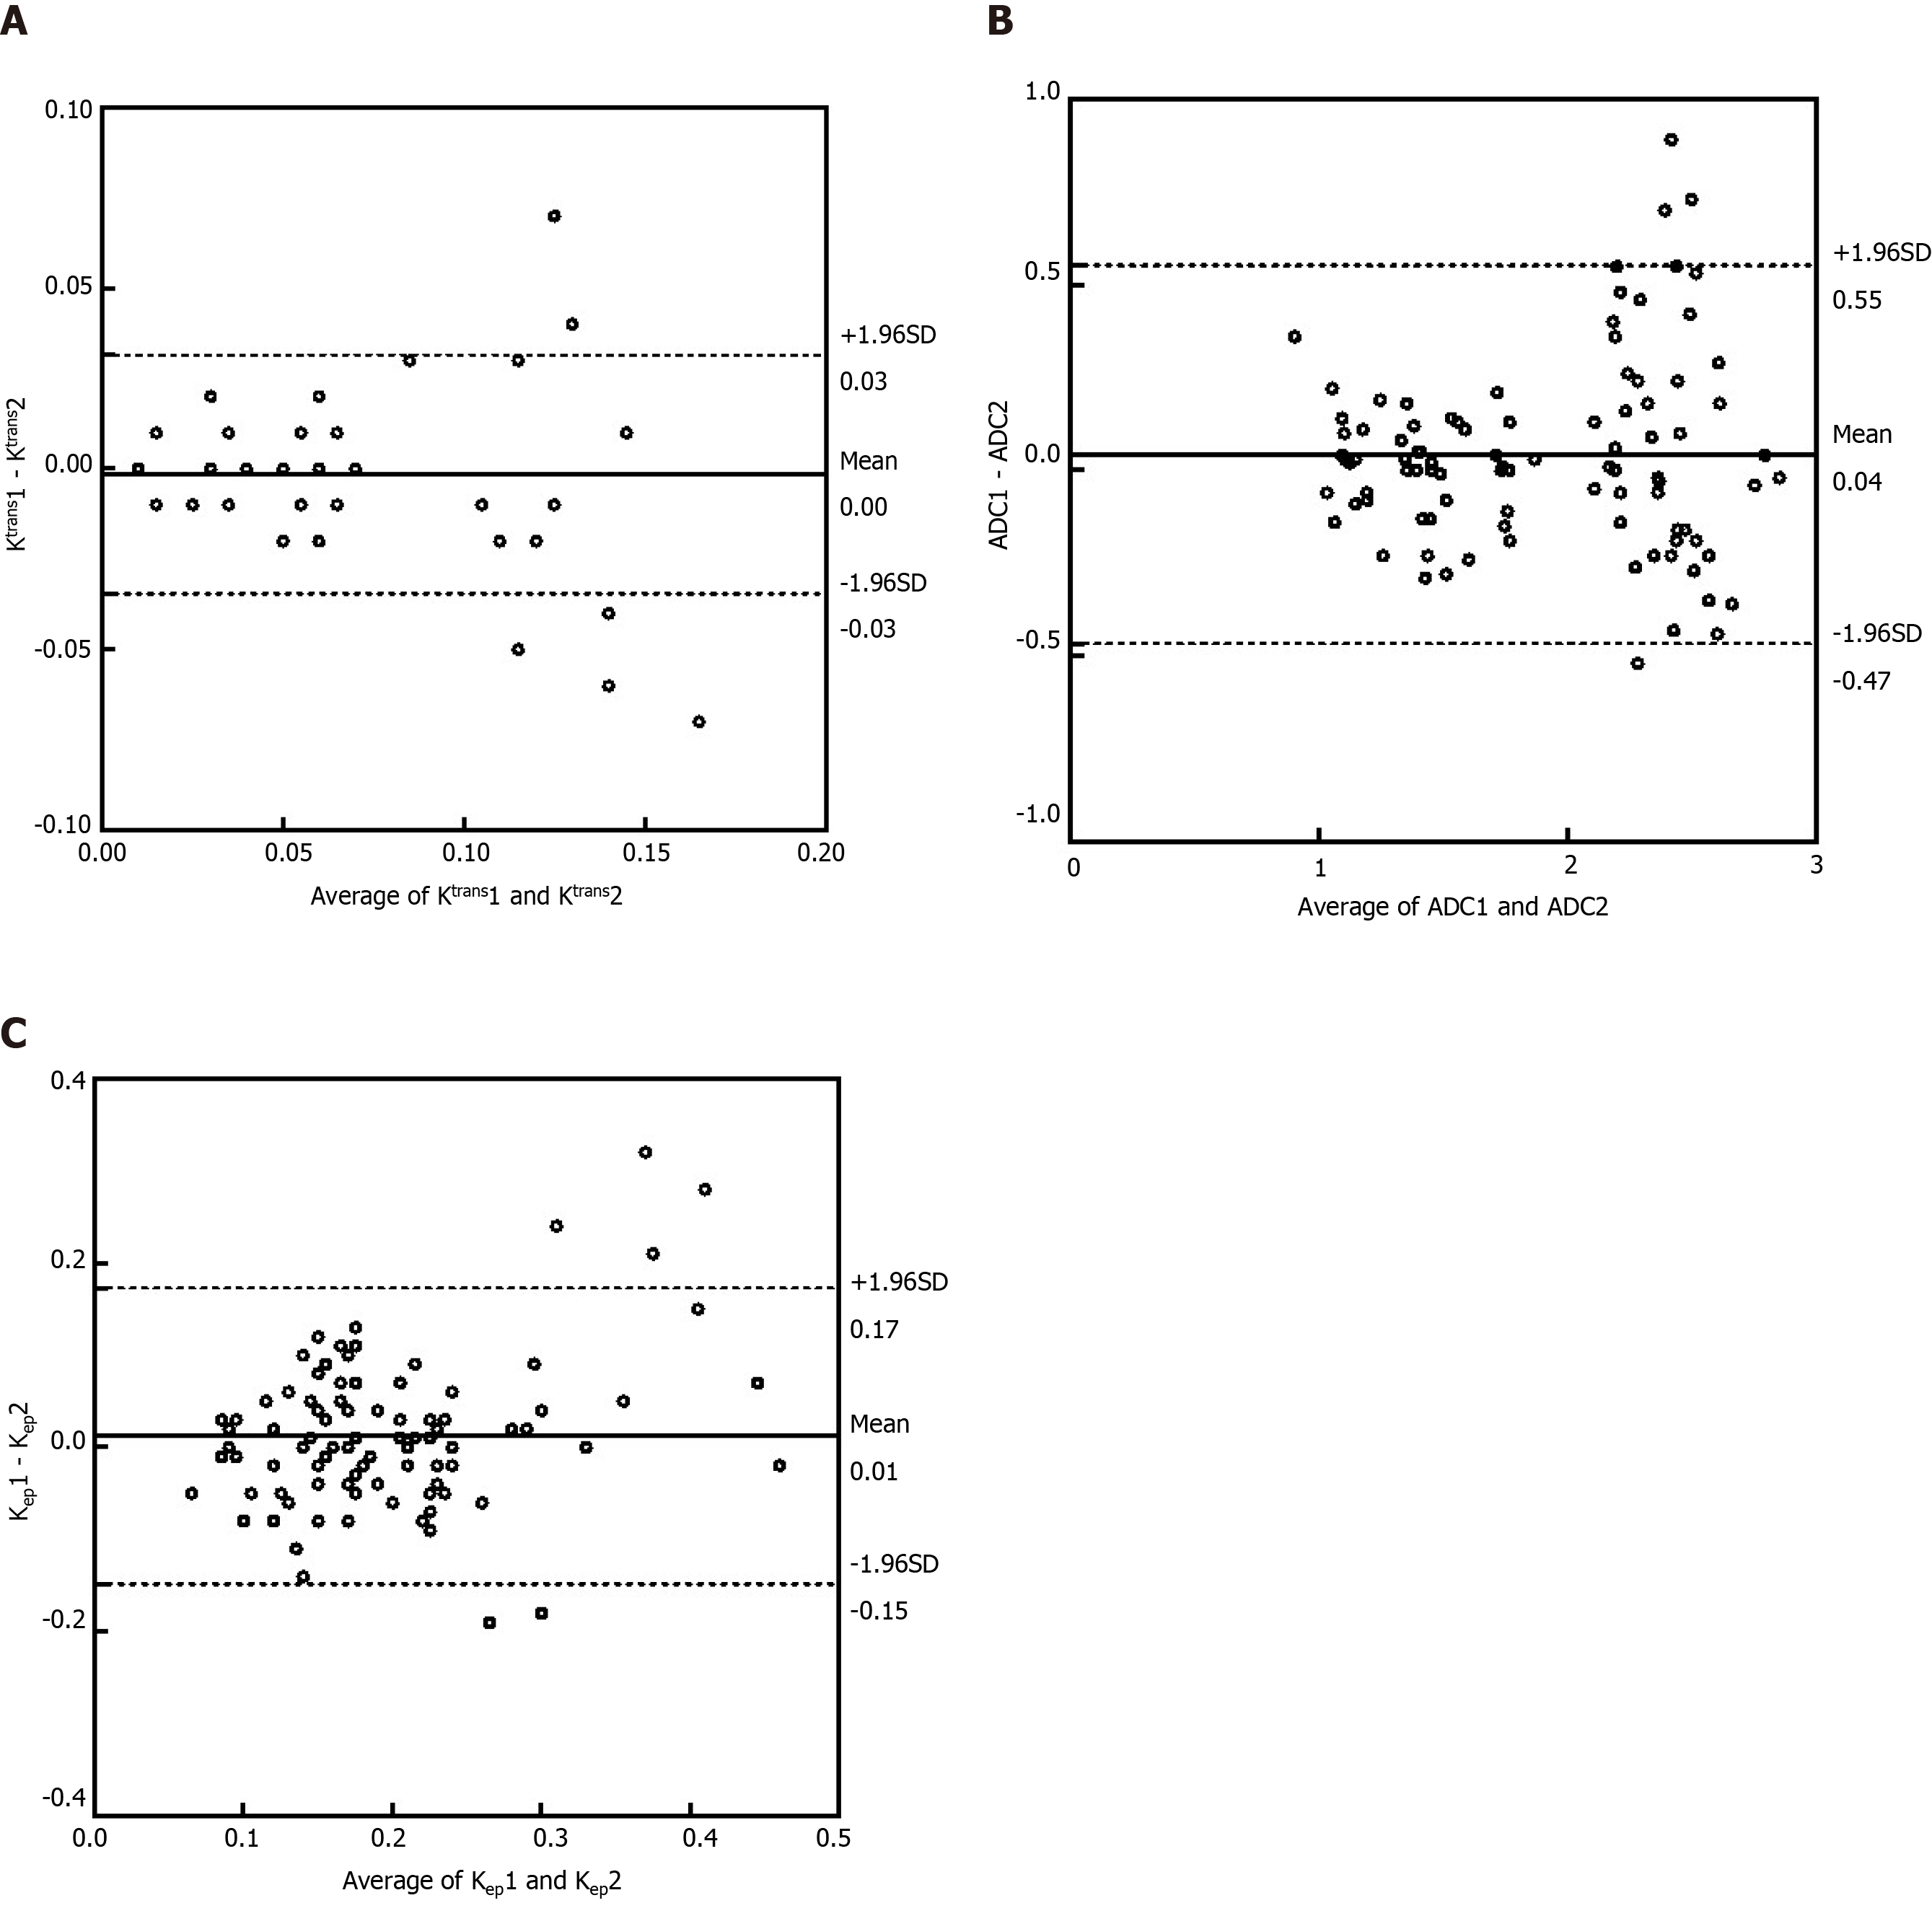
Figure 6 Bland-Altman analysis for the intraclass and interclass coefficients.
A: Bland-Altman analysis of the difference between the two observers’ average results for Ktrans; B: Bland-Altman analysis of the difference between the two observers’ average results for apparent diffusion coefficient; C: Bland-Altman analysis of the difference between the two observers’ average results for Kep. ADC: Apparent diffusion coefficient; SD: Standard deviation.
- Citation: Wu YC, Xiao ZB, Lin XH, Zheng XY, Cao DR, Zhang ZS. Dynamic contrast-enhanced magnetic resonance imaging and diffusion-weighted imaging in the activity staging of terminal ileum Crohn's disease. World J Gastroenterol 2020; 26(39): 6057-6073
- URL: https://www.wjgnet.com/1007-9327/full/v26/i39/6057.htm
- DOI: https://dx.doi.org/10.3748/wjg.v26.i39.6057


