Copyright
©The Author(s) 2020.
World J Gastroenterol. Oct 21, 2020; 26(39): 6057-6073
Published online Oct 21, 2020. doi: 10.3748/wjg.v26.i39.6057
Published online Oct 21, 2020. doi: 10.3748/wjg.v26.i39.6057
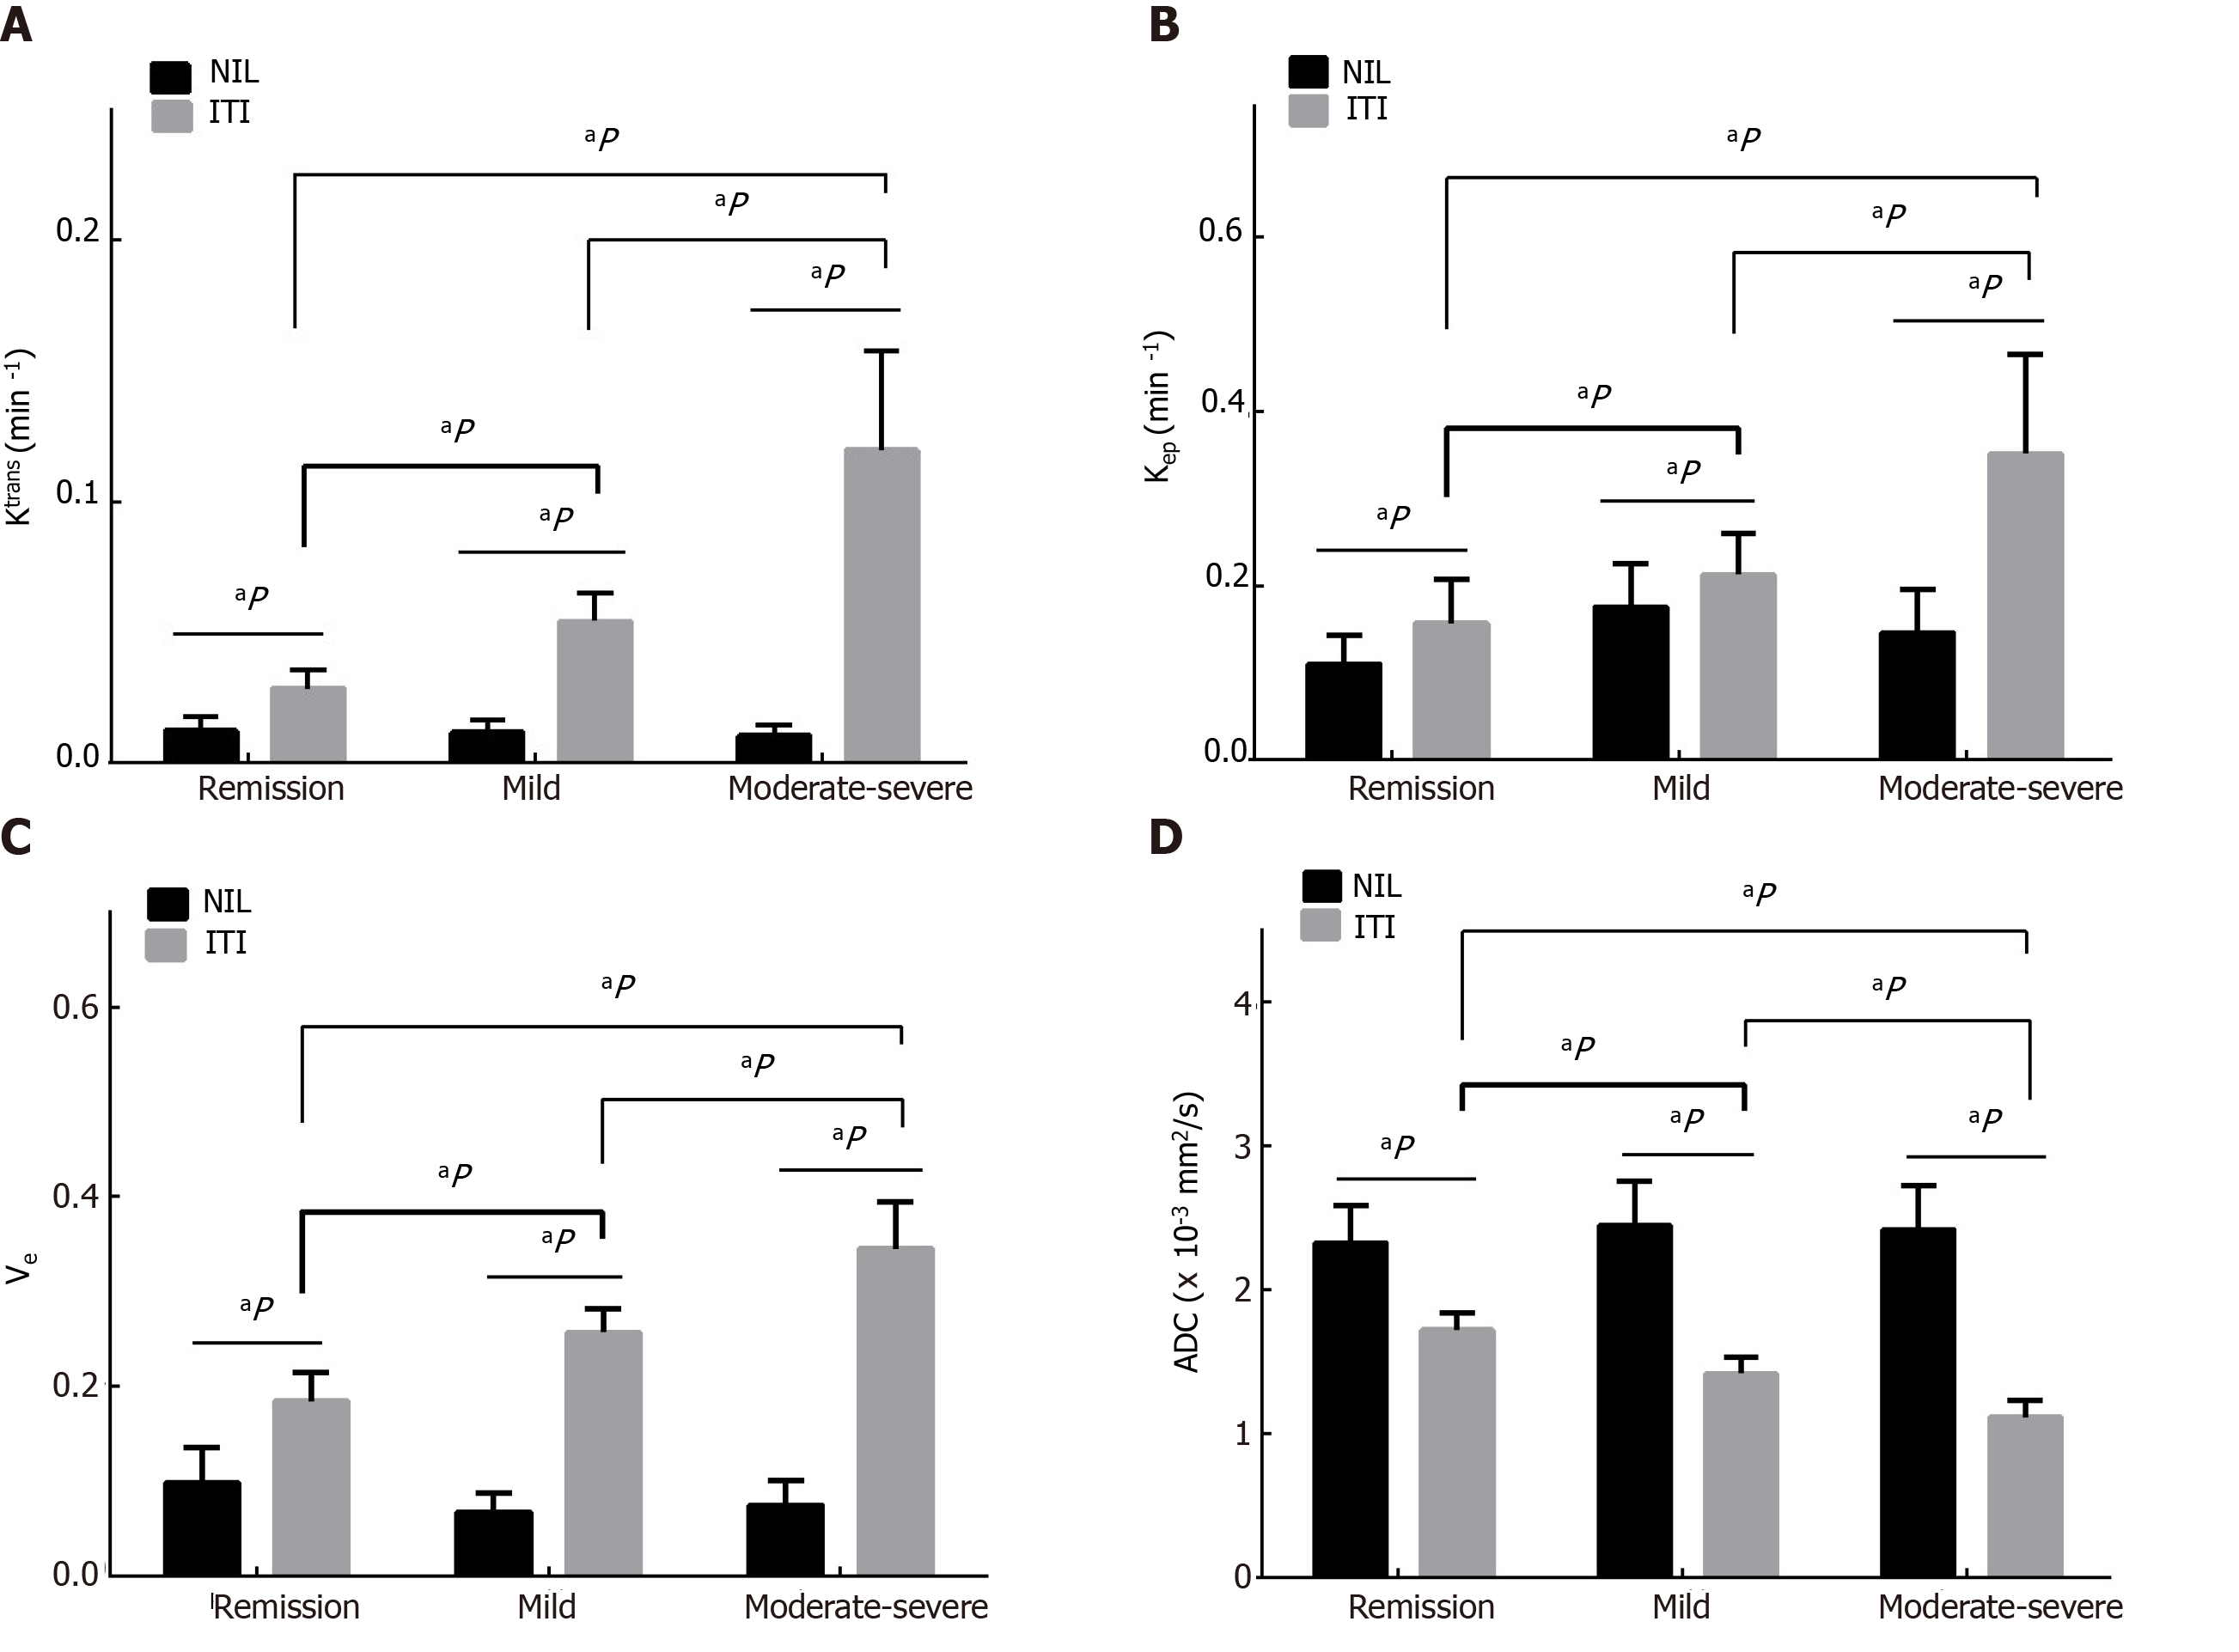
Figure 3 The Ktrans, Kep, Ve and apparent diffusion coefficient among the three groups.
A: Bar charts show increasing Ktrans, between the normal ileal loop (NIL) and the inflamed terminal ileum (ITI) and pairwise comparisons of them is different (all P < 0.001); B: Kep between the NIL and the ITI is different (all P < 0.001); C: Ve between the NIL and the ITI is different (all P < 0.001); D: Apparent diffusion coefficient between the NIL and the ITI is different (all P < 0.001). Furthermore, increasing Ktrans, Kep and Ve are shown with activity of CD in remission, mild and moderate-severe CD while decreasing apparent diffusion coefficients are shown (all P < 0.001). aP indicate difference with P < 0.001. NIL: Normal ileal loop; ITI: Inflamed terminal ileum.
- Citation: Wu YC, Xiao ZB, Lin XH, Zheng XY, Cao DR, Zhang ZS. Dynamic contrast-enhanced magnetic resonance imaging and diffusion-weighted imaging in the activity staging of terminal ileum Crohn's disease. World J Gastroenterol 2020; 26(39): 6057-6073
- URL: https://www.wjgnet.com/1007-9327/full/v26/i39/6057.htm
- DOI: https://dx.doi.org/10.3748/wjg.v26.i39.6057


