Copyright
©The Author(s) 2018.
World J Gastroenterol. Jan 7, 2018; 24(1): 35-45
Published online Jan 7, 2018. doi: 10.3748/wjg.v24.i1.35
Published online Jan 7, 2018. doi: 10.3748/wjg.v24.i1.35
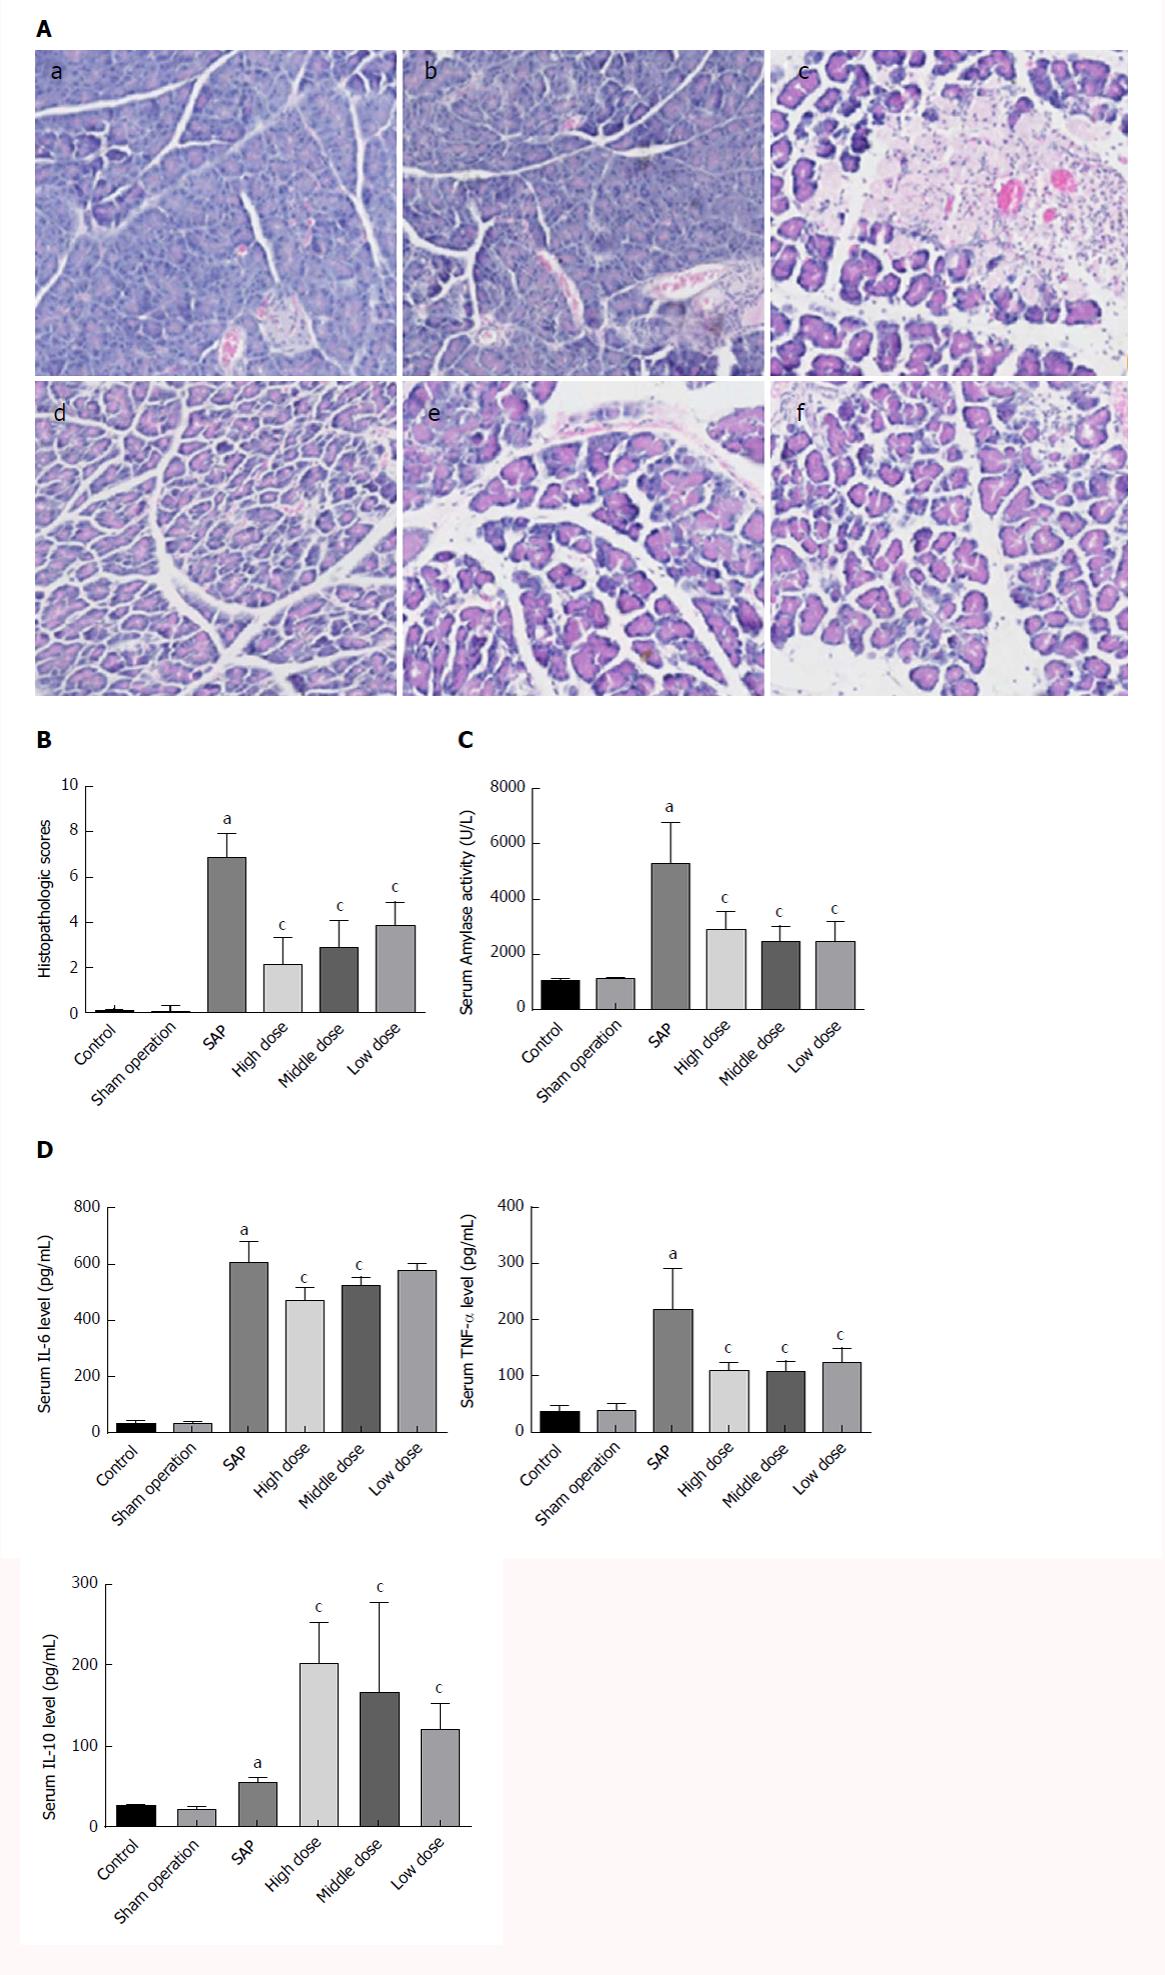
Figure 1 Therapeutic effects of combined use of emodin and baicalein on severe acute pancreatitis rats.
Animals received CEB or an equal amount of saline injection after the SAP induction. CEB at high, middle, and low doses was administered immediately after the SAP induction. Animals were sacrificed 12 h after the SAP induction and were assessed for (A) representative images of pancreatic histopathology in all groups (H&E, ×100). (a) Control group; (b) SO group; (c) SAP group; (d) CEB high-dose group; (e) CEB middle-dose group; (f) CEB low-dose group. B: Histopathology score evaluation; C: Serum amylase; D: Serum cytokines. The data represent the mean ± SD. aP < 0.05 vs the control group; cP < 0.05 vs the SAP group.
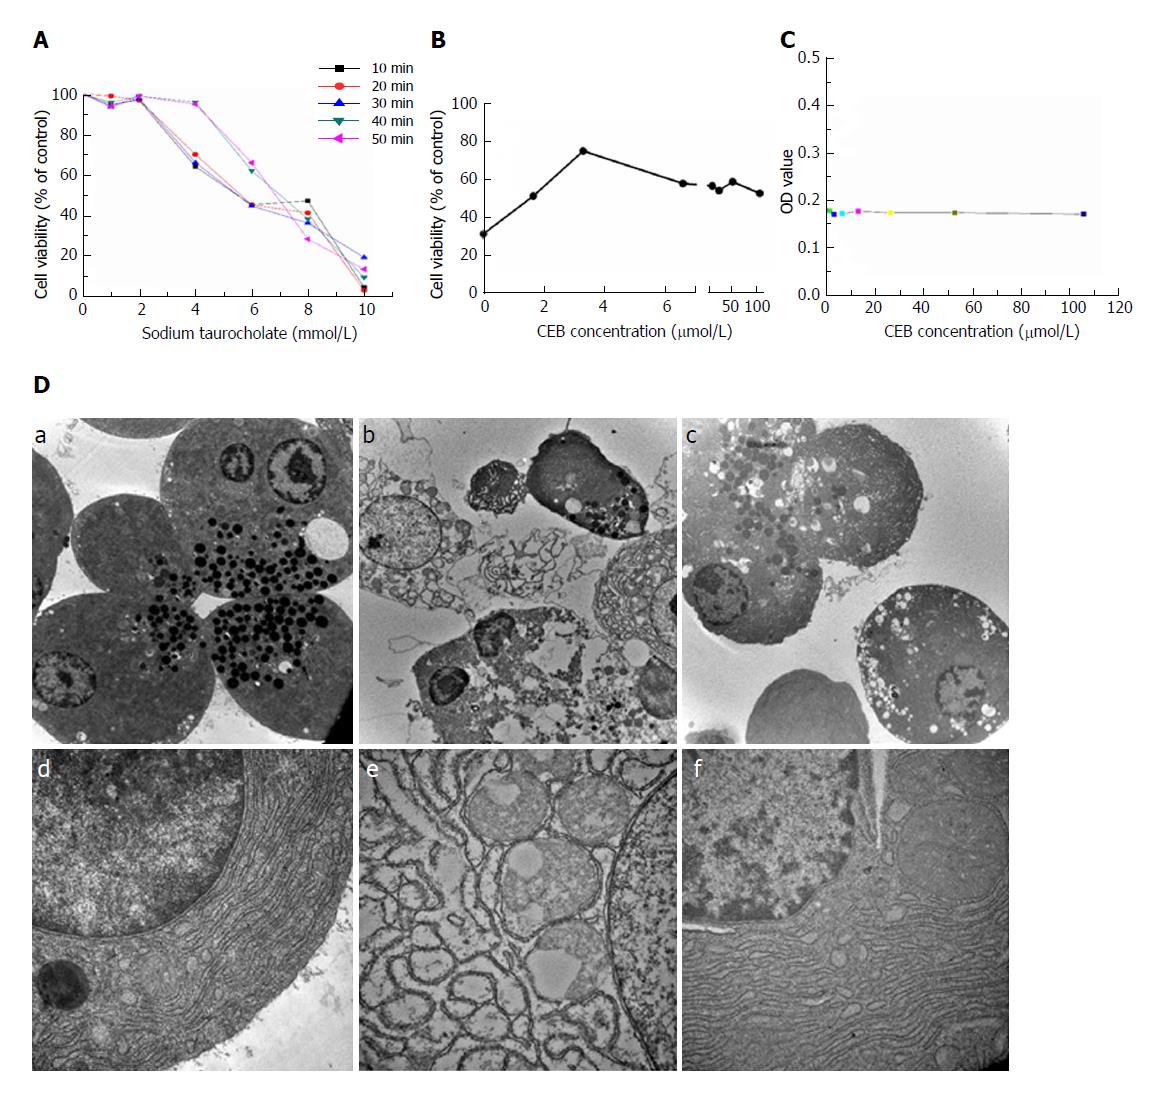
Figure 2 CEB alleviates cell injury in pancreatic acinar cells.
A: The cell viability decreased in a concentration- and time-dependent manner after sodium taurocholate treatment. B: CEB pretreatment increased the viability of cells treated with 8 mM sodium taurocholate and showed dose-dependent protective effects at 1.65-3.3 μmol/L. C: CEB alone had no adverse effect on normal pancreatic acinar cells at either low or high concentration, which suggested its reliability at the cellular level. D: Ultrastructure of pancreatic acinar cells. (a and d) Normal acinar cells showed ZGs concentrated in the apical pole of the cell, slick plasmalemma, and a roundish nucleus in the basal region of the cell. The rough ER was abundant and arranged in the parallel cisternae in the basal region, and numerous ribosomes were present on the membrane of the ER. (b and e) Acinar cells after a 1-min stimulation with sodium taurocholate. Plasmalemma was ruptured, and vacuoles accumulated in the cytoplasm. The ER was dilated and degranulated with lytic membranes. The ZG density also showed a marked reduction. (c and f) Acinar cells preincubated with CEB for 10 min. Vacuolization, cytolysis, and degranulation of ER were significantly alleviated (a-c, ×5000; d-f, ×30000).
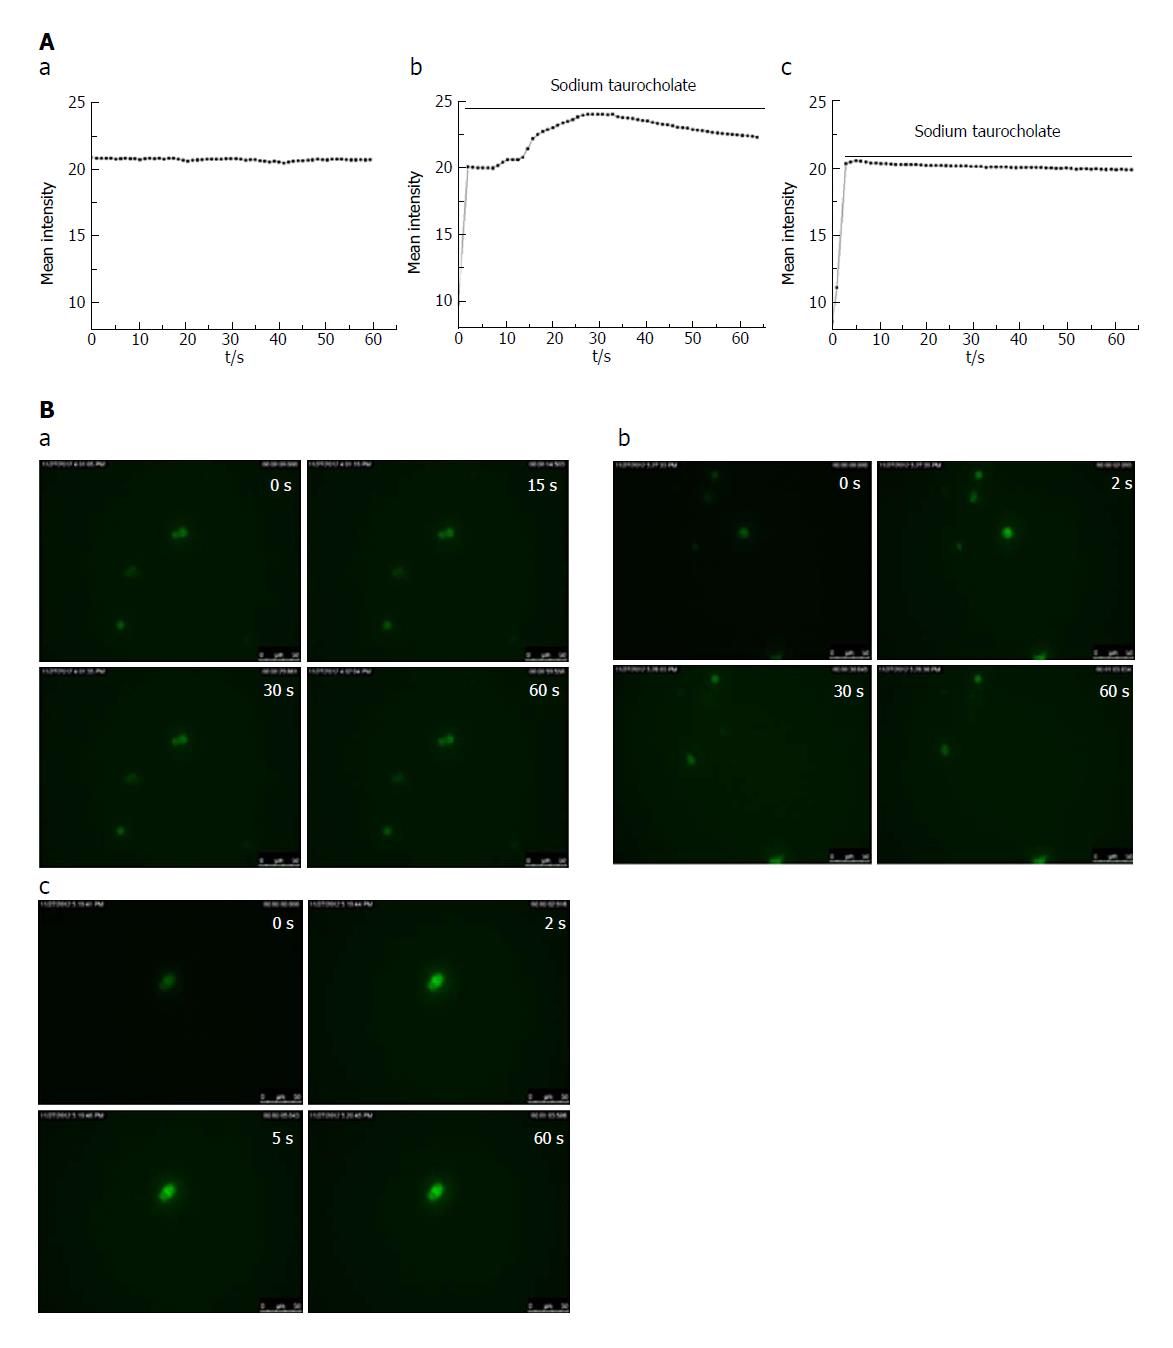
Figure 3 CEB inhibits sodium taurocholate-induced Ca2+ overload in isolated pancreatic acinar cells.
Cell fluorescence intensity represents the cell calcium concentration. A: Dynamic change in the calcium concentration induced by sodium taurocholate was inhibited by CEB: (a) Unaltered fluorescence intensity over time in the control group. (b) Cell fluorescence intensity was strengthened immediately within 2 s of the sodium taurocholate irritation and lasted at a high calcium concentration for 30 s, followed by a decrease in the SAP group. (c) Cell fluorescence intensity was increased within the first 2 s after the sodium taurocholate suscitation, was sustained at a high calcium concentration for 5 s, and then began to decrease in the CEB group. B: Cell images at representative time points. (a) Control group. (b) SAP group. (c) CEB group.
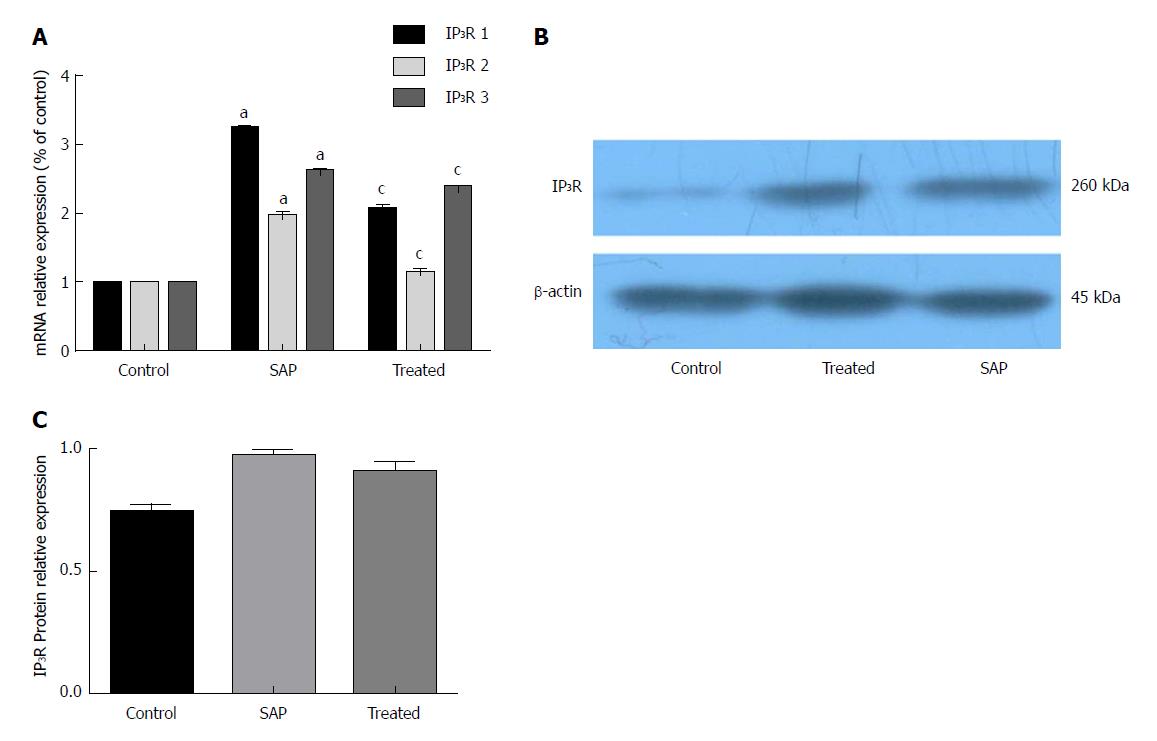
Figure 4 CEB decreases the expression of IP3R in pancreatic acinar cells.
A: Effects of CEB on the mRNA expression of three isoforms of IP3R (P < 0.05). B and C: CEB caused a reduced trend of IP3R protein expression but showed no significant difference (P > 0.05). aP < 0.05 vs the control group; cP < 0.05 vs the SAP group.
- Citation: Li J, Zhou R, Bie BB, Huang N, Guo Y, Chen HY, Shi MJ, Yang J, Zhang J, Li ZF. Emodin and baicalein inhibit sodium taurocholate-induced vacuole formation in pancreatic acinar cells. World J Gastroenterol 2018; 24(1): 35-45
- URL: https://www.wjgnet.com/1007-9327/full/v24/i1/35.htm
- DOI: https://dx.doi.org/10.3748/wjg.v24.i1.35


