Copyright
©The Author(s) 2018.
World J Gastroenterol. Jan 7, 2018; 24(1): 35-45
Published online Jan 7, 2018. doi: 10.3748/wjg.v24.i1.35
Published online Jan 7, 2018. doi: 10.3748/wjg.v24.i1.35
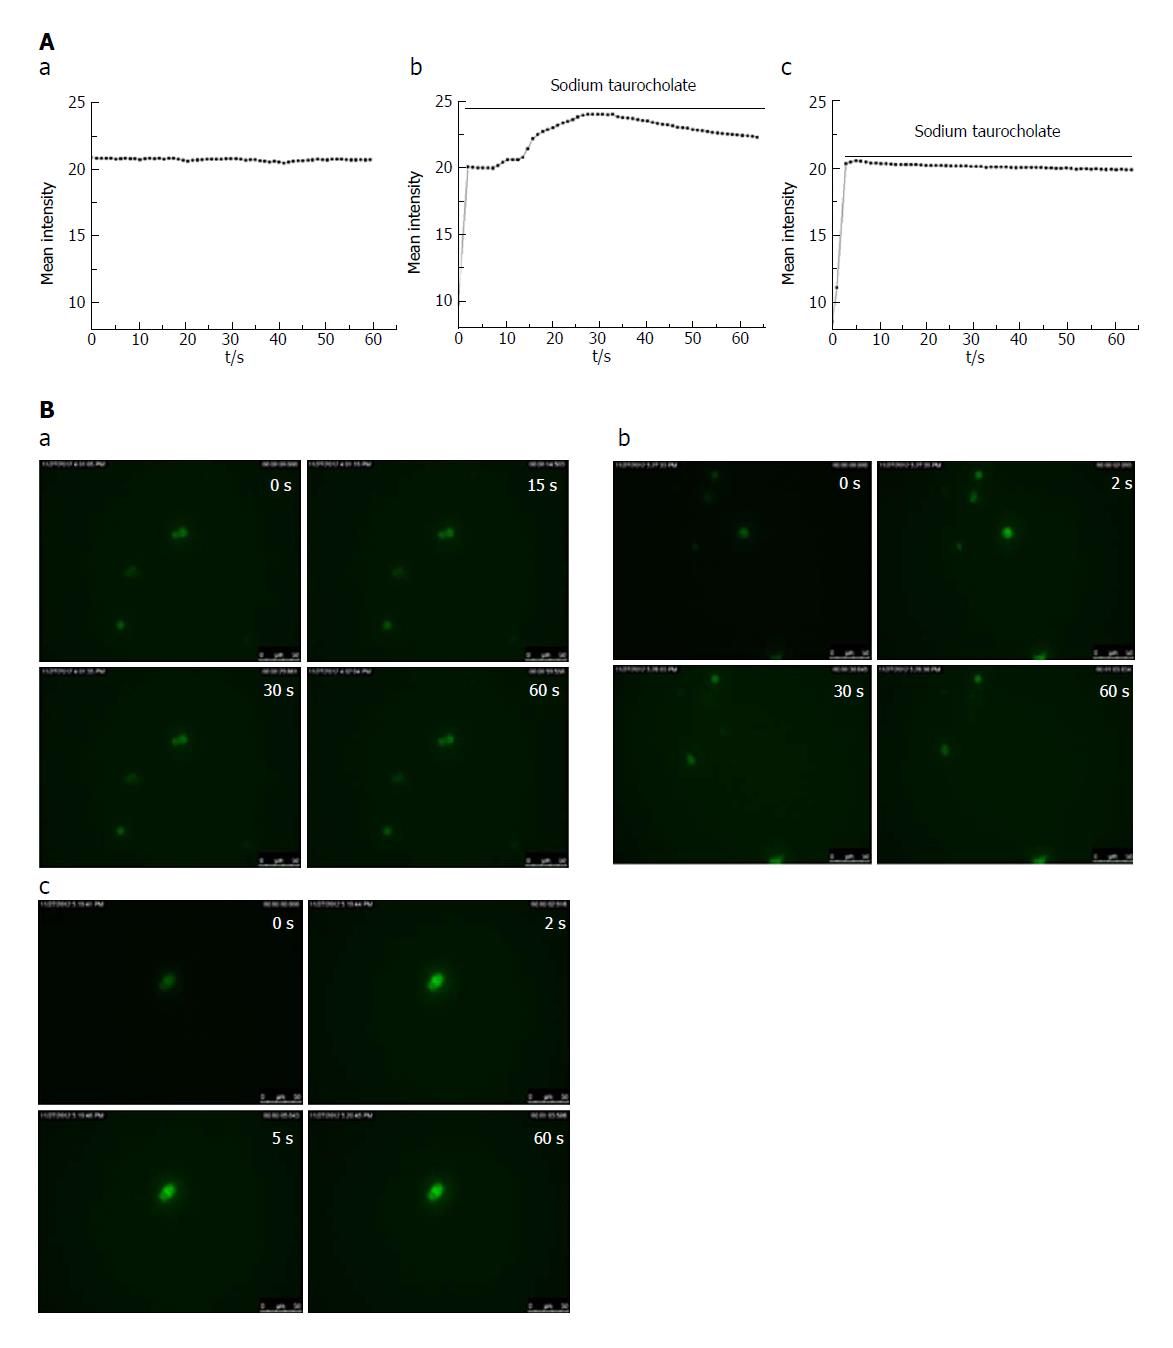
Figure 3 CEB inhibits sodium taurocholate-induced Ca2+ overload in isolated pancreatic acinar cells.
Cell fluorescence intensity represents the cell calcium concentration. A: Dynamic change in the calcium concentration induced by sodium taurocholate was inhibited by CEB: (a) Unaltered fluorescence intensity over time in the control group. (b) Cell fluorescence intensity was strengthened immediately within 2 s of the sodium taurocholate irritation and lasted at a high calcium concentration for 30 s, followed by a decrease in the SAP group. (c) Cell fluorescence intensity was increased within the first 2 s after the sodium taurocholate suscitation, was sustained at a high calcium concentration for 5 s, and then began to decrease in the CEB group. B: Cell images at representative time points. (a) Control group. (b) SAP group. (c) CEB group.
- Citation: Li J, Zhou R, Bie BB, Huang N, Guo Y, Chen HY, Shi MJ, Yang J, Zhang J, Li ZF. Emodin and baicalein inhibit sodium taurocholate-induced vacuole formation in pancreatic acinar cells. World J Gastroenterol 2018; 24(1): 35-45
- URL: https://www.wjgnet.com/1007-9327/full/v24/i1/35.htm
- DOI: https://dx.doi.org/10.3748/wjg.v24.i1.35


