Copyright
©The Author(s) 2017.
World J Gastroenterol. May 21, 2017; 23(19): 3468-3479
Published online May 21, 2017. doi: 10.3748/wjg.v23.i19.3468
Published online May 21, 2017. doi: 10.3748/wjg.v23.i19.3468
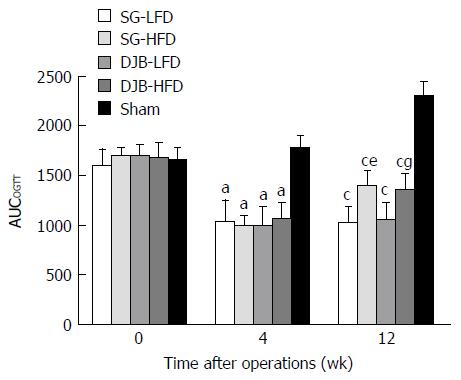
Figure 1 Areas under the curves for oral glucose tolerance test; of rats at baseline, 4 and 12 wk after operations.
aP < 0.05 vs Sham group at 4 wk postoperatively, cP < 0.05 vs Sham group at 12 wk postoperatively, eP < 0.05 vs SG-HFD group at 4 wk postoperatively, gP < 0.05 vs DJB-HFD group at 4 wk postoperatively. AUCOGTT: Areas under the curves for oral glucose tolerance test; SG: Sleeve gastrectomy; SG-LFD: SG rats with common low-fat diet; SG-HFD: SG with high-fat diet; DJB: Duodenal-jejunal bypass; DJB-LFD: DJB rats with LFD; DJB-HFD: DJB rats with HFD.
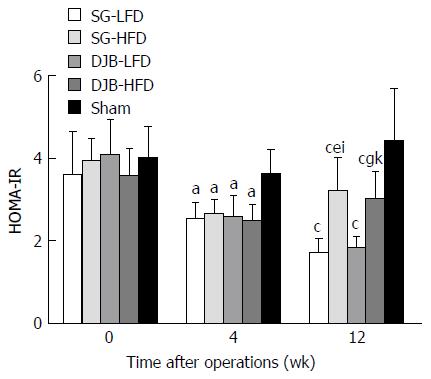
Figure 2 Homeostatic model assessment of insulin resistance of rats at baseline, 4 and 12 wk after operations.
aP < 0.05 vs Sham group at 4 wk postoperatively; cP < 0.05 vs Sham group at 12 wk postoperatively; eP < 0.05 vs SG-HFD group at 4 wk postoperatively; gP < 0.05 vs DJB-HFD group at 4 wk postoperatively; iP < 0.05 vs SG-LFD at 12 wk postoperatively; kP < 0.05 vs DJB-LFD at 12 wk postoperatively. HOMA-IR: Homeostatic model assessment of insulin resistance; SG: Sleeve gastrectomy; SG-LFD: SG rats with common low-fat diet; SG-HFD: SG with high-fat diet; DJB: Duodenal-jejunal bypass; DJB-LFD: DJB rats with LFD; DJB-HFD: DJB rats with HFD.
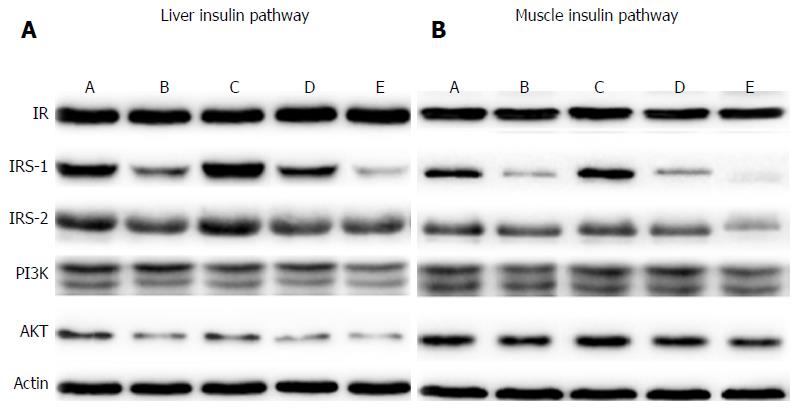
Figure 3 Western blot analysis of the insulin signaling pathway in liver and muscle.
Expression of IR, IRS-1, IRS-2, PI3K, AKT in (A) liver and (B) muscle. A: SG-LFD group; B: SG-HFD group; C: DJB-LFD group; D: DJB-HFD group; E: Sham group. SG: Sleeve gastrectomy; SG-LFD: SG rats with common low-fat diet; SG-HFD: SG with high-fat diet; DJB: Duodenal-jejunal bypass; DJB-LFD: DJB rats with LFD; DJB-HFD: DJB rats with HFD.
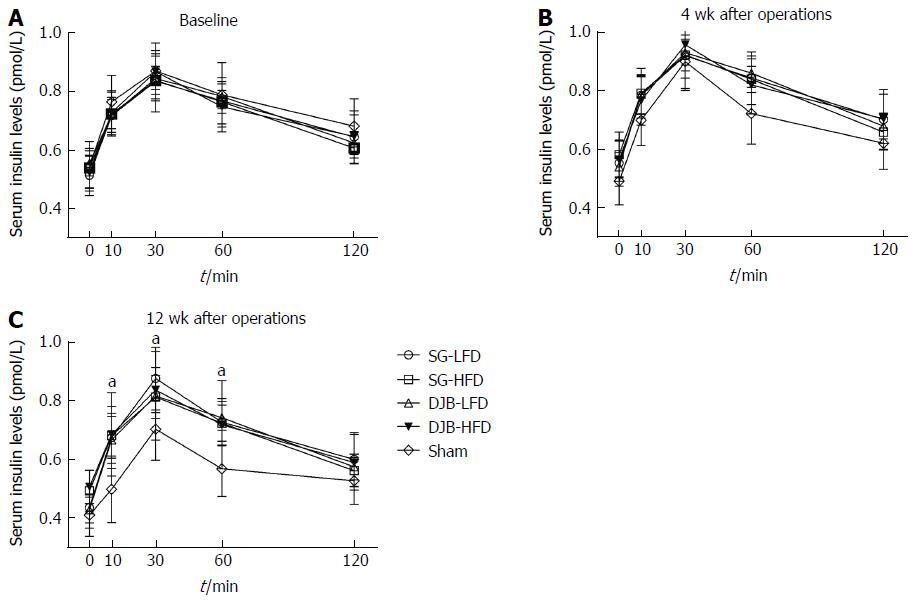
Figure 4 Serum insulin after oral glucose administration.
Serum insulin levels after oral glucose gavage (1 g/kg) at baseline (A), 4 (B) and 12 (C) wk postoperatively. No significant differences were observed in SG and DJB groups at 4 or 12 wk postoperatively. Insulin levels in response to oral glucose gavage increased in HFD and LFD rats at 12 wk postoperatively. aP < 0.05 vs Sham group at 12 wk postoperatively. SG: Sleeve gastrectomy; SG-LFD: SG rats with common low-fat diet; SG-HFD: SG with high-fat diet; DJB: Duodenal-jejunal bypass; DJB-LFD: DJB rats with LFD; DJB-HFD: DJB rats with HFD.
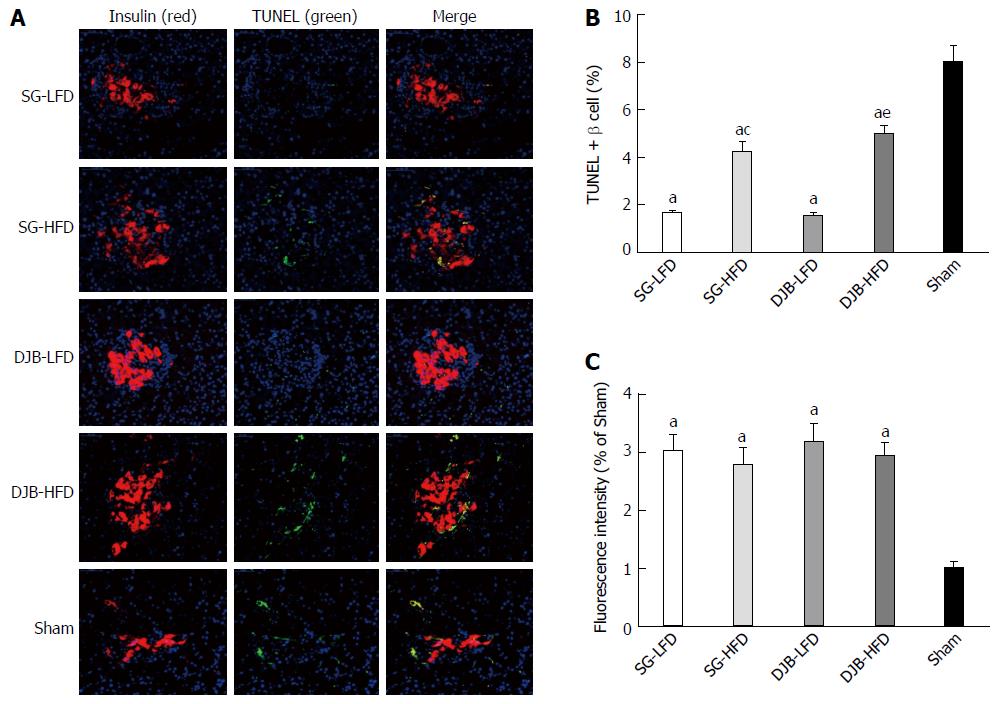
Figure 5 Pancreatic beta cell analysis.
A: TUNEL-positive beta cell shown by immunofluorescence; B: and the percentage of TUNEL-positive beta cells was calculated. The two surgery group had fewer TUNEL-positive beta cells than the Sham group, and HFD group made the percentage higher than in the LFD group; C: The fluorescence intensity did not differ significantly between the four surgery groups (P > 0.05), but was higher than in the Sham group. aP < 0.05 vs Sham group at 12 wk postoperatively; cP < 0.05 vs SG-LFD group at 12 wk postoperatively; eP < 0.05 vs DJB-LFD group at 12 wk postoperatively. TUNEL: Transferase-mediated dUTP-biotin 3’ nick end-labeling; SG: Sleeve gastrectomy; SG-LFD: SG rats with common low-fat diet; SG-HFD: SG with high-fat diet; DJB: Duodenal-jejunal bypass; DJB-LFD: DJB rats with LFD; DJB-HFD: DJB rats with HFD.
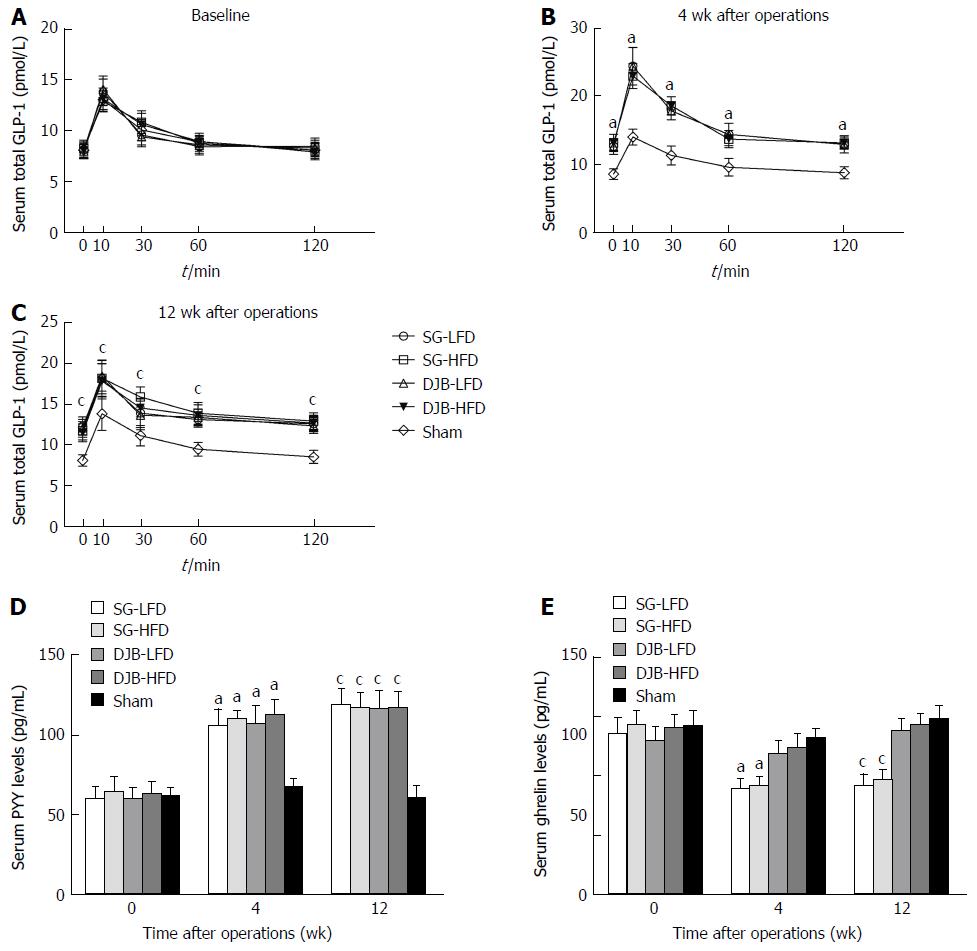
Figure 6 Glucagon-like peptide-1, PYY, ghrelin levels.
GLP-1 levels after oral glucose gavage (1 g/kg) at baseline (A), 4 (B) and 12 (C) weeks after surgery. PYY levels 1h after the oral glucose gavage (D). And the fasting ghrelin levels (E). aP < 0.05 vs Sham group at 4 wk postoperatively; cP < 0.05 vs Sham group at 12 wk postoperatively. SG: Sleeve gastrectomy; SG-LFD: SG rats with common low-fat diet; SG-HFD: SG with high-fat diet; DJB: Duodenal-jejunal bypass; DJB-LFD: DJB rats with LFD; DJB-HFD: DJB rats with HFD.
- Citation: Liu T, Zhong MW, Liu Y, Sun D, Wei M, Huang X, Cheng YG, Wu QZ, Wu D, Zhang XQ, Wang KX, Hu SY, Liu SZ. Diabetes recurrence after metabolic surgeries correlates with re-impaired insulin sensitivity rather than beta-cell function. World J Gastroenterol 2017; 23(19): 3468-3479
- URL: https://www.wjgnet.com/1007-9327/full/v23/i19/3468.htm
- DOI: https://dx.doi.org/10.3748/wjg.v23.i19.3468


