Copyright
©The Author(s) 2017.
World J Gastroenterol. May 21, 2017; 23(19): 3468-3479
Published online May 21, 2017. doi: 10.3748/wjg.v23.i19.3468
Published online May 21, 2017. doi: 10.3748/wjg.v23.i19.3468
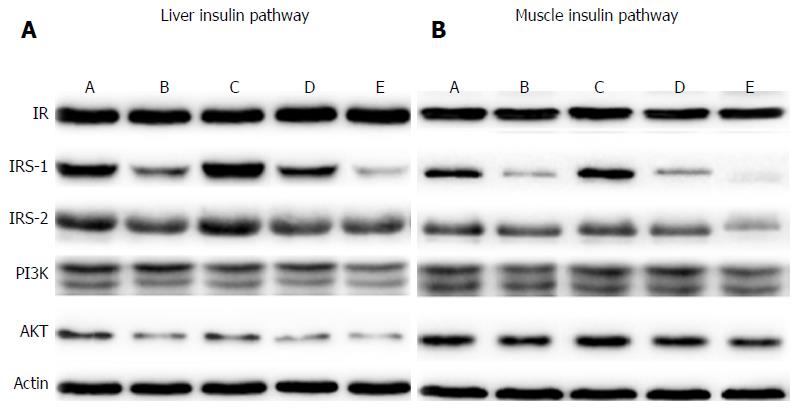
Figure 3 Western blot analysis of the insulin signaling pathway in liver and muscle.
Expression of IR, IRS-1, IRS-2, PI3K, AKT in (A) liver and (B) muscle. A: SG-LFD group; B: SG-HFD group; C: DJB-LFD group; D: DJB-HFD group; E: Sham group. SG: Sleeve gastrectomy; SG-LFD: SG rats with common low-fat diet; SG-HFD: SG with high-fat diet; DJB: Duodenal-jejunal bypass; DJB-LFD: DJB rats with LFD; DJB-HFD: DJB rats with HFD.
- Citation: Liu T, Zhong MW, Liu Y, Sun D, Wei M, Huang X, Cheng YG, Wu QZ, Wu D, Zhang XQ, Wang KX, Hu SY, Liu SZ. Diabetes recurrence after metabolic surgeries correlates with re-impaired insulin sensitivity rather than beta-cell function. World J Gastroenterol 2017; 23(19): 3468-3479
- URL: https://www.wjgnet.com/1007-9327/full/v23/i19/3468.htm
- DOI: https://dx.doi.org/10.3748/wjg.v23.i19.3468


