Copyright
©The Author(s) 2017.
World J Gastroenterol. Apr 7, 2017; 23(13): 2294-2307
Published online Apr 7, 2017. doi: 10.3748/wjg.v23.i13.2294
Published online Apr 7, 2017. doi: 10.3748/wjg.v23.i13.2294
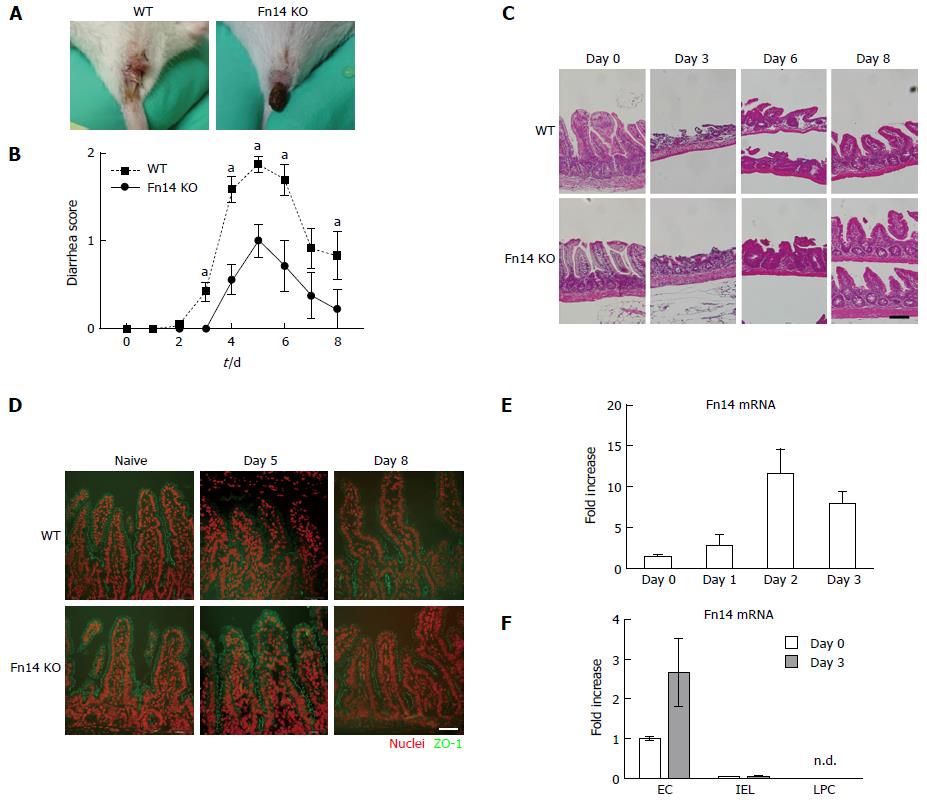
Figure 1 Fn14 deficiency ameliorated 5-FU-induced diarrhea and ileal damage.
A: Representative images of the macroscopic appearance of an anus from a WT mouse with liquid diarrhea and an Fn14 KO mouse with normal fecal pellets following 5-FU administration; B: Diarrhea scores after injection of 5-FU (day 0). Number of mice was about 7-44 at each time point. Results of mouse groups of different observation-time points and endpoints were accumulated and summarized (aP < 0.05); C: Formalin-fixed paraffin-embedded ileal sections were prepared from samples collected at the indicated time point from 5-FU-treated WT or Fn14 KO mice and stained with hematoxylin and eosin. Scale bar = 100 µm; D: Frozen ileal sections were prepared from samples collected at the indicated time point from 5-FU-treated WT or Fn14 KO mice (n = 3 mice per group) and probed with anti-ZO-1 antibody. Green: ZO-1, Red: Nuclear staining. Scale bar = 50 µm. Representative images are shown; E: Fold increase of Fn14 mRNA in total ileal mucosa after injection of 5-FU. Data are presented as the mean ± SD; F: Epithelial cells (EC), intraepithelial lymphocytes (IEL), and lamina propria cells (LPC) were separated from the ileum collected on day 0 (naïve) or day 3 after 5-FU injection, and Fn14 mRNA expression was measured (n = 3 mice per group). Data are presented as the mean ± SD.
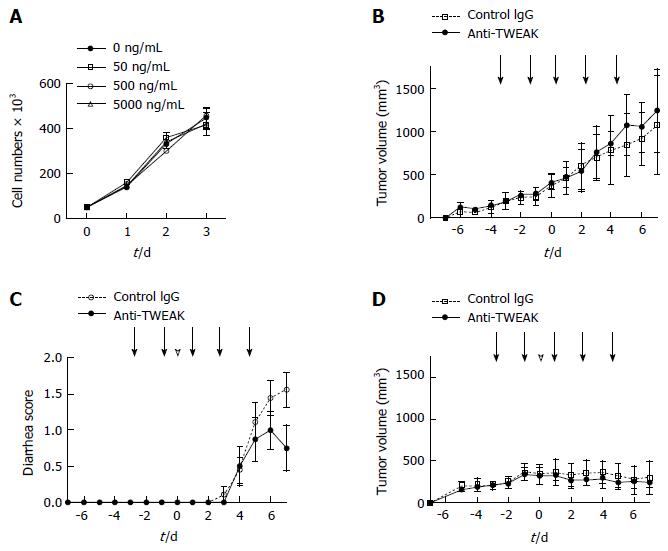
Figure 2 Blocking the TWEAK/Fn14 pathway prevents 5-FU-induced diarrhea in tumor-bearing mice.
A: CT26 cells were cultured with various doses of anti-TWEAK antibody. Cell numbers were counted at the indicated time using the trypan-blue dye exclusion method. Triplicate cultures were performed for each condition. Data are shown as a mean ± SD; B: CT26 cells were inoculated in WT mice on day -7 (n = 3 per group). Mice were injected with anti-TWEAK antibody or control IgG from day -3, and injections were repeated every other for the remainder of the study period (indicated as arrows). 5-FU was not administered. C26 tumor volume was monitored. Data are shown as mean ± SD; C: Diarrhea score of CT26 tumor-bearing WT mice treated with anti-TWEAK antibody (n = 8) or control IgG (n = 9). Experiment was performed as described in panel B with the addition of a single injection of 5-FU on day 0 (blank arrowhead); D: Tumor volume of measurements from the experiment described in (C).
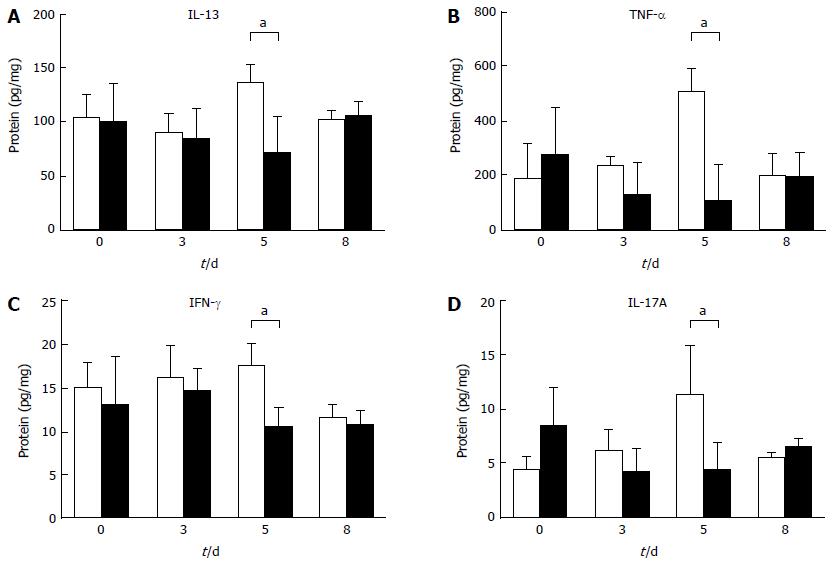
Figure 3 5-FU induced inflammatory cytokines in the ileum and the role of IL-13 in 5-FU-induced diarrhea.
A-D: Cytokine levels were measured from homogenate of the ileum following injection of 5-FU. Open bar, WT mice; solid bar, Fn14 KO mice (n = 4 mice per time point). Data are shown as mean ± SD (aP < 0.05).
Figure 4 Lack of response to IL-4 and IL-13 in IL-13Rα1 KO mice.
A: Bone marrow cells from WT or IL-13Rα1 KO mice were stimulated with IL-4 or IL-13 for 30 min, and phosphorylated (p)-STAT6 was detected using western blotting. GAPDH was used as a loading control; B: Diarrhea scores of WT (n > 8, at each time point), Fn14 KO (n > 9), and IL-13Rα1 KO mice (n > 5) after injection of 5-FU. Number of mice was about 5-44 at each time point. Results of mouse groups of different observation-time points and endpoints were accumulated and summarized (aP < 0.05).
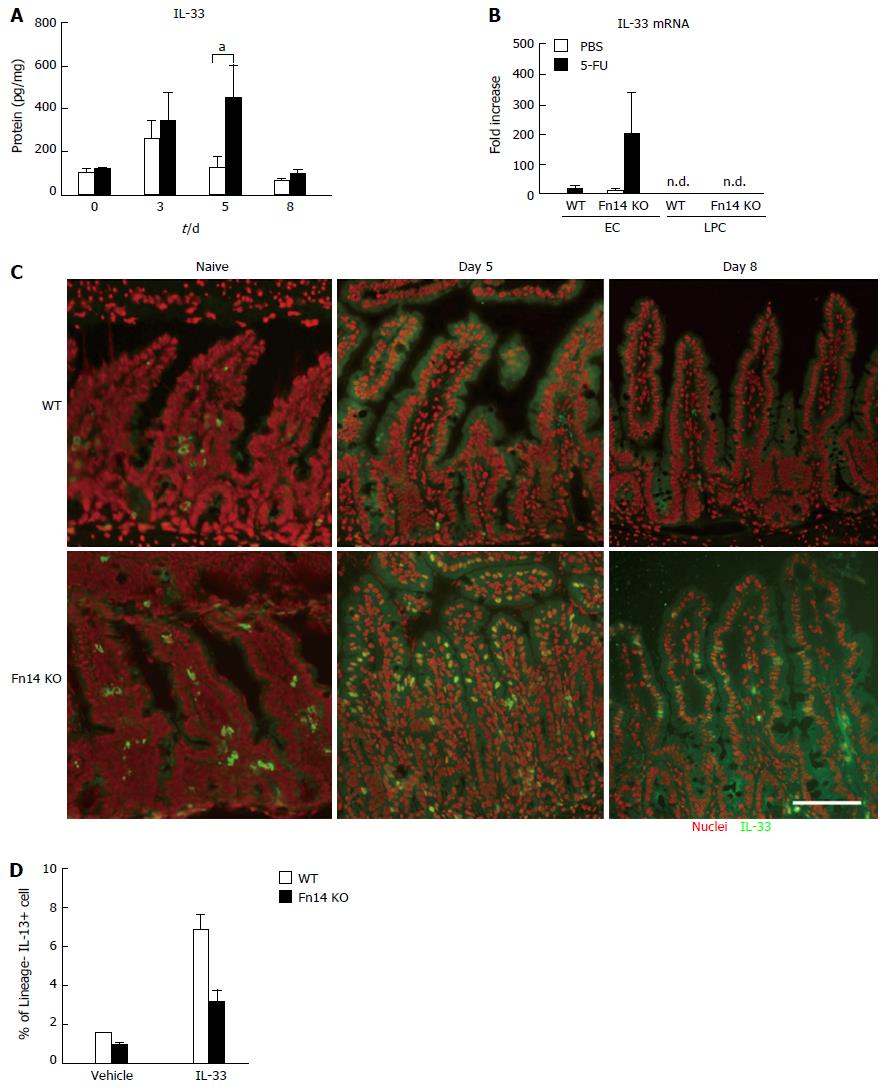
Figure 5 IL-33-induced IL-13 expression was Fn14 dependent.
A: IL-33 levels were measured from homogenate of the ileum after injection of 5-FU (n = 4 mice per time point). Open bar, WT mice; solid bar, Fn14 KO mice (n = 4 mice per time point). Data are shown as mean ± SD (aP < 0.05); B: Fold increase of IL-33 mRNA in ECs and LPCs on day 5 after injection of 5-FU (n = 3 mice per experiment). Data are shown as mean ± SD; C: Sections were prepared from samples collected on days 0 (naïve), 5, and 8 after injection of 5-FU from WT and Fn14 KO mice and probed with anti-IL-33 antibody (green) (n = 3 mice per experimental condition). Red: Nuclear staining. Scale bar = 100 µm. Representative images are provided; D: LPCs from naïve WT or Fn14 KO ileum were stimulated with recombinant IL-33 in vitro and the number of IL-13-producing cells per mouse was measured using flow cytometry. Results of repeated experiments (n = 3) are summarized.
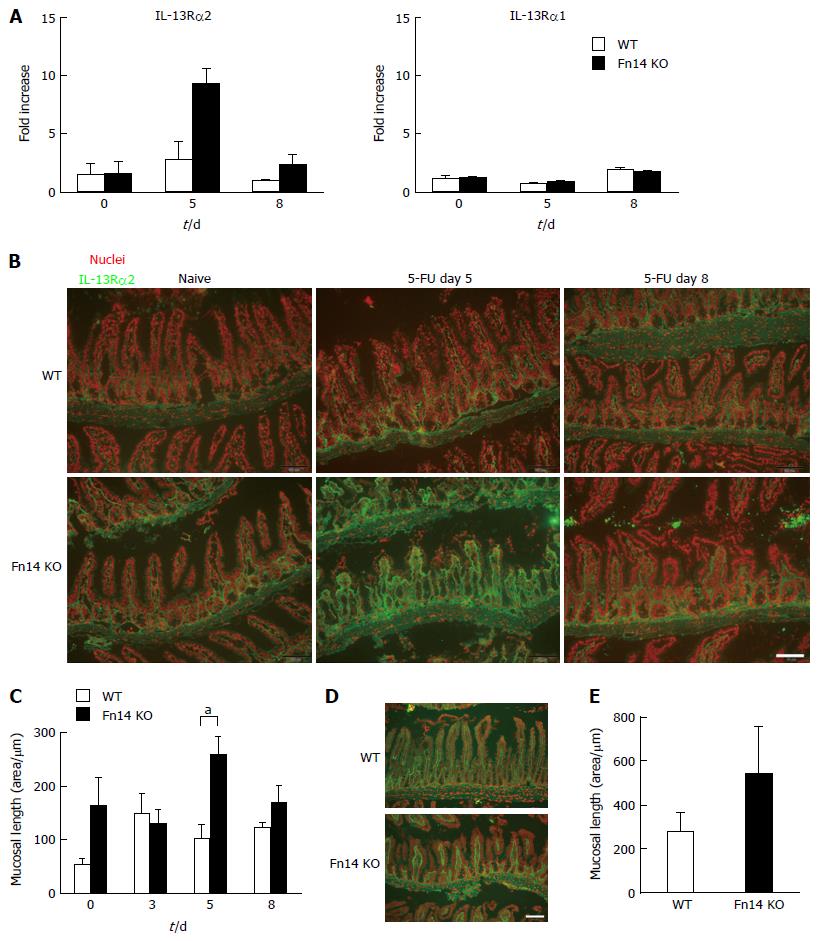
Figure 6 Upregulation of IL-13Rα2 expression in 5-FU treated Fn14 KO mice.
A: Fold increase of IL-13Rα2 and IL-13Rα1 mRNA in total ileum from WT or Fn14 KO mice after 5-FU treatment (n = about 3-5 mice per group). Data are shown as mean ± SD; B: Representative images from immunohistochemistry of IL-13Rα2 in ileum from WT and Fn14 KO mice on days 0 (naïve), 5, and 8 after injection of 5-FU. Green, IL-13Rα2; red, nuclei. Scale bar = 100 µm; C: Quantification of IL-13Rα2 expression. The IL-13Rα2-positive area of images from the experiment described in (B) were quantified following normalization by mucosal length (n = 4 mice per group). aP < 0.05; D: Recombinant IL-13 (400 µg) was injected into naïve WT or Fn14 KO mice. After 3 d, ileum samples were collected, and sections were probed with anti-IL-13Rα2 antibody. Green, IL-13Rα2; red, nuclei. Scale bar = 100 µm; E: Quantification of IL-13Rα2 expression normalized to mucosal length. The IL-13Rα2-positive area of images from the experiment described in (D) were quantified (n = 4 mice per group). There was no statistically significant difference between WT and Fn14 KO mice.
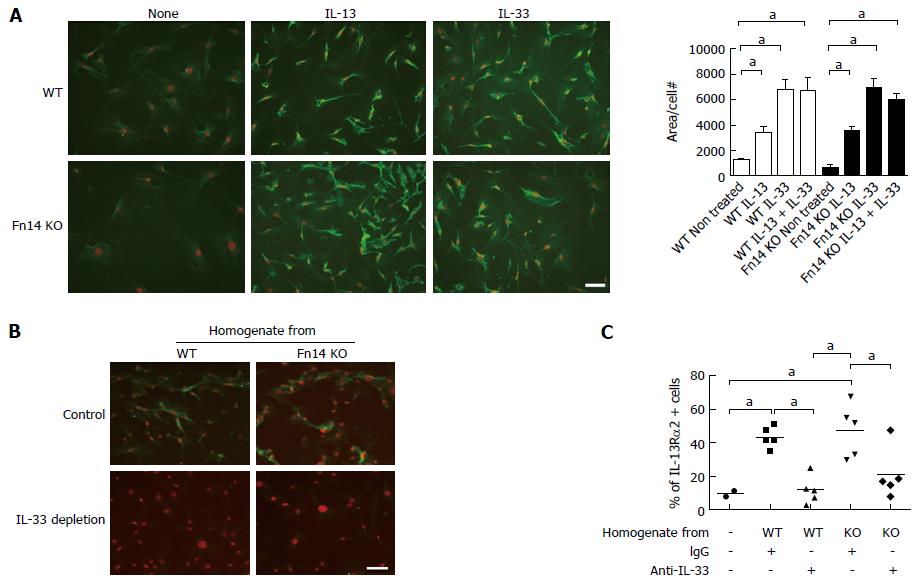
Figure 7 Recombinant IL-33 and IL-33 from 5-FU-treated ileum induced IL-13Rα2 expression in mouse embryonic fibroblasts.
A: Mouse embryonic fibroblasts (MEFs) obtained from WT and Fn14 KO mice were cultured with IL-13 or IL-33 for 3 d and probed with anti-IL-13Rα2 antibody. Green, IL-13Rα2; red, nuclei. Scale bar = 200 µm. IL-13Rα2-positive area was normalized by number of nuclei in the image and quantified (right). Data are shown as mean ± SD of four images from four independent cultures. aP < 0.05; B: WT MEFs were cultured with the homogenate of ileum obtained from WT or Fn14 KO mice 2 d after 5-FU treatment. IL-33 was depleted using immunoprecipitation with anti-IL-33 antibody or control IgG. After 3 d of culture with homogenate, cells were probed with anti-IL-13Rα2 antibody. Green, IL-13Rα2; red, nuclei. Scale bar = 100 µm; C: The percent of IL-13Rα2-positive cells was quantified from the images collected during the experiment described in (B). Each dot represents an individual culture. Bars indicate means. aP < 0.05. KO indicates Fn14 KO mice.
- Citation: Sezaki T, Hirata Y, Hagiwara T, Kawamura YI, Okamura T, Takanashi R, Nakano K, Tamura-Nakano M, Burkly LC, Dohi T. Disruption of the TWEAK/Fn14 pathway prevents 5-fluorouracil-induced diarrhea in mice. World J Gastroenterol 2017; 23(13): 2294-2307
- URL: https://www.wjgnet.com/1007-9327/full/v23/i13/2294.htm
- DOI: https://dx.doi.org/10.3748/wjg.v23.i13.2294


