Copyright
©The Author(s) 2017.
World J Gastroenterol. Apr 7, 2017; 23(13): 2294-2307
Published online Apr 7, 2017. doi: 10.3748/wjg.v23.i13.2294
Published online Apr 7, 2017. doi: 10.3748/wjg.v23.i13.2294
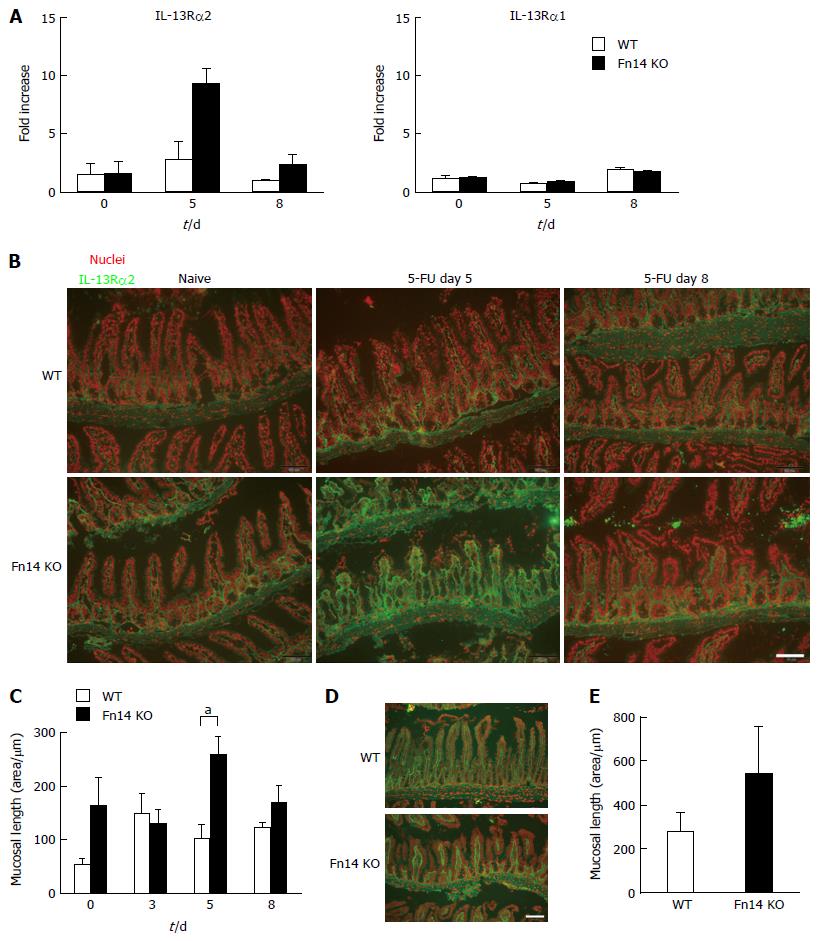
Figure 6 Upregulation of IL-13Rα2 expression in 5-FU treated Fn14 KO mice.
A: Fold increase of IL-13Rα2 and IL-13Rα1 mRNA in total ileum from WT or Fn14 KO mice after 5-FU treatment (n = about 3-5 mice per group). Data are shown as mean ± SD; B: Representative images from immunohistochemistry of IL-13Rα2 in ileum from WT and Fn14 KO mice on days 0 (naïve), 5, and 8 after injection of 5-FU. Green, IL-13Rα2; red, nuclei. Scale bar = 100 µm; C: Quantification of IL-13Rα2 expression. The IL-13Rα2-positive area of images from the experiment described in (B) were quantified following normalization by mucosal length (n = 4 mice per group). aP < 0.05; D: Recombinant IL-13 (400 µg) was injected into naïve WT or Fn14 KO mice. After 3 d, ileum samples were collected, and sections were probed with anti-IL-13Rα2 antibody. Green, IL-13Rα2; red, nuclei. Scale bar = 100 µm; E: Quantification of IL-13Rα2 expression normalized to mucosal length. The IL-13Rα2-positive area of images from the experiment described in (D) were quantified (n = 4 mice per group). There was no statistically significant difference between WT and Fn14 KO mice.
- Citation: Sezaki T, Hirata Y, Hagiwara T, Kawamura YI, Okamura T, Takanashi R, Nakano K, Tamura-Nakano M, Burkly LC, Dohi T. Disruption of the TWEAK/Fn14 pathway prevents 5-fluorouracil-induced diarrhea in mice. World J Gastroenterol 2017; 23(13): 2294-2307
- URL: https://www.wjgnet.com/1007-9327/full/v23/i13/2294.htm
- DOI: https://dx.doi.org/10.3748/wjg.v23.i13.2294


