Copyright
©The Author(s) 2017.
World J Gastroenterol. Mar 28, 2017; 23(12): 2141-2148
Published online Mar 28, 2017. doi: 10.3748/wjg.v23.i12.2141
Published online Mar 28, 2017. doi: 10.3748/wjg.v23.i12.2141
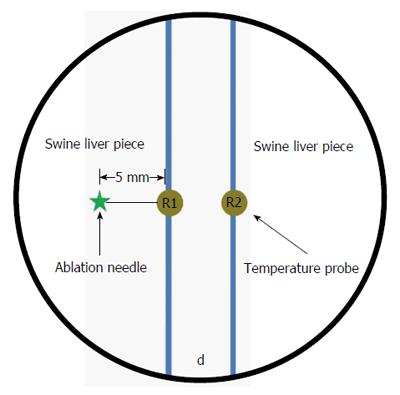
Figure 1 Schematic of the experimental set-up used for ex vivo microwave ablations in a 6-well plate.
Two swine liver pieces were held at a specific distance, d, which were set to 5 mm or 10 mm. This separation provides a hydrodissection barrier. The ablation needle and temperature probes were positioned in parallel. The distance was always 5 mm between the ablation needle and the primary needle (R1).
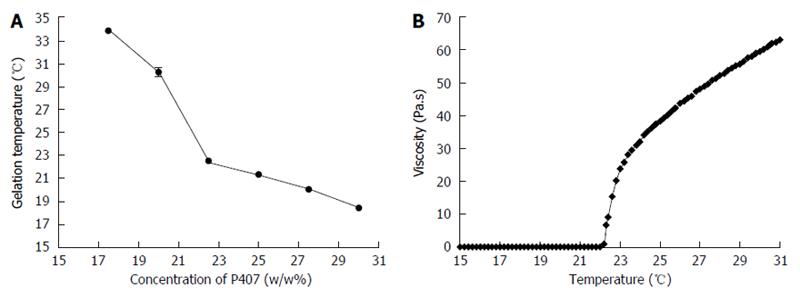
Figure 2 Optimal formulation.
A: Several concentrations of P407 were prepared. A stirring magnetic bar was used to determine the gelation temperature. When the magnetic bar stopped moving, the solution was considered gelled. The reliable data were defined three times in parallel (mean ± SD, n = 3). A negative correlation was observed between gelation temperatures and concentrations of P407. A 22.5% (w/w) P407 solution was found to gel at 22.3 °C; B: A Brookfield R/S+ rheometer with a spindle attached was used to study the viscosity of 22.5% (w/w) P407 solution. It was programmed to increase the temperature from 15 °C to 30 °C at a shear rate of 5/s. The viscosity was relatively low at temperatures below 18 °C and characterized as a fluidic state. Then, a sharp increase in viscosity was observed as an inflexion point was reached at sol-gel transition temperature (22.3 °C). By this time, it turned into a semi-solid.
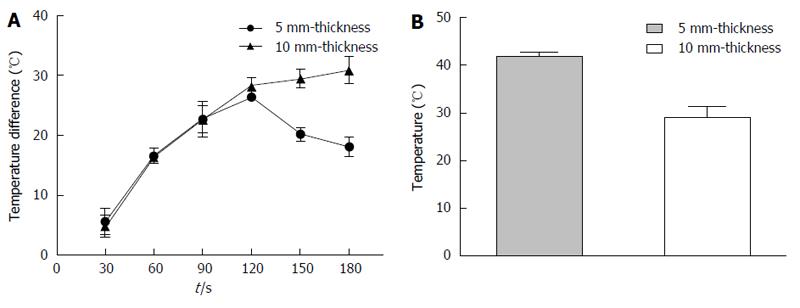
Figure 3 Ex vivo microwave ablation and temperature testing.
A: Temperature differences between R1 and R2 when 5 mm-thick and 10 mm-thick gels were maintained; B: Temperatures of R2 when the temperature at R1 was 60 °C. The mean temperature at R2 was 41.9 ± 1.1 °C with a 5 mm-thick gel. When the gel was prepared for 10 mm-thick separation, the mean temperature at R2 was 29.1 ± 2.4 °C.
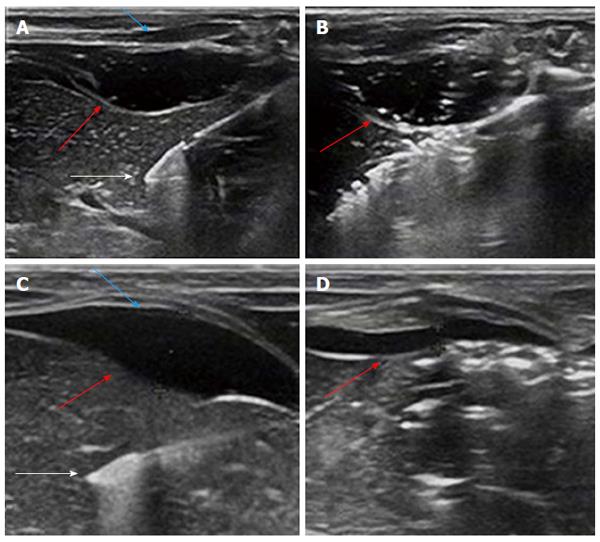
Figure 4 Ultrasonographic view.
A: Ultrasonographic view of the placement of the ablation needle (white arrow) with the poloxamer 407 (P407) gel (red arrow) positioned between the diaphragm (blue arrow) and liver; B: Image captured to assess the change in the size of P407 barrier at 3 min during microwave ablation. No apparent thinning was observed (red arrow); C: Ultrasound image showing a saline barrier (red arrow) of 5 mm thickness between the diaphragm (blue arrow) and liver and the placement of ablation needle (white arrow); D: Ultrasound image showing a hydrodissection barrier of about 1.3 mm thickness (red arrow) at the end of the ablation procedure.
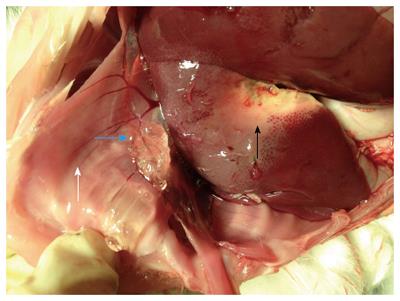
Figure 5 Upon performing a laparotomy, the gel (blue arrow) is seen between the diaphragm (white arrow) and liver lobe (black arrow).
Photograph showing a microwave ablation zone at the liver lobe (black arrow), yet no thermal injury to the diaphragm can be observed.
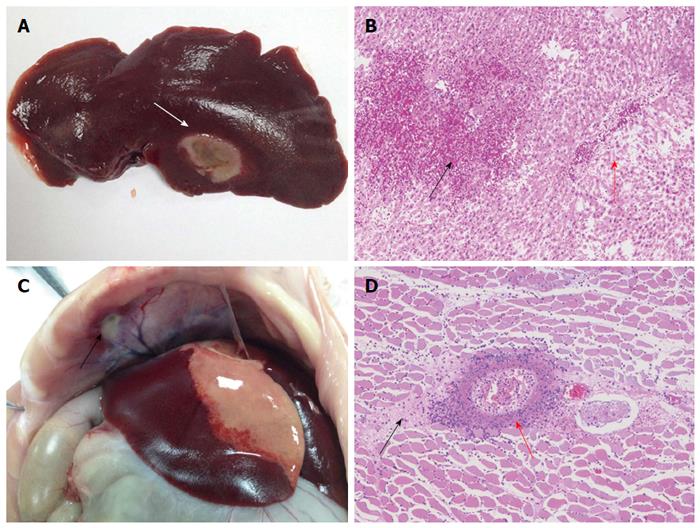
Figure 6 Histopathologic images of thermal lesions of the liver and diaphragm.
A: Photograph showing a gray microwave ablation lesion (white arrow) in the liver lobe; B: Image depicting liver tissue congestion (black arrow), local hepatic sinus expansion, and hepatic cord disappearance due to atrophy and necrosis (red arrow); C: Photograph highlighting a gray-white lesion in the diaphragm (black arrow); D: Image showing a large number of inflammatory cells (red arrow) around the diaphragm and local necrocytosis of the muscular tissue (black arrow).
- Citation: Zhang LL, Xia GM, Liu YJ, Dou R, Eisenbrey J, Liu JB, Wang XW, Qian LX. Effect of a poloxamer 407-based thermosensitive gel on minimization of thermal injury to diaphragm during microwave ablation of the liver. World J Gastroenterol 2017; 23(12): 2141-2148
- URL: https://www.wjgnet.com/1007-9327/full/v23/i12/2141.htm
- DOI: https://dx.doi.org/10.3748/wjg.v23.i12.2141


