Copyright
©The Author(s) 2017.
World J Gastroenterol. Mar 28, 2017; 23(12): 2141-2148
Published online Mar 28, 2017. doi: 10.3748/wjg.v23.i12.2141
Published online Mar 28, 2017. doi: 10.3748/wjg.v23.i12.2141
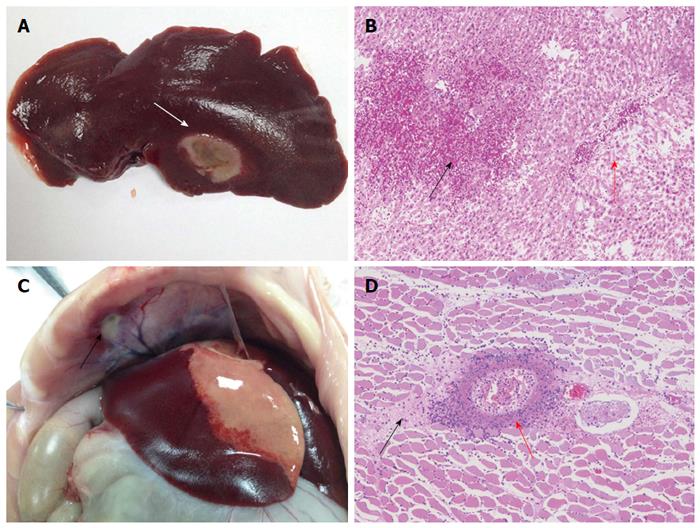
Figure 6 Histopathologic images of thermal lesions of the liver and diaphragm.
A: Photograph showing a gray microwave ablation lesion (white arrow) in the liver lobe; B: Image depicting liver tissue congestion (black arrow), local hepatic sinus expansion, and hepatic cord disappearance due to atrophy and necrosis (red arrow); C: Photograph highlighting a gray-white lesion in the diaphragm (black arrow); D: Image showing a large number of inflammatory cells (red arrow) around the diaphragm and local necrocytosis of the muscular tissue (black arrow).
- Citation: Zhang LL, Xia GM, Liu YJ, Dou R, Eisenbrey J, Liu JB, Wang XW, Qian LX. Effect of a poloxamer 407-based thermosensitive gel on minimization of thermal injury to diaphragm during microwave ablation of the liver. World J Gastroenterol 2017; 23(12): 2141-2148
- URL: https://www.wjgnet.com/1007-9327/full/v23/i12/2141.htm
- DOI: https://dx.doi.org/10.3748/wjg.v23.i12.2141


