Copyright
©The Author(s) 2017.
World J Gastroenterol. Mar 14, 2017; 23(10): 1816-1827
Published online Mar 14, 2017. doi: 10.3748/wjg.v23.i10.1816
Published online Mar 14, 2017. doi: 10.3748/wjg.v23.i10.1816
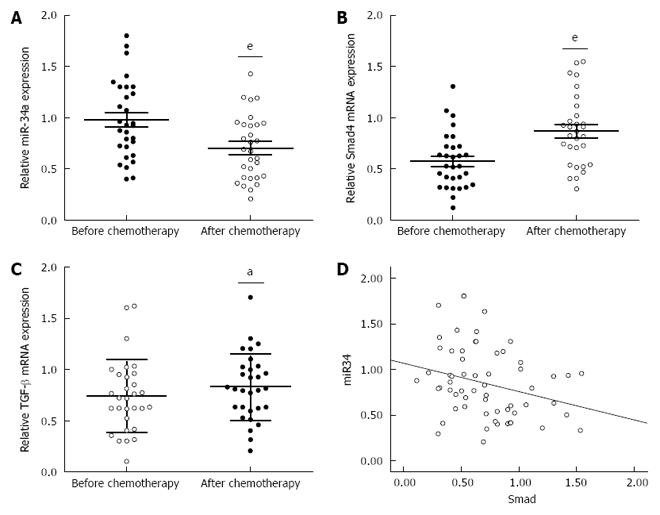
Figure 1 miR-34a levels were significantly decreased after oxaliplatin treatment.
A: Analysis of miR-34a expression was performed on blood samples from 30 colorectal cancer (CRC) patients after oxaliplatin (OXA)-based combination chemotherapy. Total RNA was extracted and subjected to qRT-PCR to analyze the expression level of miR-34a in each sample. U6 was used as an internal control; B and C: mRNA expression levels of Smad4 and TGF-β in the blood samples from CRC patients were measured by qRT-PCR. β-actin was used as the internal control (aP < 0.05, eP < 0.001); D: The inverse correlation of miR-34a and Smad4 expression levels was examined by Spearman correlation analysis (R = -0.283, P = 0.029).
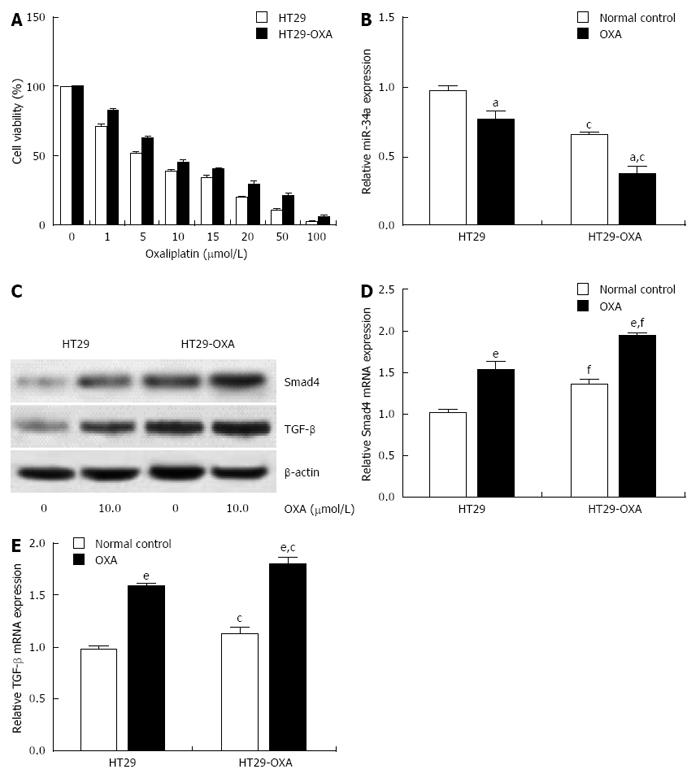
Figure 2 Oxaliplatin treatment inhibited miR-34a expression and activated the TGF-β/Smad4 pathway.
A: HT29 and HT29-oxaliplatin (OXA) cells were incubated with serial concentrations of OXA for 48 h and cell viability (%) was measured by CCK-8 kit and normalized with the corresponding untreated cells; B: HT29 and HT29-OXA cells were incubated with OXA (10 μmol/L) for 48 h and expression of miR-34a was determined by qRT-PCR. U6 was used as an internal control; C: The above cells lysates were examined with indicated antibodies by western blotting. β-actin was used as loading control; D and E: The above cells were subjected to qRT-PCR to measure Smad4 and TGF-β mRNA expression levels. β-actin was used as the internal control (aP < 0.05, eP < 0.001 indicates a significant difference vs normal control. cP < 0.05, fP < 0.001 indicates a significant difference vs respective untreated cells).
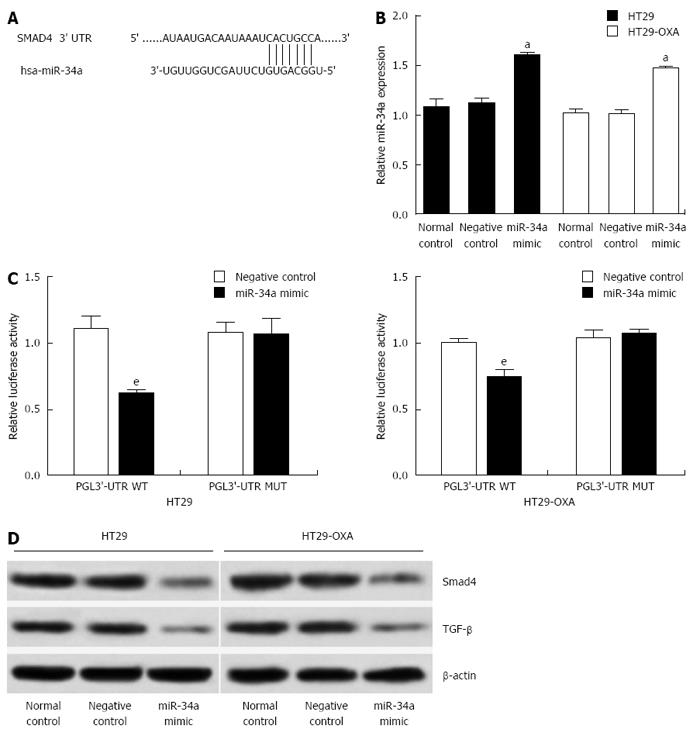
Figure 3 miR-34a directly regulated Smad4 expression and TGF-β inhibition in colorectal cancer cells.
A: miRNA target prediction screened one computative miR-34a binding site at Smad4 3’-UTR; B: qRT-PCR analysis of expression of miR-34a treated with miR-34a mimics in HT29 and HT29-OXA cells (aP < 0.05). U6 was used as a loading control. Error bars represent mean ± SD from three independent experiments; C: 3’-UTR luciferase reporter assay showed a reduction of relative luciferase activity of wild-type Smad4 3’-UTR by pre-miR-34a in HT29 and HT29-OXA cells (eP < 0.001); D: Western blotting of Smad4 and TGF-β expression in HT29 and HT29-OXA cells treated with miR-34a mimic. β-actin expression level was used as internal loading control.
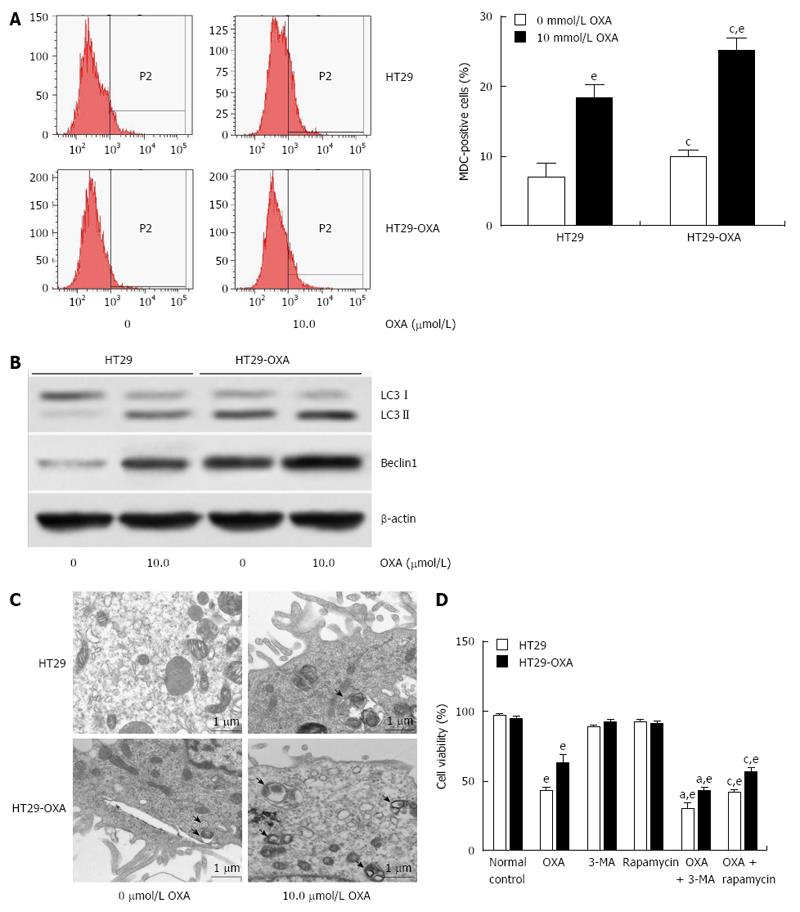
Figure 4 Activation of autophagy contributed to oxaliplatin resistance in colorectal cancer cells.
A: HT29 and HT29-oxaliplatin (OXA) cells were incubated with or without 10 μmol/L OXA for 48 h, and autophagy was determined by monodansylcadaverine (MDC)-positive stained cells using flow cytometry; B: Western blotting showed a significant increase in expression of the autophagic markers LC3-II and beclin-1 in HT29 and HT29-OXA cells with or without OXA treatment. The data represent the results of three separate experiments; C: Representative electron micrographs demonstrated autophagic vacuole formation in each group. The arrows indicate the double-membrane vacuoles digesting organelles or cytosolic contents; D: Autophagy regulated chemoresistance of OXA in HT29 and HT29-OXA cells (eP < 0.001 indicates a significant difference vs normal control; aP < 0.05 indicates a significant difference vs 3-MA treatment group; cP < 0.05 indicates a significant difference vs rapamycin treatment group).
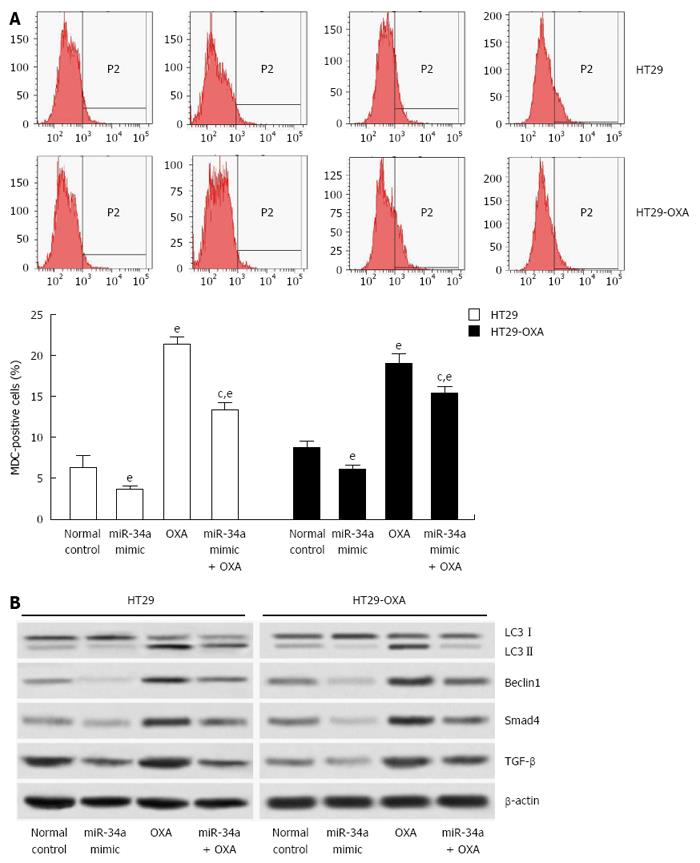
Figure 5 miR-34a inhibited oxaliplatin-induced autophagy in colorectal cancer cells.
A: HT29 and HT29-oxaliplatin (OXA) cells were transfected with miR-34a mimics and treated with or without OXA (10 μmol/L) simultaneously. After 48 h, autophagy was determined using a fluorescent dye (monodansylcadaverine, MDC) and flow cytometry; B: The above cell lysates were examined with indicated antibodies by western blotting. β-actin was used as loading control. (eP < 0.001 indicates a significant difference vs normal control; cP < 0.05 indicates a significant difference vs transfection with miR-34a mimic group).
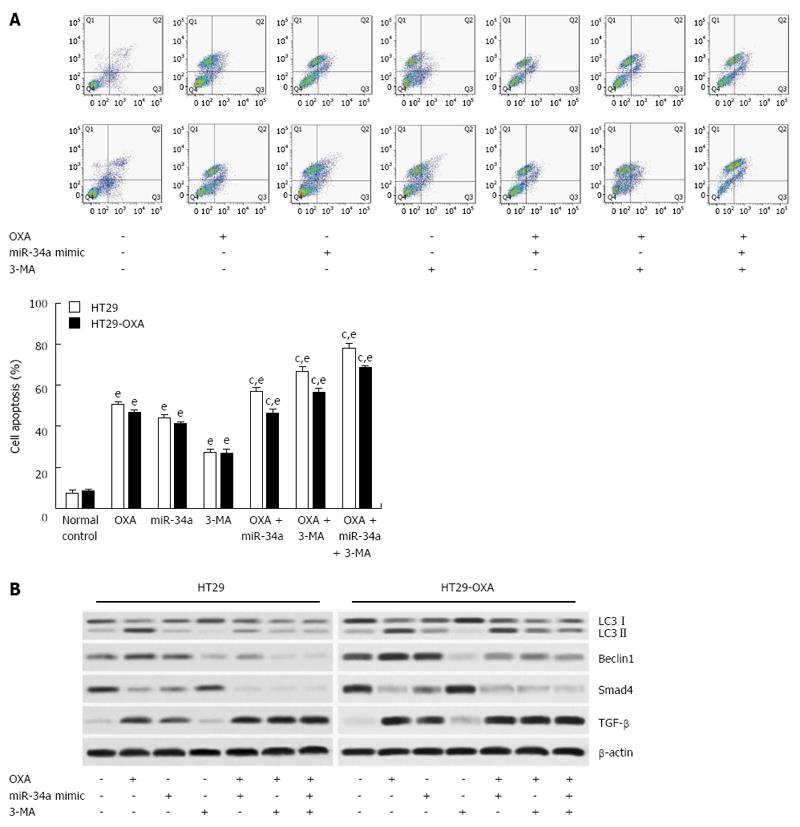
Figure 6 Activation of autophagy protected colorectal cancer cells against oxaliplatin-induced apoptosis by inhibiting miR-34a through the TGF-β/Smad4 pathway.
A: HT29 and HT29-oxaliplatin (OXA) cells were transfected with miR-34a mimics and treated with OXA (10 μmol/L) and simultaneously mixed with or without 3-MA. After 48 h, the apoptosis rate was examined by flow cytometry; B: The above cell lysates were examined with the indicated antibodies by western blotting. β-actin was used as loading control. eP < 0.001 indicates a significant difference vs normal control; cP < 0.05 indicates a significant difference vs group treated with OXA.
- Citation: Sun C, Wang FJ, Zhang HG, Xu XZ, Jia RC, Yao L, Qiao PF. miR-34a mediates oxaliplatin resistance of colorectal cancer cells by inhibiting macroautophagy via transforming growth factor-β/Smad4 pathway. World J Gastroenterol 2017; 23(10): 1816-1827
- URL: https://www.wjgnet.com/1007-9327/full/v23/i10/1816.htm
- DOI: https://dx.doi.org/10.3748/wjg.v23.i10.1816


