Copyright
©The Author(s) 2017.
World J Gastroenterol. Jan 7, 2017; 23(1): 60-75
Published online Jan 7, 2017. doi: 10.3748/wjg.v23.i1.60
Published online Jan 7, 2017. doi: 10.3748/wjg.v23.i1.60
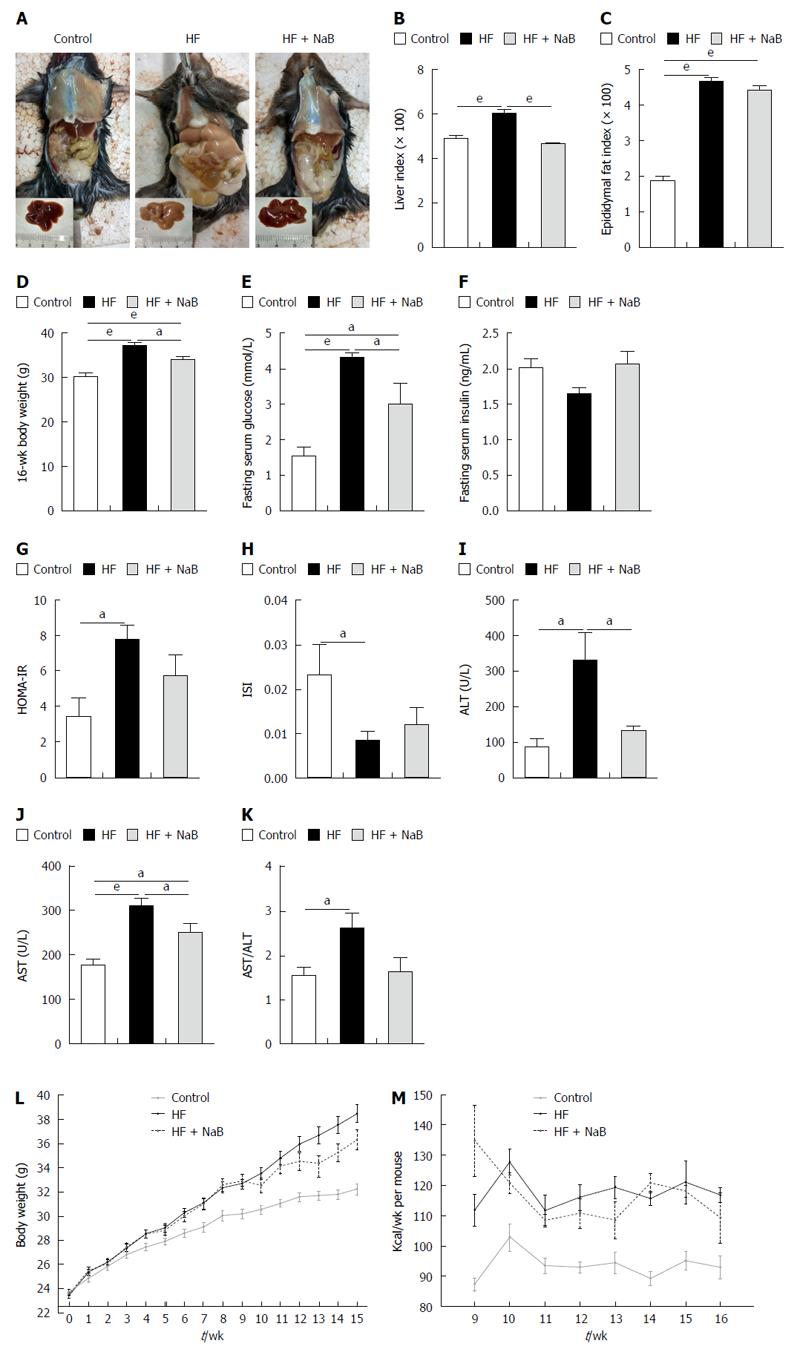
Figure 1 Sodium butyrate attenuates high-fat diet-induced obesity, liver injury and metabolic disturbance.
A: Gross appearances of mice in the control, HF and HF + NaB groups; B: Liver index = liver weight/body weight × 100; C: Epididymal fat index = epididymal fat weight/body weight × 100; D: Body weight at 16 wk; E-H: Fasting serum glucose, fasting serum insulin, HOMA-IR and ISI of the three groups; I-K: Liver aminotransferases represent liver function; L: Body weight changes; M: Energy intake per mouse per week. Data represent means ± SEM. (n = 12 mice per group), aP < 0.05, bP < 0.01 and eP < 0.001.
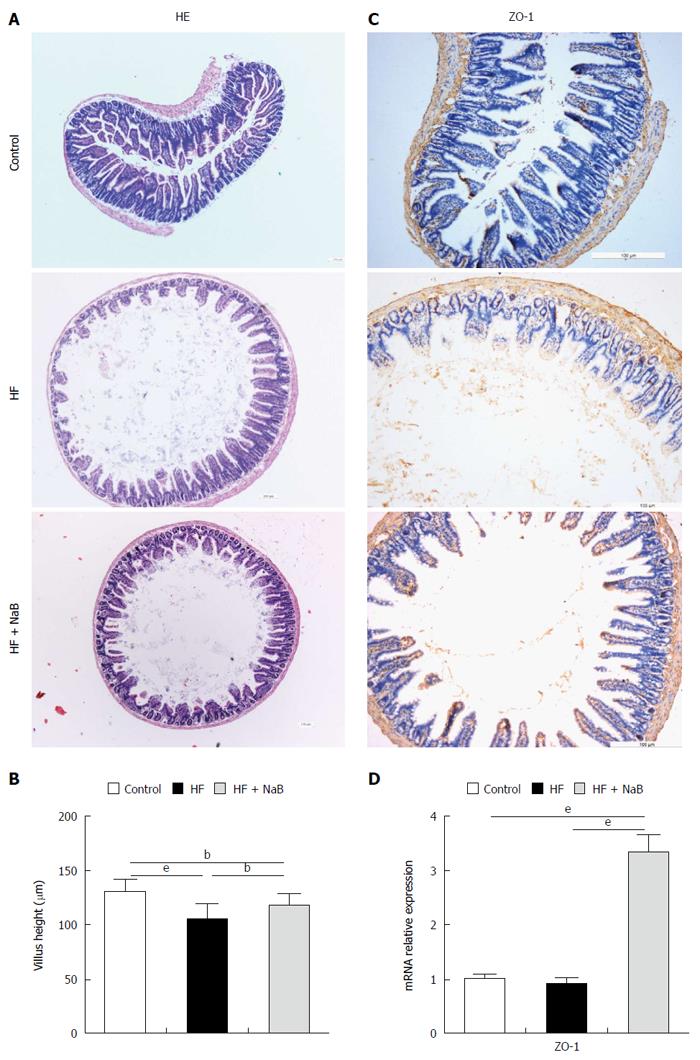
Figure 2 Beneficial effects of sodium butyrate on the small intestine.
A: HE staining of the small intestine showing that NaB ameliorated HFD-induced mucosal damage; B: Morphometric analysis of villus; C: Immunohistochemistry for ZO-1 showing that NaB increased ZO-1 expression, indicating improvement of the tight junctions of the small intestine; D: ZO-1 mRNA expression in the small intestine. Data represent means ± SEM (n = 12 mice per group), aP < 0.05, bP < 0.01 and eP < 0.001.
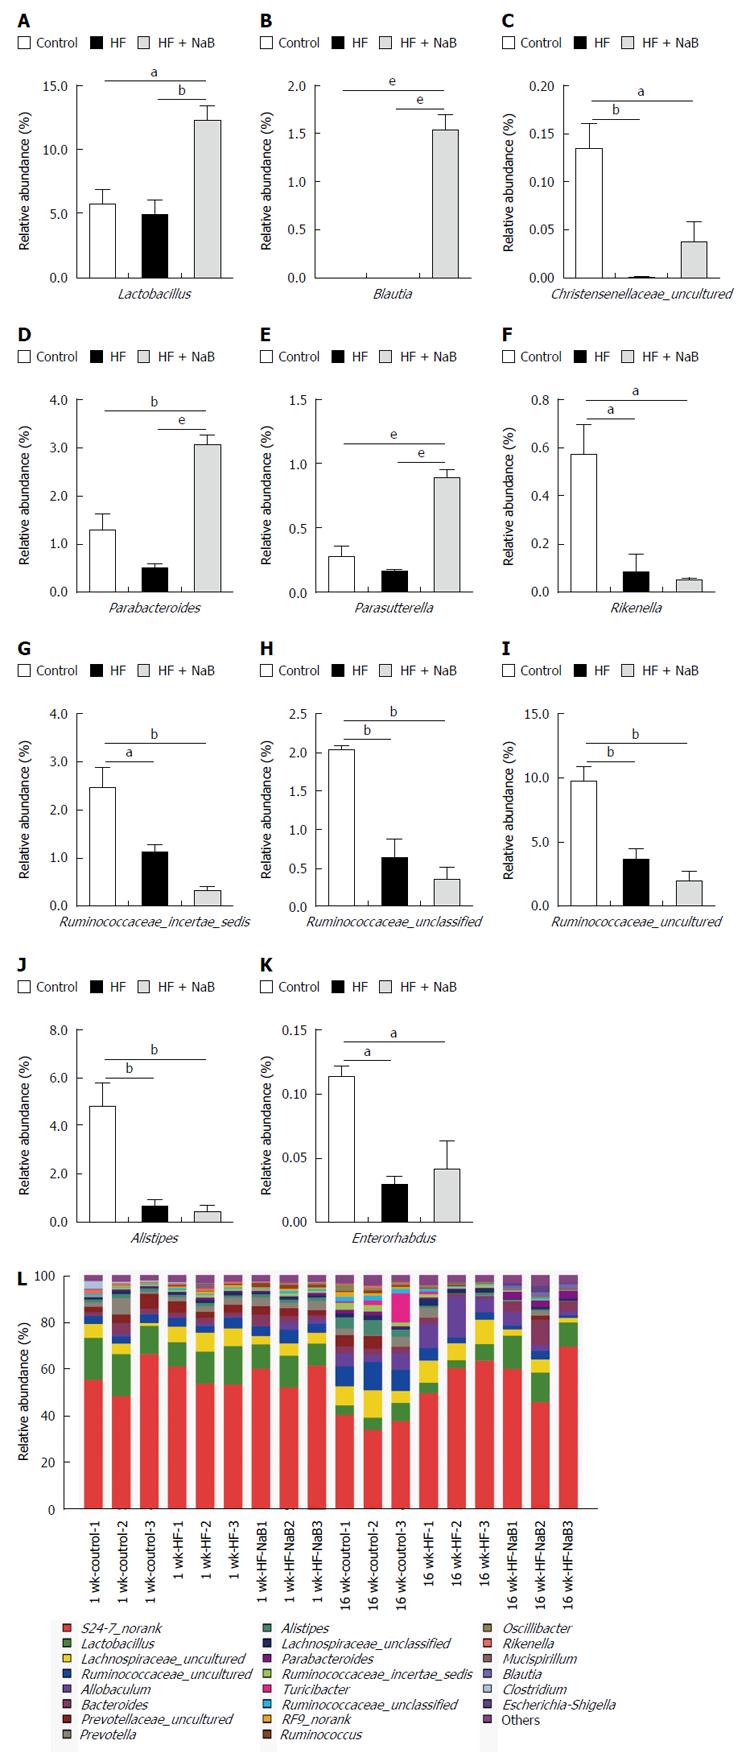
Figure 3 Influences of sodium butyrate on gut microbiota at the genus level.
A-K: Alistipes, Christensenellaceae_uncultured, Enterorhabdus, Lactobacillus, Parabacteroides, Parasutterella, Rikenella, Ruminococcaceae_incertae_sedis, Ruminococcaceae_unclassified, and Ruminococcaceae_uncultured in the HF group were lower than the control. NaB intervention reversed the changes in Christensenellaceae_uncultured, Parabacteroides, Parasutterella and Lactobacillus. NaB treatment significantly increased Blautia; L: Relative read abundance of different bacterial genera within the different communities. Sequences that could not be classified into any known group were assigned as “norank”. Data represent means ± SEM. aP < 0.05, bP < 0.01 and eP < 0.001.
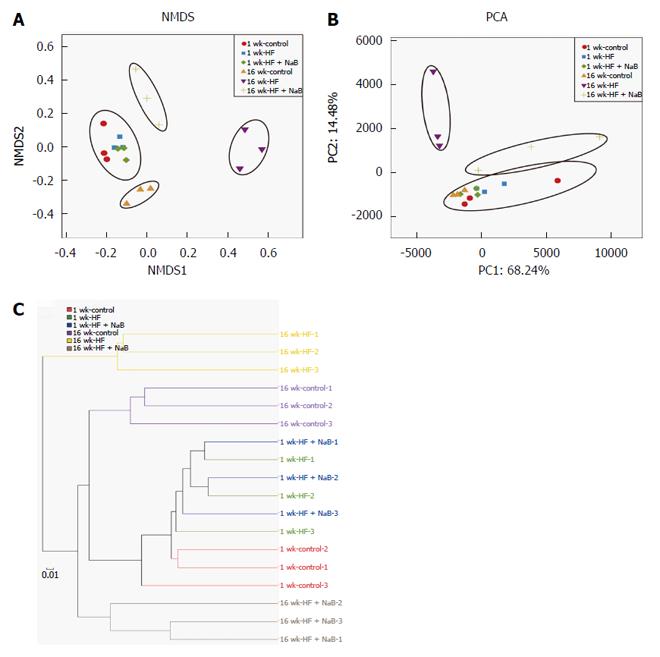
Figure 4 Effects of sodium butyrate on the overall structure of the gut microbiota.
A: Nonmetric multidimensional scaling (NMDS) showing the difference in bacterial communities according to the Bray-Curtis distance; B: Scatter plot of the principal component analysis (PCA) score showing the similarity of the 18 bacterial communities based on the Unifrac distance. Principal components (PCs) 1 and 2 explained 68.24% and 14.48% of the variance, respectively; C: Hierarchical cluster analysis showing that the 1 wk groups and 16 wk-control communities grouped together, and then clustered in order with the 16 wk-HF + NaB groups, finally clustering with the 16 wk-HF groups.
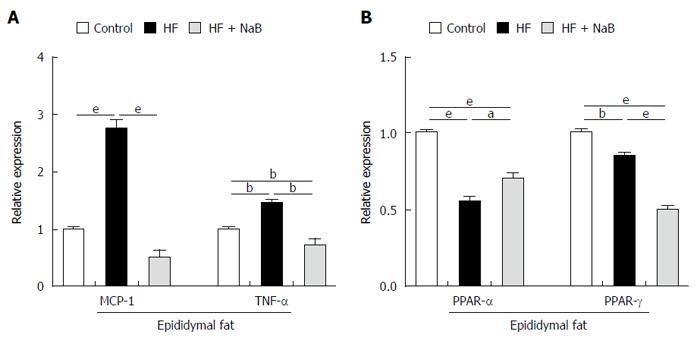
Figure 5 Sodium butyrate improves inflammation and lipid metabolism in epididymal fat.
A: Gene expression levels of MCP-1 and TNF-α in epididymal fat; B: Gene expression levels of PPAR-α and PPAR-γ in epididymal fat. Data represent means ± SEM (n = 12 mice per group), aP < 0.05, bP < 0.01 and eP < 0.001.
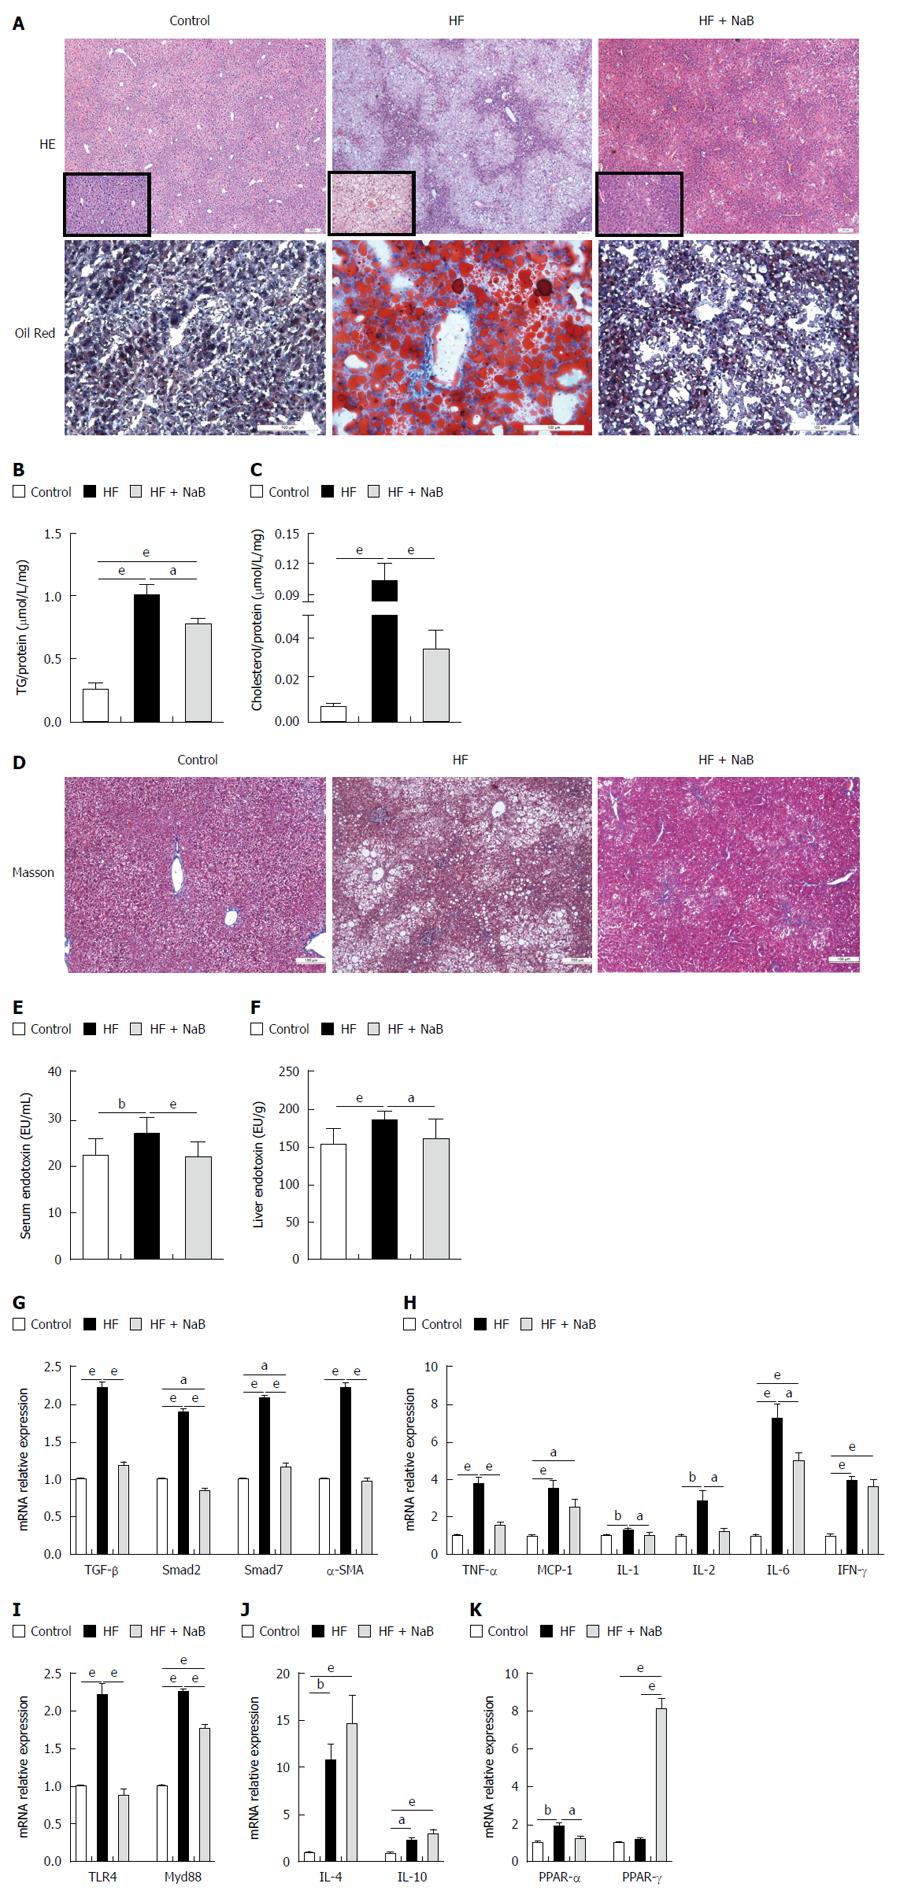
Figure 6 Sodium butyrate improves inflammation and lipid metabolism in liver.
A: HE and oil red O staining; B: TG concentration; C: Cholesterol concentration; D: Masson staining; E, F: The levels of serum and liver endotoxin; G: Fibrosis-associated gene expression of TGF-β, Smad2, Smad7 and α-SMA; H: Pro-inflammation-associated gene expression; I: Endotoxin-associated gene expressions; J: Anti-inflammation-associated gene expression; K: Lipid metabolism-associated PPAR-α and PPAR-γ gene expression. Gene expression levels are expressed as values relative to the control group. Data represent means ± SEM (n = 12 mice per group), aP < 0.05, bP < 0.01 and eP < 0.001.
- Citation: Zhou D, Pan Q, Xin FZ, Zhang RN, He CX, Chen GY, Liu C, Chen YW, Fan JG. Sodium butyrate attenuates high-fat diet-induced steatohepatitis in mice by improving gut microbiota and gastrointestinal barrier. World J Gastroenterol 2017; 23(1): 60-75
- URL: https://www.wjgnet.com/1007-9327/full/v23/i1/60.htm
- DOI: https://dx.doi.org/10.3748/wjg.v23.i1.60


