Copyright
©The Author(s) 2017.
World J Gastroenterol. Jan 7, 2017; 23(1): 60-75
Published online Jan 7, 2017. doi: 10.3748/wjg.v23.i1.60
Published online Jan 7, 2017. doi: 10.3748/wjg.v23.i1.60
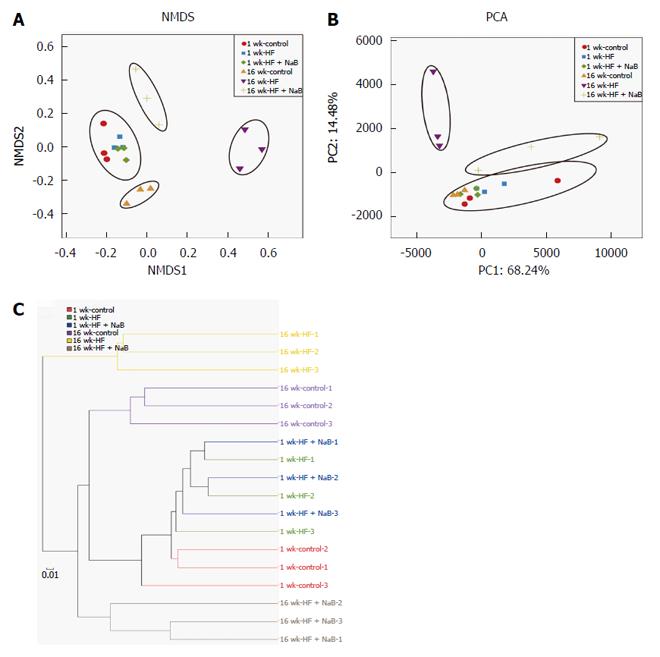
Figure 4 Effects of sodium butyrate on the overall structure of the gut microbiota.
A: Nonmetric multidimensional scaling (NMDS) showing the difference in bacterial communities according to the Bray-Curtis distance; B: Scatter plot of the principal component analysis (PCA) score showing the similarity of the 18 bacterial communities based on the Unifrac distance. Principal components (PCs) 1 and 2 explained 68.24% and 14.48% of the variance, respectively; C: Hierarchical cluster analysis showing that the 1 wk groups and 16 wk-control communities grouped together, and then clustered in order with the 16 wk-HF + NaB groups, finally clustering with the 16 wk-HF groups.
- Citation: Zhou D, Pan Q, Xin FZ, Zhang RN, He CX, Chen GY, Liu C, Chen YW, Fan JG. Sodium butyrate attenuates high-fat diet-induced steatohepatitis in mice by improving gut microbiota and gastrointestinal barrier. World J Gastroenterol 2017; 23(1): 60-75
- URL: https://www.wjgnet.com/1007-9327/full/v23/i1/60.htm
- DOI: https://dx.doi.org/10.3748/wjg.v23.i1.60


