Copyright
©The Author(s) 2017.
World J Gastroenterol. Jan 7, 2017; 23(1): 60-75
Published online Jan 7, 2017. doi: 10.3748/wjg.v23.i1.60
Published online Jan 7, 2017. doi: 10.3748/wjg.v23.i1.60
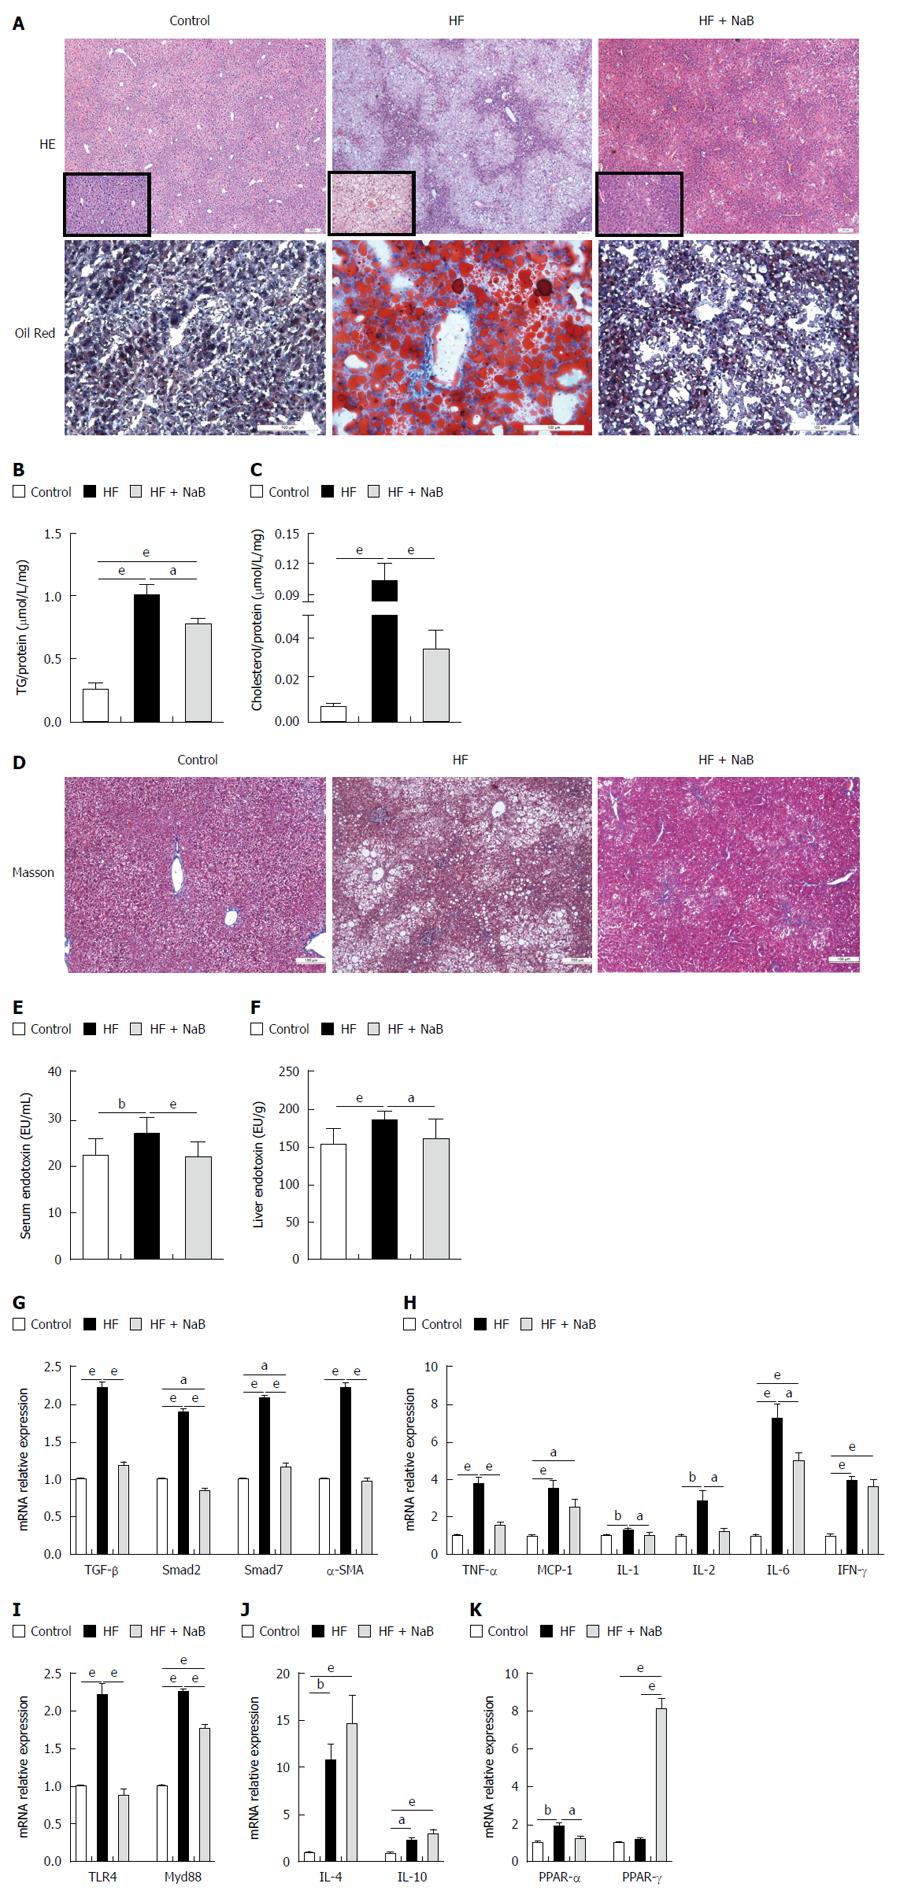
Figure 6 Sodium butyrate improves inflammation and lipid metabolism in liver.
A: HE and oil red O staining; B: TG concentration; C: Cholesterol concentration; D: Masson staining; E, F: The levels of serum and liver endotoxin; G: Fibrosis-associated gene expression of TGF-β, Smad2, Smad7 and α-SMA; H: Pro-inflammation-associated gene expression; I: Endotoxin-associated gene expressions; J: Anti-inflammation-associated gene expression; K: Lipid metabolism-associated PPAR-α and PPAR-γ gene expression. Gene expression levels are expressed as values relative to the control group. Data represent means ± SEM (n = 12 mice per group), aP < 0.05, bP < 0.01 and eP < 0.001.
- Citation: Zhou D, Pan Q, Xin FZ, Zhang RN, He CX, Chen GY, Liu C, Chen YW, Fan JG. Sodium butyrate attenuates high-fat diet-induced steatohepatitis in mice by improving gut microbiota and gastrointestinal barrier. World J Gastroenterol 2017; 23(1): 60-75
- URL: https://www.wjgnet.com/1007-9327/full/v23/i1/60.htm
- DOI: https://dx.doi.org/10.3748/wjg.v23.i1.60


