Copyright
©The Author(s) 2016.
World J Gastroenterol. May 7, 2016; 22(17): 4345-4353
Published online May 7, 2016. doi: 10.3748/wjg.v22.i17.4345
Published online May 7, 2016. doi: 10.3748/wjg.v22.i17.4345
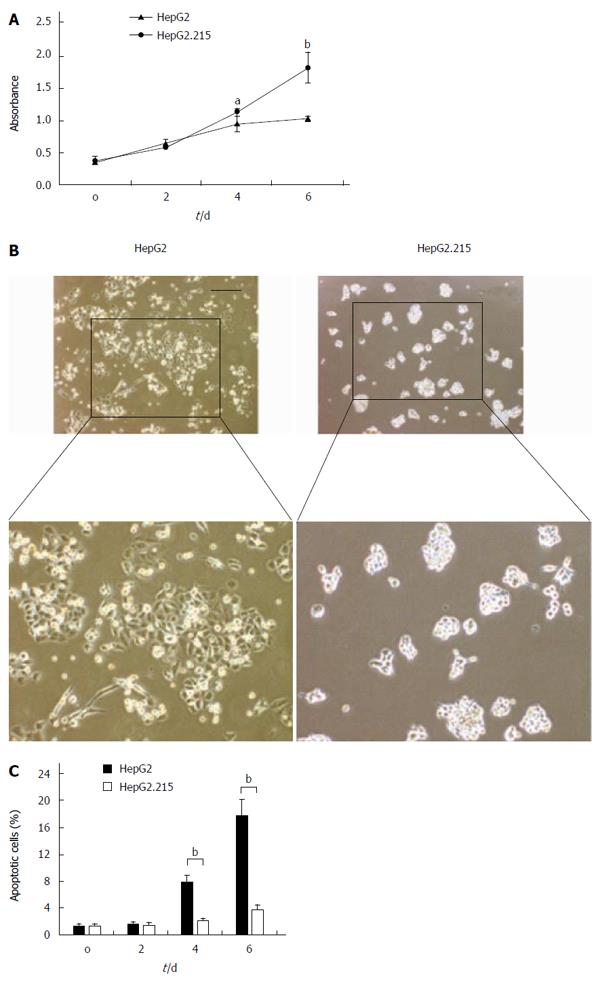
Figure 1 Resistance of HepG2.
215 cells to apoptosis. A: Typical photographs of HepG2 and HepG2.215 cells cultured for 6 d after serum depletion. The data are representative of three independent experiments; B: MTT assay for the viability of cells cultured for 2, 4 and 6 d after serum depletion. Data represent absorbance at 570 nm and are shown as mean ± SD of quadruplicates. aP < 0.05 and bP < 0.01 vs HepG2 cells group. The data are representative of three independent experiments; C: In parallel experiments, samples were subjected to FITC-Annexin V/propidium iodide staining and the quantitative analysis of apoptotic cells was performed using flow cytometry. Quantification of apoptotic cells is shown as mean ± SD of triplicates.
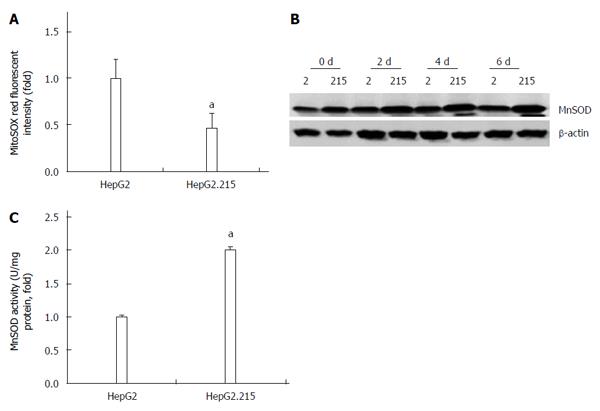
Figure 2 Decreased mitochondrial superoxide production is accompanied by increased MnSOD expression and activity in HepG2.
215 cells. A: Mitochondrial superoxide level was decreased in HepG2.215 cells. Cells were cultured in serum-free medium for 6 d. Mitochondrial superoxide anion formation was measured by flow cytometry and MitoSOX. Quantification of mitochondrial superoxide anion is shown as mean ± SD of triplicates. aP < 0.05 vs HepG2 cell group; B: Cell lysates were subjected to Western blot analysis. The protein level of MnSOD was detected; C: MnSOD activity was measured with a commercial SOD Assay Kit. Quantification of MnSOD activity is shown as mean ± SD of triplicates. aP < 0.05 vs HepG2 cells group.
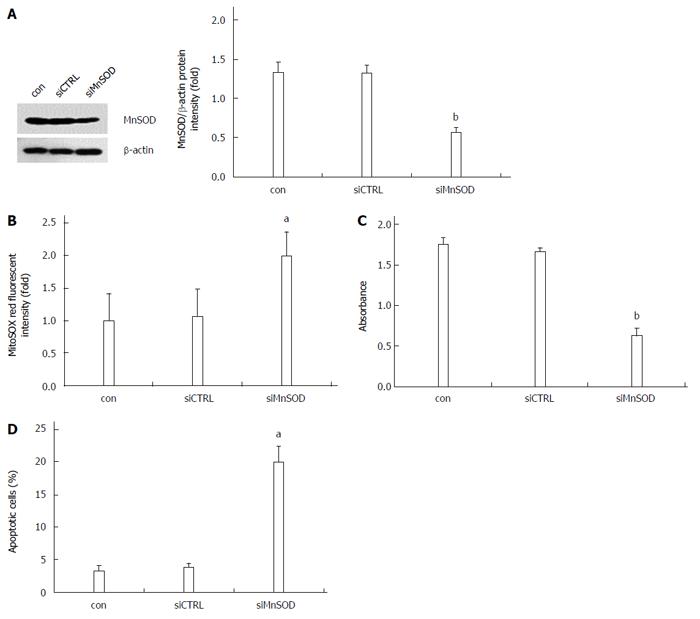
Figure 3 MnSOD contributes to decreased mitochondrial superoxide and apoptotic cells in HepG2.
215 cells. A: After 6 d, the interference effect of MnSOD siRNA (siMnSOD) was analyzed by Western blot analysis. MnSOD siRNA (siMnSOD) or non-specific siRNA (siCTRL) was transfected into HepG2.215 cells for 12 h before serum depletion; B: After 6 d, cells were harvested for quantification of mitochondrial superoxide anion formation by flow cytometry. In parallel, (C) cell viability and (D) apoptotic cells were separately determined by MTT assay and flow cytometry. aP < 0.05 and bP < 0.01 vs siCTRL group.
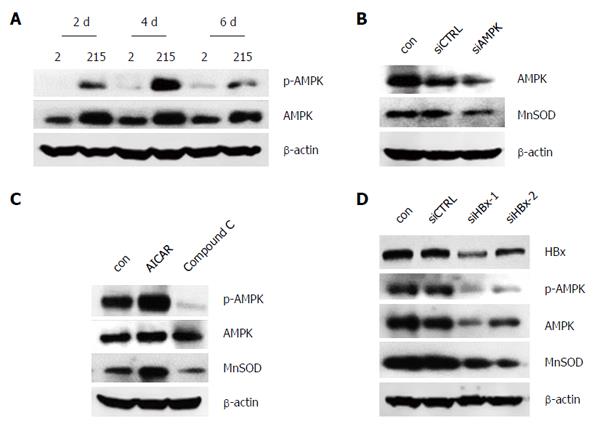
Figure 4 AMPK activation is required for MnSOD expression in HepG2.
215 cells. A: Cell lysates were subjected to Western blot analysis. The protein levels of AMPK and p-AMPK were detected; B: Cells were transfected with AMPK siRNAs (siAMPK) or a nonspecific control siRNA (siCTRL) for 6 d. The protein levels of AMPK and MnSOD were detected by Western blot analysis; C: Cells were subjected to 1 mM AMPK activator AICAR or inhibitor compound C for 6 d. The protein levels of AMPK, p-AMPK and MnSOD were detected by Western blot analysis; D: Cells were transfected with HBx siRNAs (siHBx) or a nonspecific control siRNA (siCTRL) for 6 d. The protein levels of AMPK and MnSOD were detected by Western blot analysis.
- Citation: Li L, Hong HH, Chen SP, Ma CQ, Liu HY, Yao YC. Activation of AMPK/MnSOD signaling mediates anti-apoptotic effect of hepatitis B virus in hepatoma cells. World J Gastroenterol 2016; 22(17): 4345-4353
- URL: https://www.wjgnet.com/1007-9327/full/v22/i17/4345.htm
- DOI: https://dx.doi.org/10.3748/wjg.v22.i17.4345


