Copyright
©The Author(s) 2016.
World J Gastroenterol. May 7, 2016; 22(17): 4345-4353
Published online May 7, 2016. doi: 10.3748/wjg.v22.i17.4345
Published online May 7, 2016. doi: 10.3748/wjg.v22.i17.4345
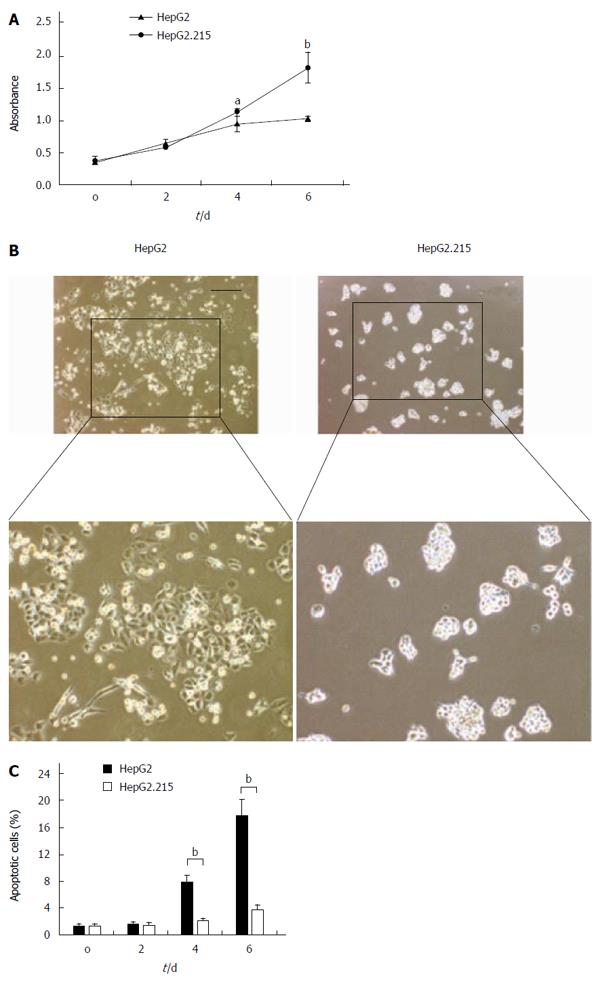
Figure 1 Resistance of HepG2.
215 cells to apoptosis. A: Typical photographs of HepG2 and HepG2.215 cells cultured for 6 d after serum depletion. The data are representative of three independent experiments; B: MTT assay for the viability of cells cultured for 2, 4 and 6 d after serum depletion. Data represent absorbance at 570 nm and are shown as mean ± SD of quadruplicates. aP < 0.05 and bP < 0.01 vs HepG2 cells group. The data are representative of three independent experiments; C: In parallel experiments, samples were subjected to FITC-Annexin V/propidium iodide staining and the quantitative analysis of apoptotic cells was performed using flow cytometry. Quantification of apoptotic cells is shown as mean ± SD of triplicates.
- Citation: Li L, Hong HH, Chen SP, Ma CQ, Liu HY, Yao YC. Activation of AMPK/MnSOD signaling mediates anti-apoptotic effect of hepatitis B virus in hepatoma cells. World J Gastroenterol 2016; 22(17): 4345-4353
- URL: https://www.wjgnet.com/1007-9327/full/v22/i17/4345.htm
- DOI: https://dx.doi.org/10.3748/wjg.v22.i17.4345


