Copyright
©The Author(s) 2016.
World J Gastroenterol. Apr 28, 2016; 22(16): 4136-4148
Published online Apr 28, 2016. doi: 10.3748/wjg.v22.i16.4136
Published online Apr 28, 2016. doi: 10.3748/wjg.v22.i16.4136
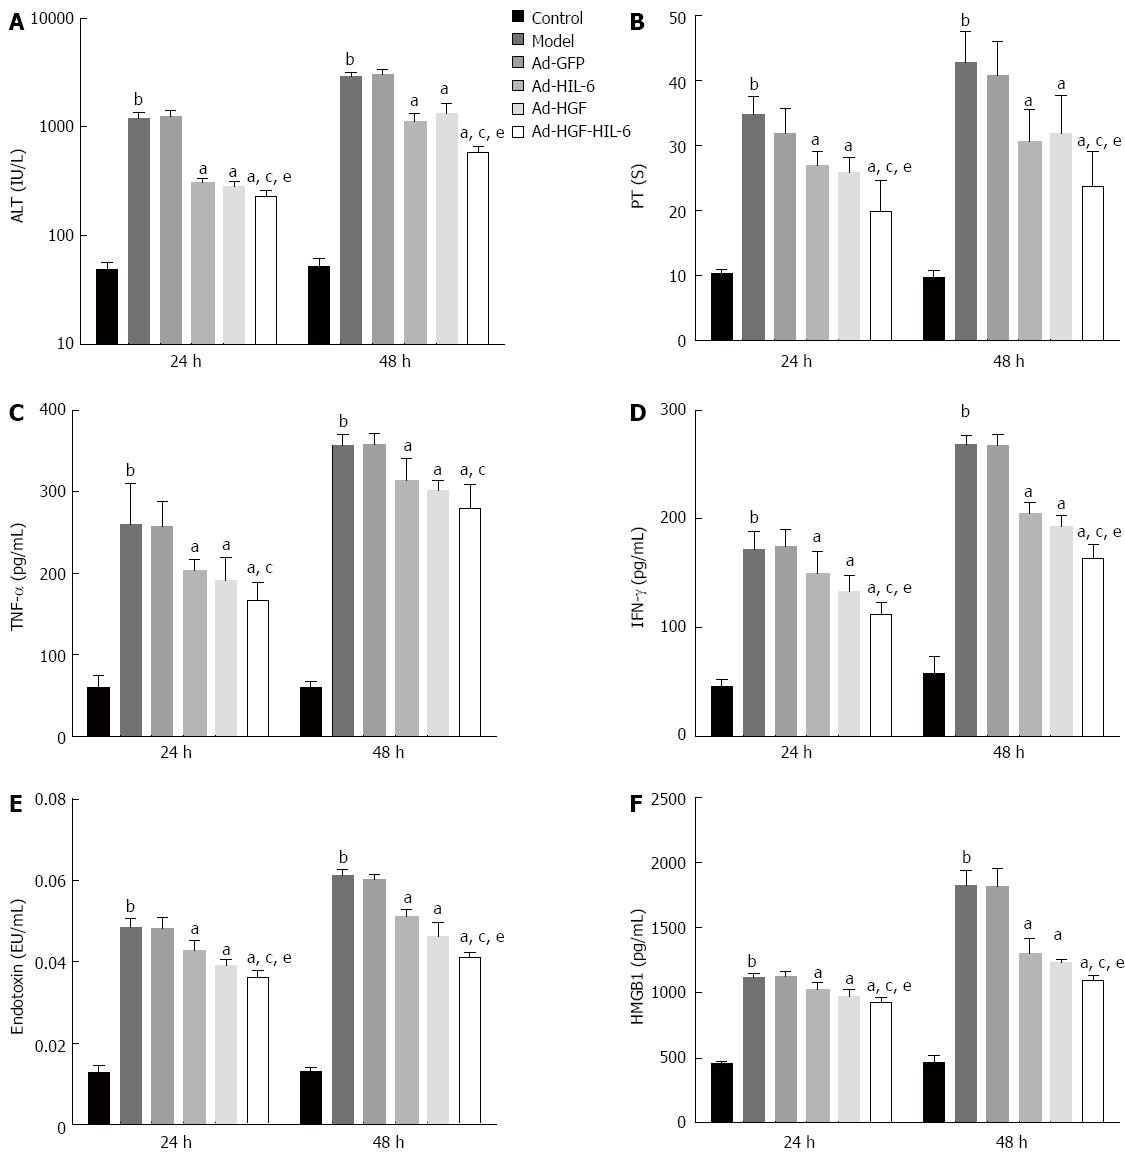
Figure 1 Effect of pDC315-3FLAG-sv40-HGF-IRES-Hyper-IL-6-EGFP on the hepatic enzyme, prothrombin time, inflammatory cytokines, serum endotoxin and high mobility group box-1 in a rat acute-on-chronic liver failure model compared to those of pDC315-3FLAG-sv40-HGF-EGFP or pDC315-3FLAG-sv40-Hyper-IL-6-EGFP.
A: Alanine transaminase (ALT); B: Prothrombin time (PT); C: Tumour necrosis factor-α (TNF-α); D: Interferon-γ (IFN-γ); E: Endotoxin; F: High mobility group box-1 (HMGB1). aP < 0.05 vs Ad-GFP treated, bP < 0.01 vs control, cP < 0.05 vs Ad-HIL-6 treated, eP < 0.05 vs Ad-HGF treated. The results are expressed as the mean ± SD, n = 6. Control: Normal liver; model: ACLF liver; Ad-GFP: pDC315-3FLAG-sv40-EGFP; Ad-HIL-6: pDC315-3FLAG-sv40-Hyper-IL-6-EGFP; Ad-HGF: pDC315-3FLAG-sv40-HGF-EGFP; Ad-HGF-HIL-6: pDC315-3FLAG-sv40-HGF-IRES-Hyper-IL-6-EGFP.
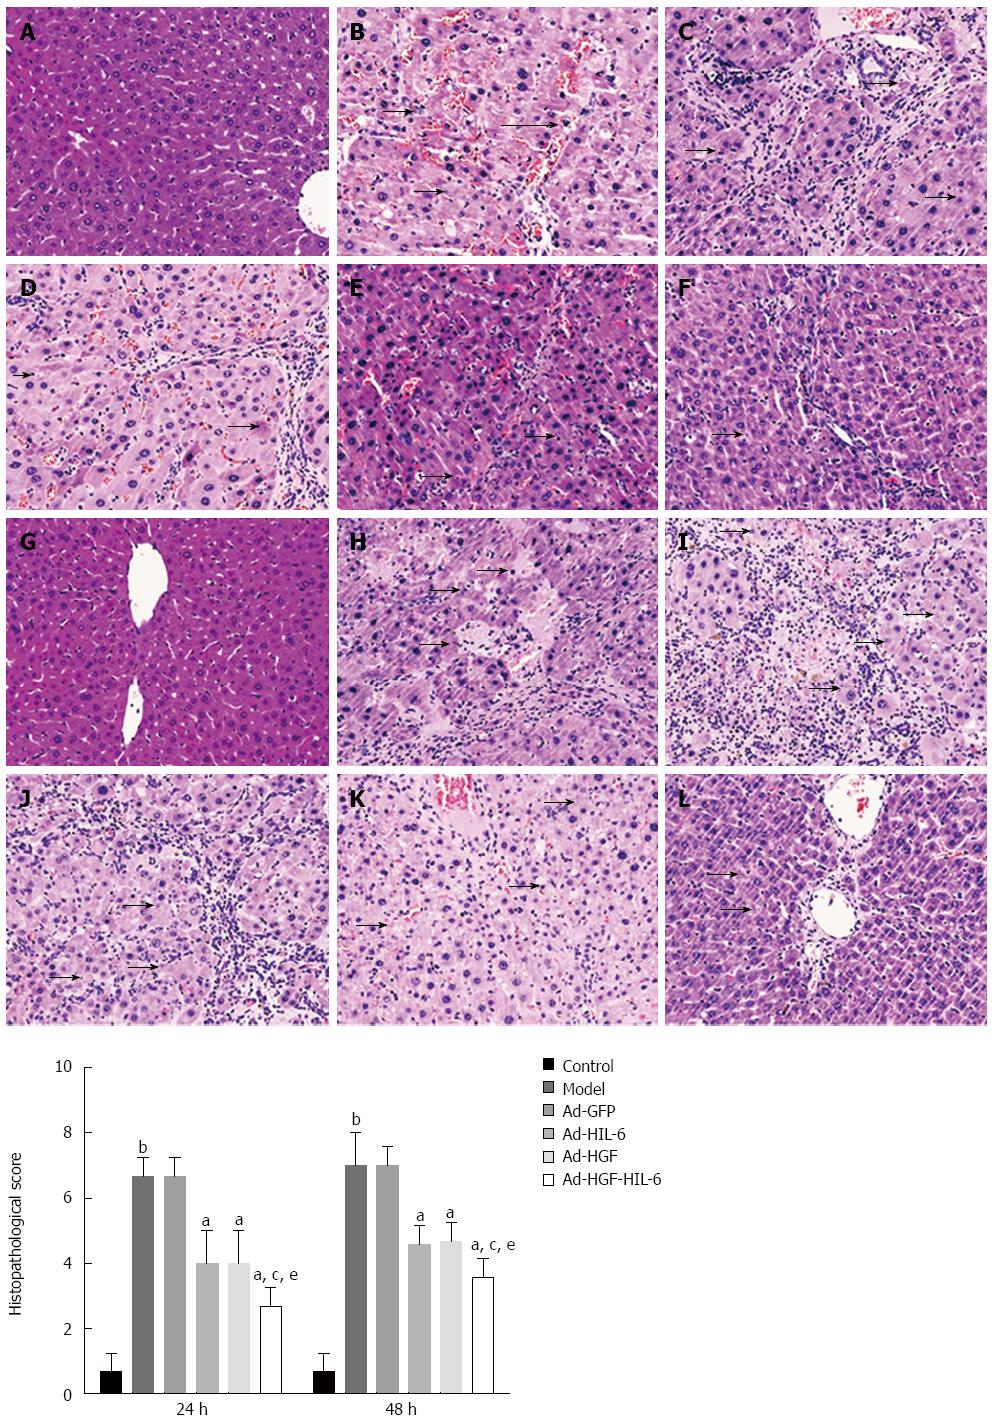
Figure 2 Effect of pDC315-3FLAG-sv40-HGF-IRES-Hyper-IL-6-EGFP on liver histology (HE staining, original magnification × 100) compared to those of pDC315-3FLAG-sv40-HGF-EGFP or pDC315-3FLAG-sv40-Hyper-IL-6-EGFP and comparison of histopathological scores for all types of treated liver.
Arrow indicates an apoptotic or necrotic cell. aP < 0.05 vs Ad-GFP treated, bP < 0.01 vs control, cP < 0.05 vs Ad-HIL-6 treated, and eP < 0.05 vs Ad-HGF treated. The results are expressed as the mean ± SEM, n = 8. Control: Normal liver; Model: ACLF liver; Ad-GFP: pDC315-3FLAG-sv40-EGFP; Ad-HIL-6: pDC315-3FLAG-sv40-Hyper-IL-6-EGFP; Ad-HGF: pDC315-3FLAG-sv40-HGF-EGFP; Ad-HGF-HIL-6: pDC315-3FLAG-sv40-HGF-IRES-Hyper-IL-6-EGFP; A: Control at 24 h; B: Model at 24 h; C: Ad-GFP at 24 h; D: Ad-HIL-6 at 24 h; E: Ad-HGF at 24 h; F: Ad-HGF-HIL-6 at 24 h; G: Control at 48 h; H: Model at 48 h; I: Ad-GFP at 48 h; J: Ad-HIL-6 at 48 h; K: Ad-HGF at 48 h; L: Ad-HGF-HIL-6 at 48 h.
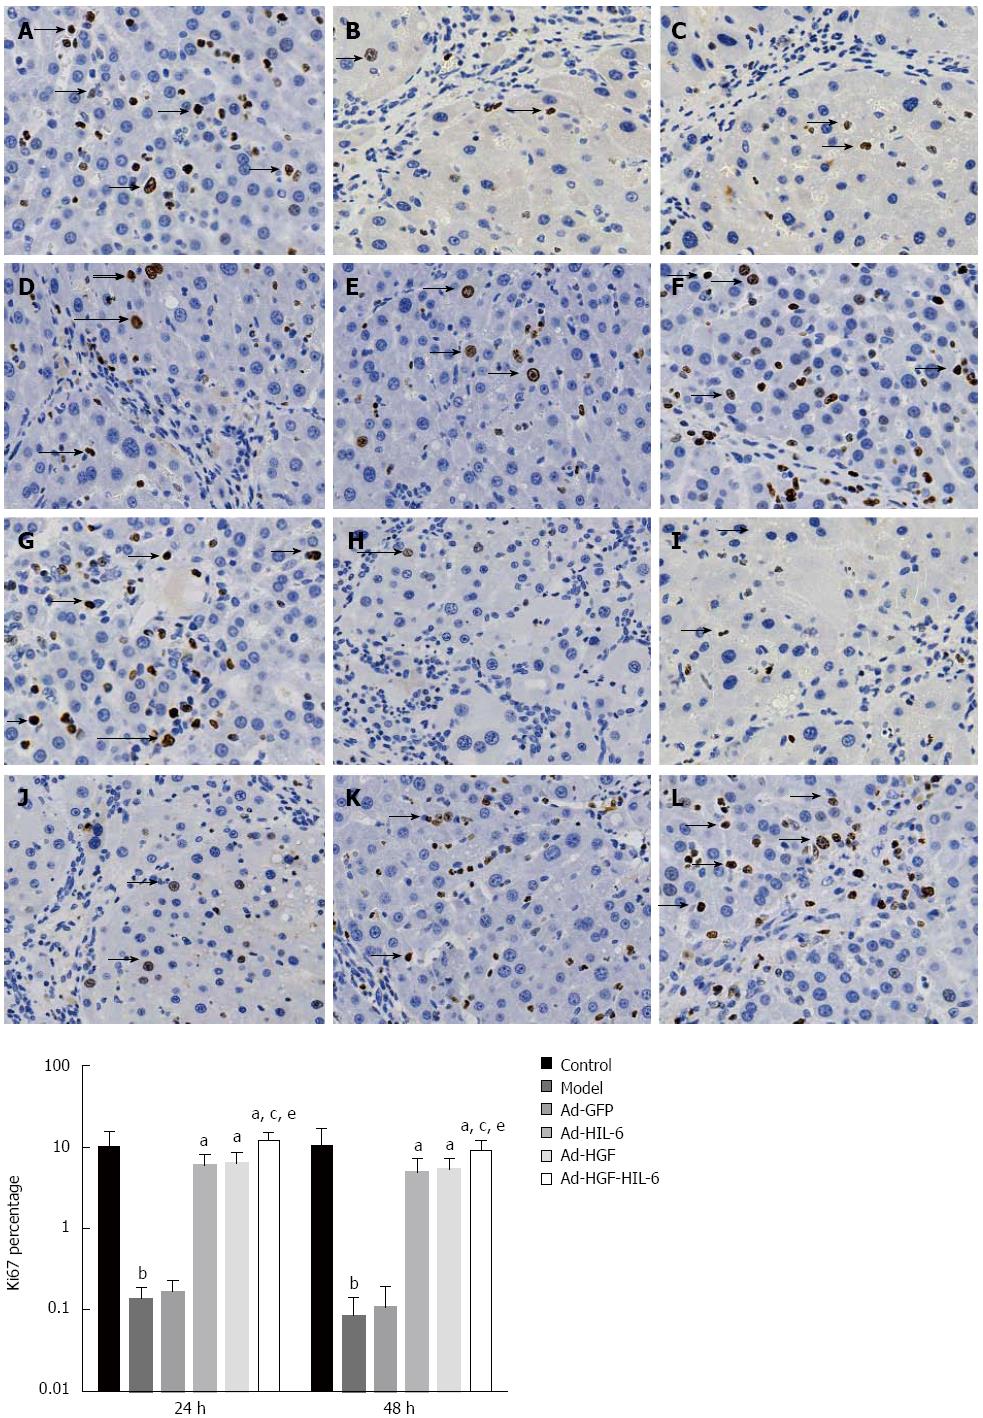
Figure 3 Effect of pDC315-3FLAG-sv40-HGF-IRES-Hyper-IL-6-EGFP on Ki67 proliferation index (immunohistochemistry, original magnification × 200) compared to those of pDC315-3FLAG-sv40-HGF-EGFP or pDC315-3FLAG-sv40-Hyper-IL-6-EGFP and quantification for Ki67+ hepatocytes versus total counted cells for all types of treated liver.
aP < 0.05 vs Ad-GFP treated, bP < 0.01 vs control, cP < 0.05 vs Ad-HIL-6 treated, eP < 0.05 vs Ad-HGF treated. The results are expressed as the mean ± SEM, n = 8. Arrow is a Ki67+ cell. Control: Normal liver; model: ACLF liver; Ad-GFP: pDC315-3FLAG-sv40-EGFP; Ad-HIL-6: pDC315-3FLAG-sv40-Hyper-IL-6-EGFP; Ad-HGF: pDC315-3FLAG-sv40-HGF-EGFP; and Ad-HGF-HIL-6: pDC315-3FLAG-sv40-HGF-IRES-Hyper-IL-6-EGFP; A: Control at 24 h; B: Model at 24 h; C: Ad-GFP at 24 h; D: Ad-HIL-6 at 24 h; E: Ad-HGF at 24 h; F: Ad-HGF-HIL-6 at 24 h; G: Control at 48 h; H: Model at 48 h; I: Ad-GFP at 48 h; J: Ad-HIL-6 at 48 h; K: Ad-HGF at 48 h; L:Ad-HGF-HIL-6 at 48 h.
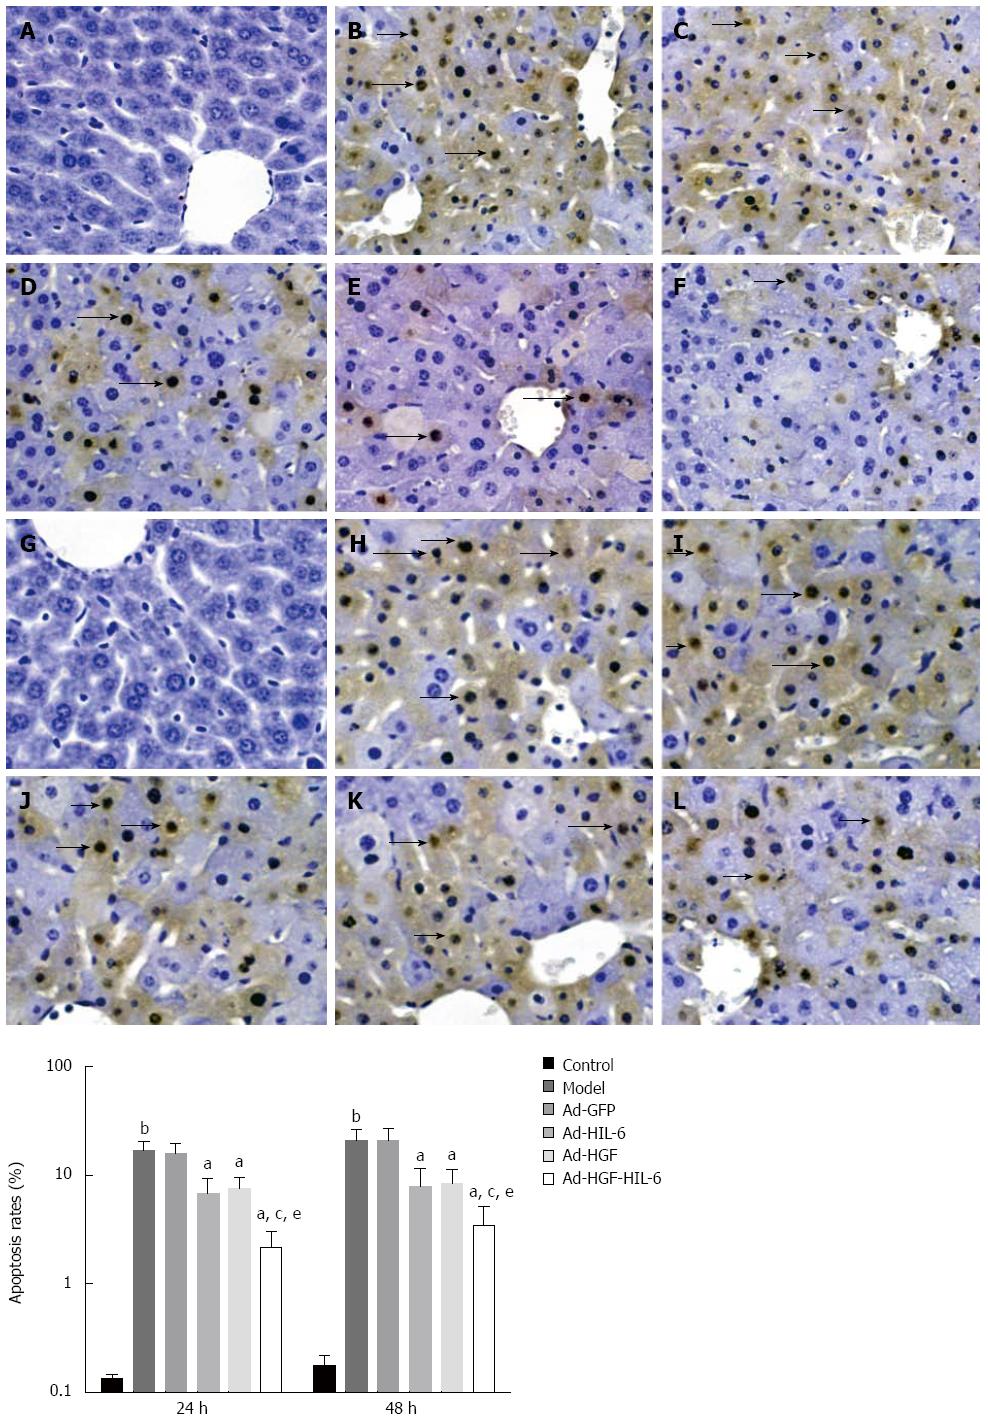
Figure 4 Effect of pDC315-3FLAG-sv40-HGF-IRES-Hyper-IL-6-EGFP on apoptotic index by TUNEL assays (Images are represented at × 400 magnification) compared to those of pDC315-3FLAG-sv40-HGF-EGFP or pDC315-3FLAG-sv40-Hyper-IL-6-EGFP and comparison of the apoptosis rates (%) for all types of treated liver.
Arrow indicates an apoptotic cell. aP < 0.05 vs Ad-GFP treated, bP < 0.01 vs control, cP < 0.05 vs Ad-HIL-6 treated, and eP < 0.05 vs Ad-HGF treated. The results are expressed as the mean ± SEM, n = 8. Control: Normal liver; model: ACLF liver; Ad-GFP: pDC315-3FLAG-sv40-EGFP; Ad-HIL-6: pDC315-3FLAG-sv40-Hyper-IL-6-EGFP; Ad-HGF: pDC315-3FLAG-sv40-HGF-EGFP; Ad-HGF-HIL-6: pDC315-3FLAG-sv40-HGF-IRES-Hyper-IL-6-EGFP; A: Control at 24 h; B: Model at 24 h; C: Ad-GFP at 24 h; D: Ad-HIL-6 at 24 h; E: Ad-HGF at 24 h; F: Ad-HGF-HIL-6 at 24 h; G: Control at 48 h; H: Model at 48 h; I: Ad-GFP at 48 h; J: Ad-HIL-6 at 48 h; K: Ad-HGF at 48 h; L:Ad-HGF-HIL-6 at 48 h.
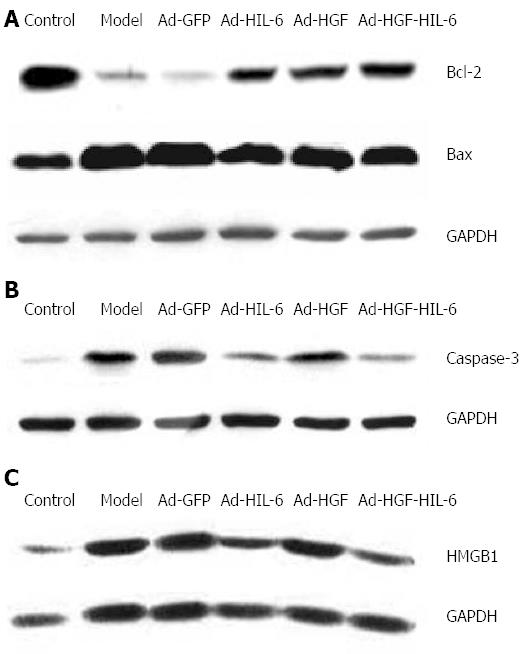
Figure 5 Western blot assays showing the protein expression of Bcl-2, Bax, Caspase-3 and HMGB1 for all types of treated liver.
n = 6. A: Bcl-2, Bax; B: Caspase-3; C: HMGB1. Control: Normal liver; Model: ACLF liver; Ad-GFP: pDC315-3FLAG-sv40-EGFP; Ad-HIL-6: pDC315-3FLAG-sv40-Hyper-IL-6-EGFP; Ad-HGF: pDC315-3FLAG-sv40-HGF-EGFP; Ad-HGF-HIL-6: pDC315-3FLAG-sv40-HGF-IRES-Hyper-IL-6-EGFP. ACLF: Acute-on-chronic liver failure.
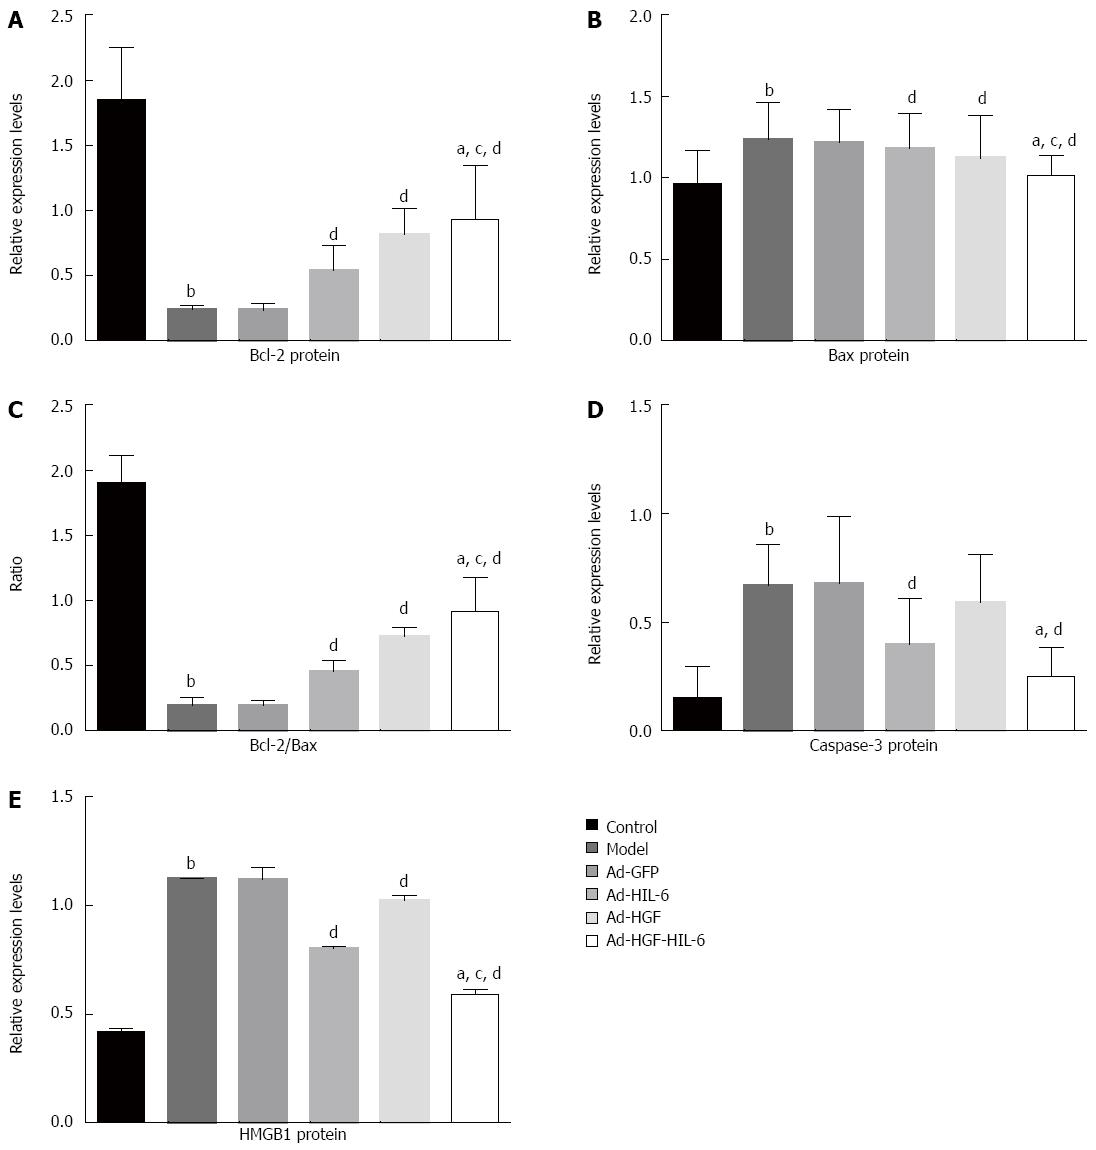
Figure 6 Protein levels of Bcl-2, Bax, Caspase-3 and HMGB1 detected by Western blot, revealing the relative protein expression of Bcl-2, Bax, Caspase-3 and HMGB1, and the ratio of Bcl-2/Bax of all treated livers.
A: Bcl-2 protein; B: Bax protein; C: the ratio of Bcl-2/Bax; D: Caspase-3 protein; E: HMGB1 protein. A, B, D, E: The Y axis represents the relative protein expression of Bcl-2, Bax Caspase-3 and HMGB1 compared to that of glyceraldehyde-3-phosphate dehydrogenase (GAPDH) for all types of treated liver; C: The Y axis represents the ratio of the relative protein expression of Bcl-2/Bax for all types of treated liver. aP < 0.05 vs Ad-HIL-6 treated, bP < 0.01 vs control, cP < 0.05 vs Ad-HGF treated, dP < 0.01 vs Ad-GFP treated. The results are expressed as the mean ± SD, n = 6. Control: Normal liver; Model: ACLF liver; Ad-GFP: pDC315-3FLAG-sv40-EGFP; Ad-HIL-6: pDC315-3FLAG-sv40-Hyper-IL-6-EGFP; Ad-HGF: pDC315-3FLAG-sv40-HGF-EGFP; Ad-HGF-HIL-6: pDC315-3FLAG-sv40-HGF-IRES-Hyper-IL-6-EGFP.
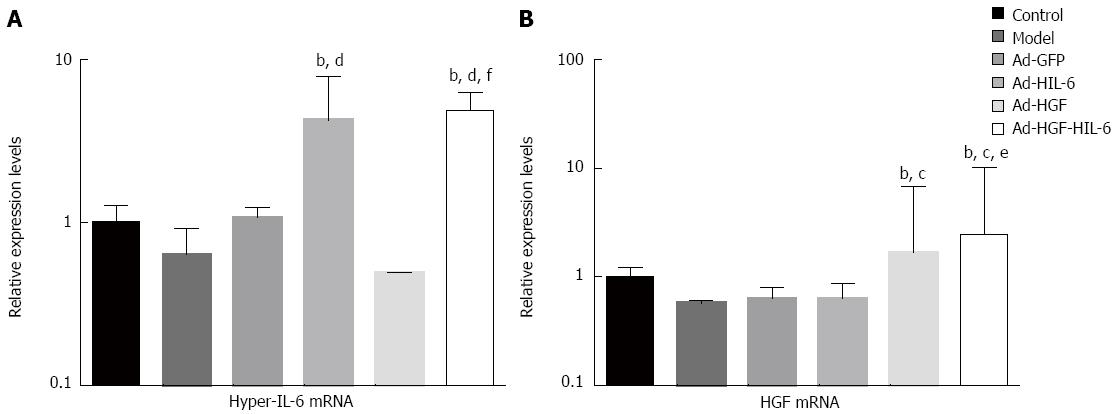
Figure 7 Expression of mRNA levels of hyper-IL-6 or HGF as detected by representative reverse transcription-polymerase chain reaction.
A: Hyper-IL-6 mRNA; B: HGF mRNA. The Y axis represents the relative mRNA expression of Hyper-IL-6 or HGF compared to that of the house-keeping gene β-actin for all types of treated liver. bP < 0.01 vs Ad-GFP treated, cP < 0.01 vs Ad-HIL-6 treated, dP < 0.01 vs Ad-HGF treated, eP > 0.05 vs Ad-HGF treated and fP > 0.05 vs Ad-HIL-6 treated. The results are expressed as the mean ± SD, n = 6. Control: Normal liver; Model: ACLF liver; Ad-GFP: pDC315-3FLAG-sv40-EGFP; Ad-HIL-6: pDC315-3FLAG-sv40-Hyper-IL-6-EGFP; Ad-HGF: pDC315-3FLAG-sv40-HGF-EGFP; and Ad-HGF-HIL-6: pDC315-3FLAG-sv40-HGF-IRES-Hyper-IL-6-EGFP.
- Citation: Gao DD, Fu J, Qin B, Huang WX, Yang C, Jia B. Recombinant adenovirus containing hyper-interleukin-6 and hepatocyte growth factor ameliorates acute-on-chronic liver failure in rats. World J Gastroenterol 2016; 22(16): 4136-4148
- URL: https://www.wjgnet.com/1007-9327/full/v22/i16/4136.htm
- DOI: https://dx.doi.org/10.3748/wjg.v22.i16.4136


