Copyright
©The Author(s) 2016.
World J Gastroenterol. Apr 28, 2016; 22(16): 4136-4148
Published online Apr 28, 2016. doi: 10.3748/wjg.v22.i16.4136
Published online Apr 28, 2016. doi: 10.3748/wjg.v22.i16.4136
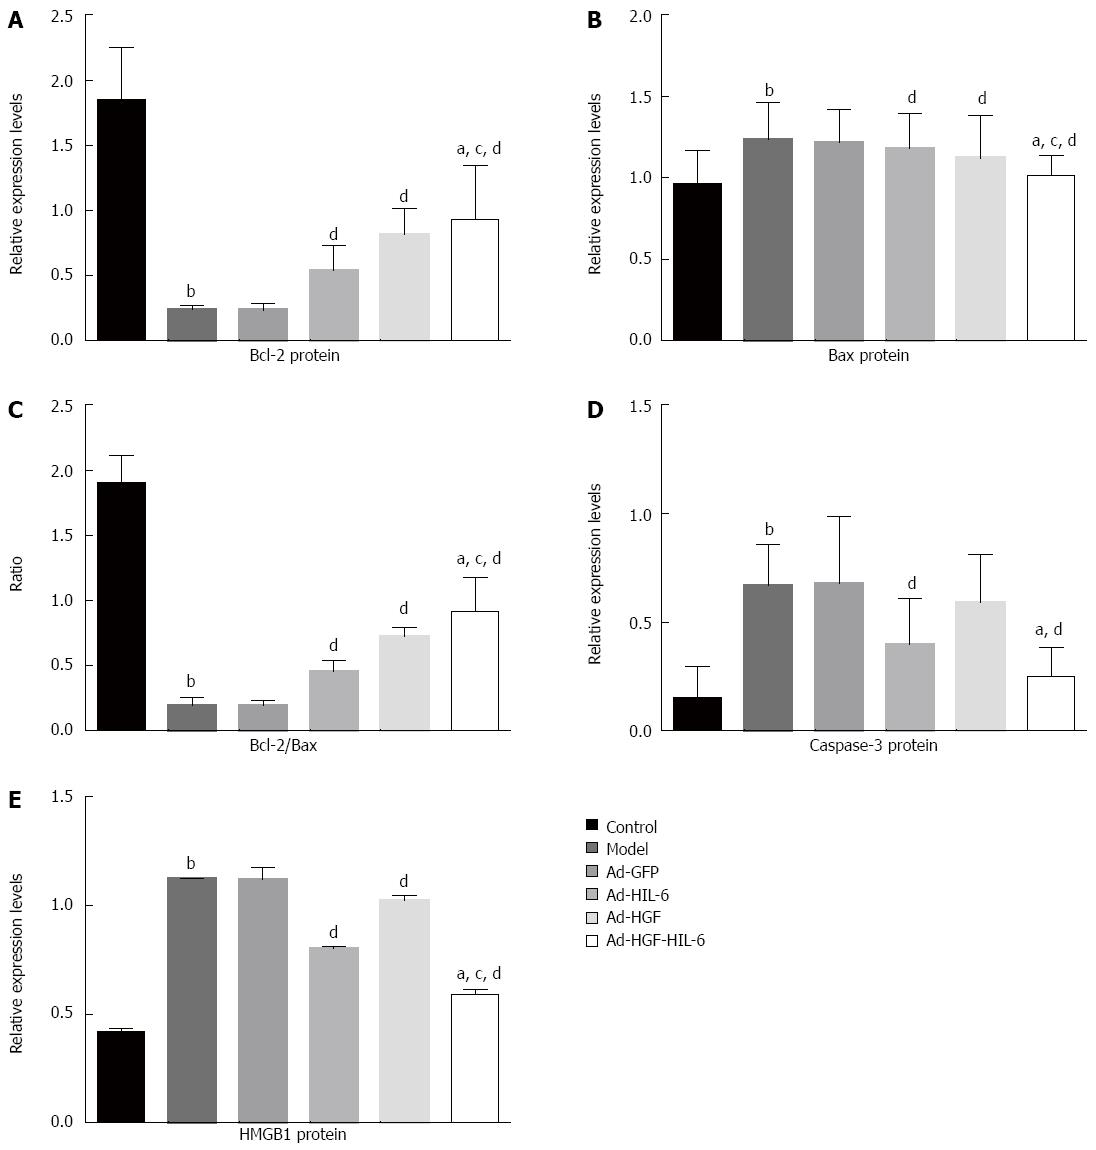
Figure 6 Protein levels of Bcl-2, Bax, Caspase-3 and HMGB1 detected by Western blot, revealing the relative protein expression of Bcl-2, Bax, Caspase-3 and HMGB1, and the ratio of Bcl-2/Bax of all treated livers.
A: Bcl-2 protein; B: Bax protein; C: the ratio of Bcl-2/Bax; D: Caspase-3 protein; E: HMGB1 protein. A, B, D, E: The Y axis represents the relative protein expression of Bcl-2, Bax Caspase-3 and HMGB1 compared to that of glyceraldehyde-3-phosphate dehydrogenase (GAPDH) for all types of treated liver; C: The Y axis represents the ratio of the relative protein expression of Bcl-2/Bax for all types of treated liver. aP < 0.05 vs Ad-HIL-6 treated, bP < 0.01 vs control, cP < 0.05 vs Ad-HGF treated, dP < 0.01 vs Ad-GFP treated. The results are expressed as the mean ± SD, n = 6. Control: Normal liver; Model: ACLF liver; Ad-GFP: pDC315-3FLAG-sv40-EGFP; Ad-HIL-6: pDC315-3FLAG-sv40-Hyper-IL-6-EGFP; Ad-HGF: pDC315-3FLAG-sv40-HGF-EGFP; Ad-HGF-HIL-6: pDC315-3FLAG-sv40-HGF-IRES-Hyper-IL-6-EGFP.
- Citation: Gao DD, Fu J, Qin B, Huang WX, Yang C, Jia B. Recombinant adenovirus containing hyper-interleukin-6 and hepatocyte growth factor ameliorates acute-on-chronic liver failure in rats. World J Gastroenterol 2016; 22(16): 4136-4148
- URL: https://www.wjgnet.com/1007-9327/full/v22/i16/4136.htm
- DOI: https://dx.doi.org/10.3748/wjg.v22.i16.4136


