Copyright
©The Author(s) 2016.
World J Gastroenterol. Apr 28, 2016; 22(16): 4136-4148
Published online Apr 28, 2016. doi: 10.3748/wjg.v22.i16.4136
Published online Apr 28, 2016. doi: 10.3748/wjg.v22.i16.4136
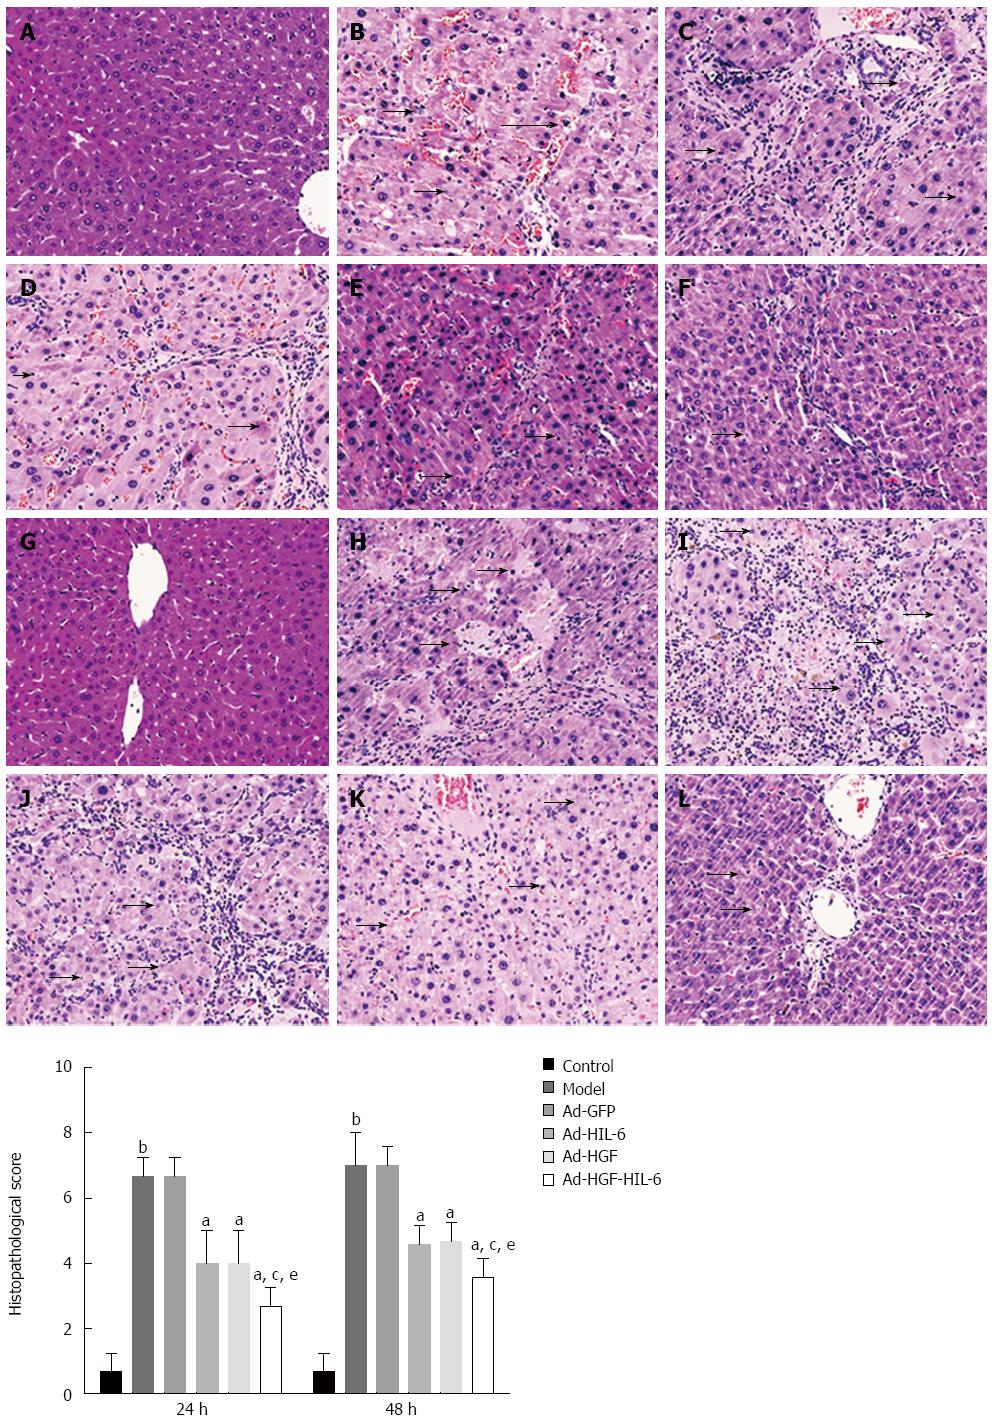
Figure 2 Effect of pDC315-3FLAG-sv40-HGF-IRES-Hyper-IL-6-EGFP on liver histology (HE staining, original magnification × 100) compared to those of pDC315-3FLAG-sv40-HGF-EGFP or pDC315-3FLAG-sv40-Hyper-IL-6-EGFP and comparison of histopathological scores for all types of treated liver.
Arrow indicates an apoptotic or necrotic cell. aP < 0.05 vs Ad-GFP treated, bP < 0.01 vs control, cP < 0.05 vs Ad-HIL-6 treated, and eP < 0.05 vs Ad-HGF treated. The results are expressed as the mean ± SEM, n = 8. Control: Normal liver; Model: ACLF liver; Ad-GFP: pDC315-3FLAG-sv40-EGFP; Ad-HIL-6: pDC315-3FLAG-sv40-Hyper-IL-6-EGFP; Ad-HGF: pDC315-3FLAG-sv40-HGF-EGFP; Ad-HGF-HIL-6: pDC315-3FLAG-sv40-HGF-IRES-Hyper-IL-6-EGFP; A: Control at 24 h; B: Model at 24 h; C: Ad-GFP at 24 h; D: Ad-HIL-6 at 24 h; E: Ad-HGF at 24 h; F: Ad-HGF-HIL-6 at 24 h; G: Control at 48 h; H: Model at 48 h; I: Ad-GFP at 48 h; J: Ad-HIL-6 at 48 h; K: Ad-HGF at 48 h; L: Ad-HGF-HIL-6 at 48 h.
- Citation: Gao DD, Fu J, Qin B, Huang WX, Yang C, Jia B. Recombinant adenovirus containing hyper-interleukin-6 and hepatocyte growth factor ameliorates acute-on-chronic liver failure in rats. World J Gastroenterol 2016; 22(16): 4136-4148
- URL: https://www.wjgnet.com/1007-9327/full/v22/i16/4136.htm
- DOI: https://dx.doi.org/10.3748/wjg.v22.i16.4136


