Copyright
©The Author(s) 2015.
World J Gastroenterol. Feb 7, 2015; 21(5): 1498-1509
Published online Feb 7, 2015. doi: 10.3748/wjg.v21.i5.1498
Published online Feb 7, 2015. doi: 10.3748/wjg.v21.i5.1498
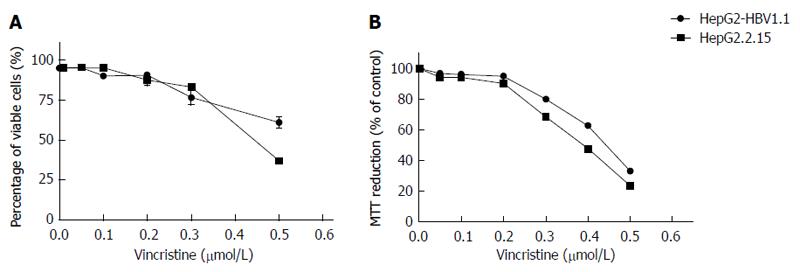
Figure 1 Effect of vincristine on the viability of stable hepatitis B virus-expressing cell lines.
A: The effect of vincristine on the viability of HepG2.2.15 and HepG2-HBV1.1 cells based on the trypan blue exclusive assay; B: The effect of vincristine on the viability of HepG2.2.15 and HepG2-HBV1.1 cells based on the MTT assay. HepG2.2.15 (4 × 10⁵/well) and HepG2-HBV1.1 (6 × 10⁵/well) cells were treated with vincristine at various concentrations (0-0.5 μmol/L) for 24 h, followed by 48 h of incubation in drug-free culture medium. The cells were collected 72 h after drug treatment. The results are expressed as the arithmetic mean ± SD from 3 independent experiments.
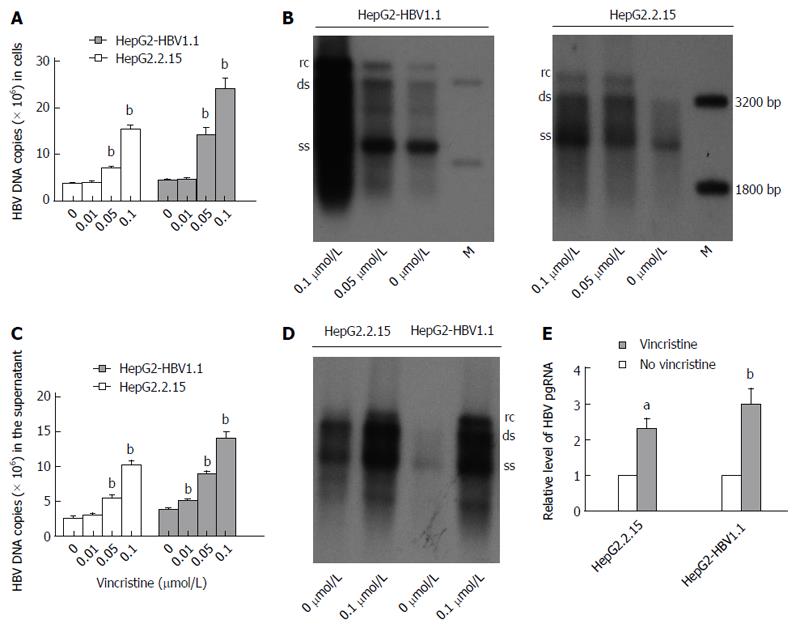
Figure 2 Dose-dependent increases in hepatitis B virus DNA and RNA in stable hepatitis B virus-expressing cell lines after treatment with vincristine.
A: Dose-dependent increase in HBV DNA in HepG2-HBV1.1 and HepG2.2.15 cells treated with vincristine based on real-time fluorescent quantitative PCR analysis; B: Dose-dependent increase in HBV DNA in HepG2-HBV1.1 and HepG2.2.15 cells treated with vincristine based on Southern blot analysis; C: Vincristine increases HBV DNA in the supernatants of HepG2-HBV1.1 cells and HepG2.2.15 cells based on real-time fluorescent quantitative PCR analysis; D: Vincristine increases HBV DNA in the supernatants of HepG2-HBV1.1 cells and HepG2.2.15 cells based on Southern blot analysis; E: Vincristine up-regulates HBV pgRNA based on real-time fluorescent quantitative PCR analysis. HepG2-HBV1.1 (6 × 10⁵/well) and HepG2.2.15 (4 × 10⁵/well) cells were treated with 0.1 μmol/L vincristine for 24 h followed by 48 h of incubation in drug-free culture medium. HBV intermediates or total RNA were extracted 72 h after drug treatment. Values represent the mean ± SD of 3 independent experiments, and a representative experiment is shown. aP < 0.05, bP < 0.01 vs control group (no vincristine). rc: Relaxed circular DNA; ds: Double-stranded DNA; ss: Single-stranded DNA. M: DNA ladder; pgRNA: Pregenome RNA.
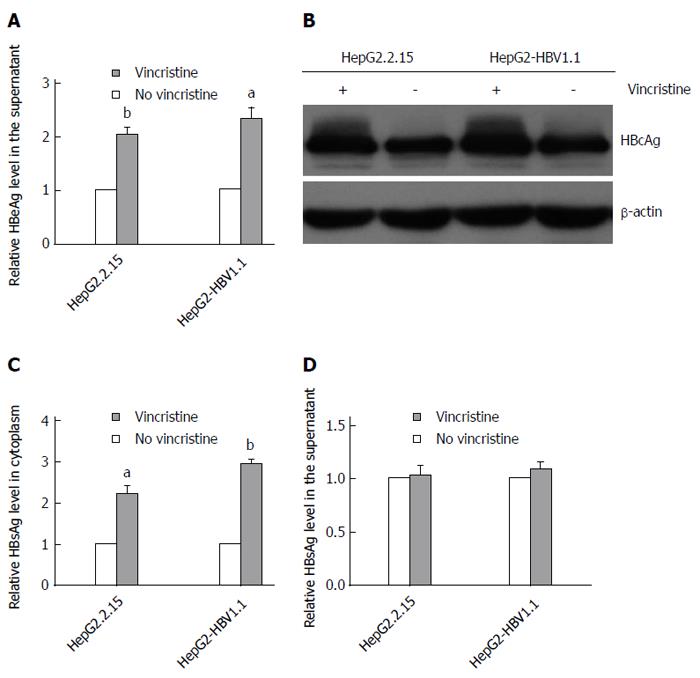
Figure 3 Vincristine promotes hepatitis B virus protein expression in HepG2-HBV1.
1 and HepG2.2.15 cells. A: Vincristine up-regulates HBeAg expression. HBeAg in the supernatant was analyzed using an ELISA assay; B: Vincristine increases cellular HBcAg expression based on Western blot analysis; C: The effect of vincristine on intracellular HBsAg expression was analyzed using an ELISA assay; D: The effect of vincristine on HBsAg expression in the supernatant was analyzed using an ELISA assay. HepG2-HBV1.1 (6 × 10⁵/well) and HepG2.2.15 (4 × 10⁵/well) cells were treated with vincristine at a concentration of 0.1 μmol/L for 24 h followed by 48 h of incubation in drug-free culture medium. Values represent the mean ± SD of 3 independent experiments. aP < 0.05, bP < 0.01 vs control group (no vincristine). HBeAg: Hepatitis B e Antigen; HBcAg: Hepatitis B c Antigen; HBsAg: Hepatitis B surface antigen.
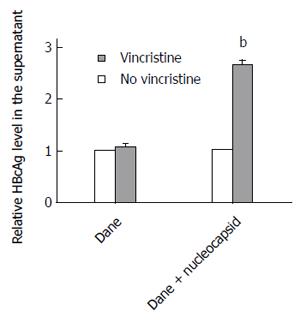
Figure 4 Vincristine promotes HepG2-HBV1.
1 cell excretion of hepatitis B virus nucleocapsids instead of hepatitis B virus Dane particles. HepG2-HBV1.1 cells (6 × 10⁵/well) were treated with vincristine at a concentration of 0.1 μmol/L for 24 h followed by 48 h of incubation in drug-free culture medium. The HBcAg from HBV Dane particles or nucleocapsids in the supernatant was analyzed using an ELISA assay. Dane: HBcAg from HBV Dane particles; Dane + nucleocapsid: HBcAg from HBV Dane particles and nucleocapsids. Values represent the mean ± SD of 3 independent experiments. aP < 0.05, bP < 0.01 vs control group (no vincristine). HBeAg: Hepatitis B e Antigen.
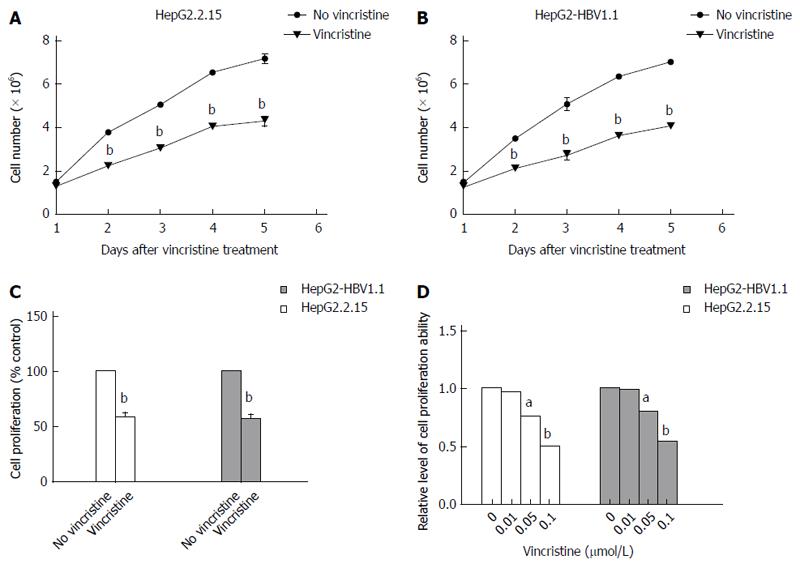
Figure 5 Vincristine inhibits the proliferation of HepG2.
2.15 cells and HepG2-HBV1.1 cells. HepG2.2.15 (4 × 10⁵/well) and HepG2-HBV1.1 (6 × 10⁵/well) cells were treated with vincristine at a concentration of 0.1 μmol/L for 24 h, and the medium was then changed to a drug-free culture medium. The cells were harvested 1, 2, 3, 4, and 5 d after vincristine treatment, respectively. A: The proliferation ability of HepG2.2.15 cells was examined using the trypan blue exclusion assay; B: The proliferation ability of the HepG2-HBV1.1 cells was examined using the trypan blue exclusion assay; C: Vincristine inhibits the proliferation of HepG2.2.15 cells and HepG2-HBV1.1 cells based on the BrdU incorporation test. Cells were treated with 0.1 μmol/L vincristine for 24 h and were transferred to 96-well plates (4 × 10³/well) with drug-free culture medium for another 48 h incubation; D: Vincristine dose-dependently inhibited the proliferation of cells based on the trypan blue exclusion assay. HepG2.2.15 (4 × 10⁵/well) and HepG2-HBV1.1 (6 × 10⁵/well) cells were treated with vincristine at concentrations of 0, 0.01, 0.05, and 0.1 μmol/L for 24 h, respectively, followed by 48 h of incubation in drug-free culture medium. Values represent the mean ± SD of 3 independent experiments. aP < 0.05, bP < 0.01 vs control group (no vincristine).
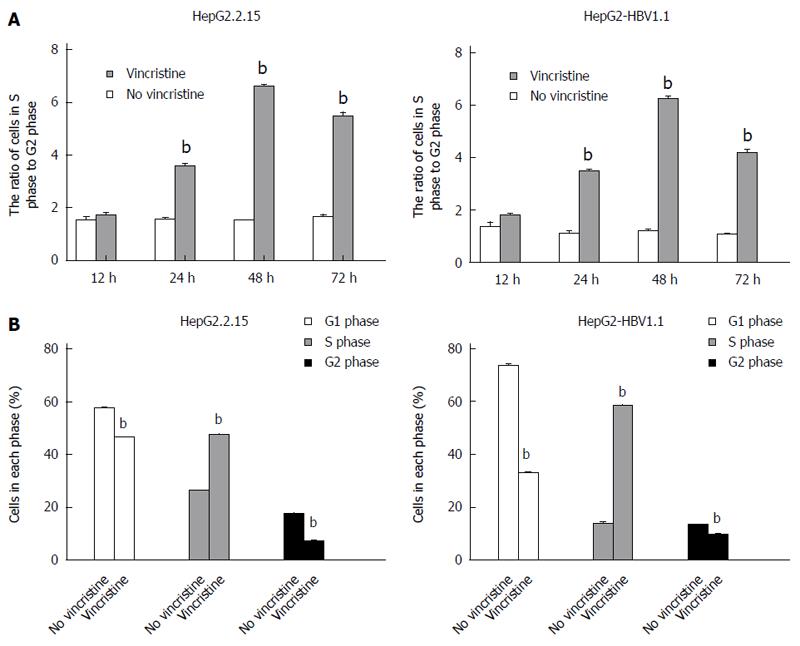
Figure 6 Vincristine induces the S-phase cell cycle arrest by flow cytometry.
HepG2.2.15 (4 × 10⁵/well) and HepG2-HBV1.1 (6 × 10⁵/well) cells were treated with vincristine at a concentration of 0.1 μmol/L for 24 h, and the medium was then changed to drug-free culture medium. A: The ratio of the cells in S-phase to G2-phase after vincristine treatment was calculated. The cells were harvested 12, 24, 48, and 72 h after vincristine treatment, respectively; B: Vincristine significantly increased the number of S-phase cells. The cells were harvested 48 h after vincristine treatment. Values represent the mean ± SD of 3 independent experiments. bP < 0.01 vs control group (no vincristine).
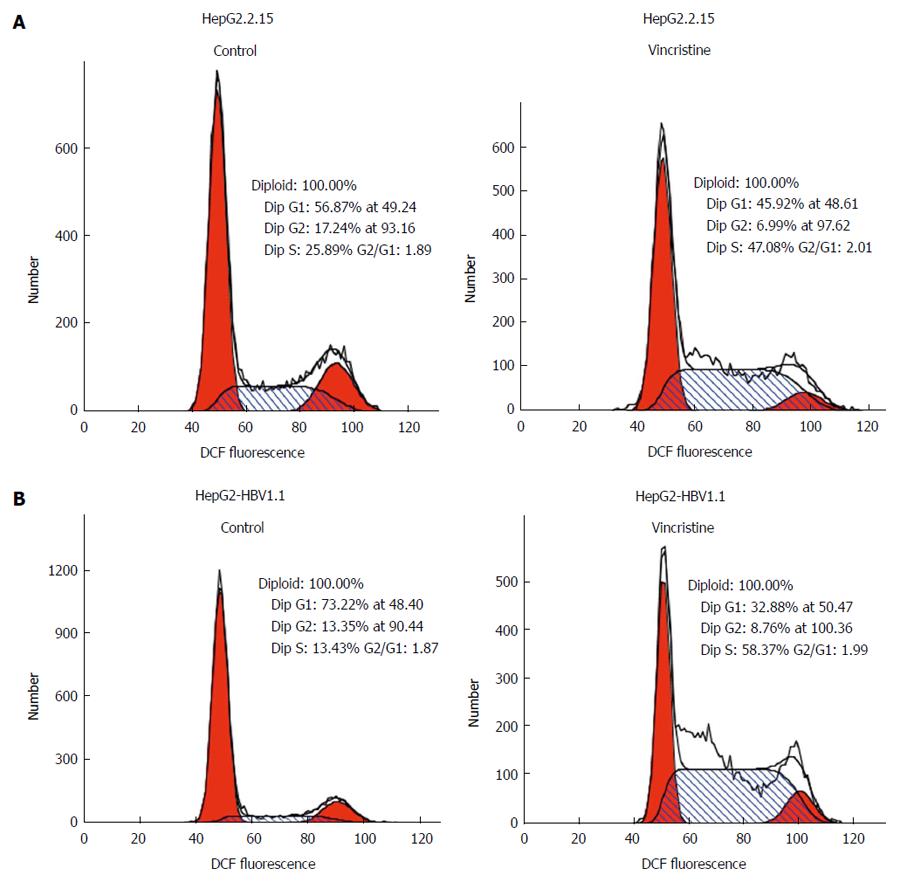
Figure 7 Diagram of the cell cycle for each phase based on flow cytometry.
HepG2.2.15 (4 × 10⁵/well) and HepG2-HBV1.1 (6 × 10⁵/well) cells were treated with vincristine at a concentration of 0.1 μmol/L for 24 h, followed by 48 h of incubation in drug-free culture medium. A: HepG2.2.15 cells; B: HepG2-HBV1.1 cells.
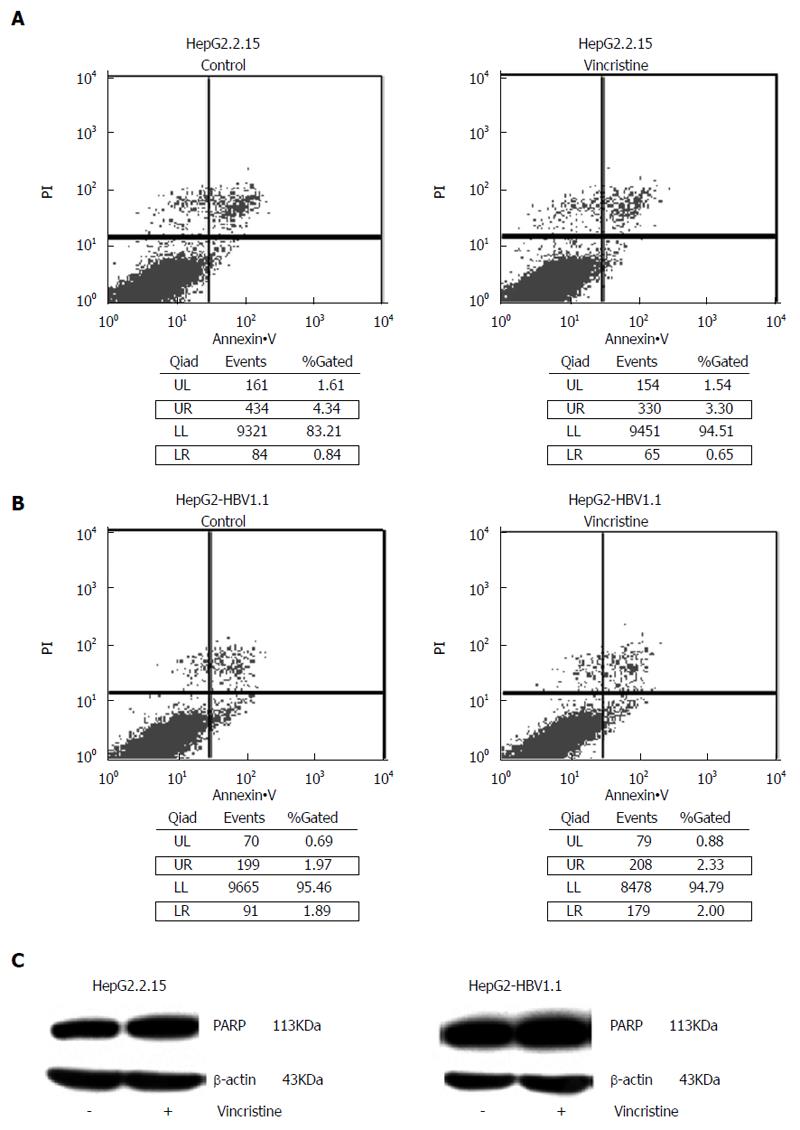
Figure 8 Vincristine at 0.
1 μmol/L does not cause significant cell apoptosis. HepG2.2.15 (4 × 10⁵/well) and HepG2-HBV1.1 (6 × 10⁵/well) cells were treated with vincristine at a concentration of 0.1 μmol/L for 24 h, followed by 48 h of incubation in drug-free culture medium. A: The level of apoptosis in the HepG2.2.15 cells was detected based on flow cytometry; B: The level of apoptosis in the HepG2-HBV1.1 cells was detected based on flow cytometry; C: Western blot analysis of the PARP protein. PARP: Poly(ADP-ribose) polymerase; LR: Lower-right; UR: Upper-right.
- Citation: Xu L, Tu Z, Xu G, Hu JL, Cai XF, Zhan XX, Wang YW, Huang Y, Chen J, Huang AL. S-phase arrest after vincristine treatment may promote hepatitis B virus replication. World J Gastroenterol 2015; 21(5): 1498-1509
- URL: https://www.wjgnet.com/1007-9327/full/v21/i5/1498.htm
- DOI: https://dx.doi.org/10.3748/wjg.v21.i5.1498


