Copyright
©The Author(s) 2015.
World J Gastroenterol. Dec 21, 2015; 21(47): 13225-13239
Published online Dec 21, 2015. doi: 10.3748/wjg.v21.i47.13225
Published online Dec 21, 2015. doi: 10.3748/wjg.v21.i47.13225
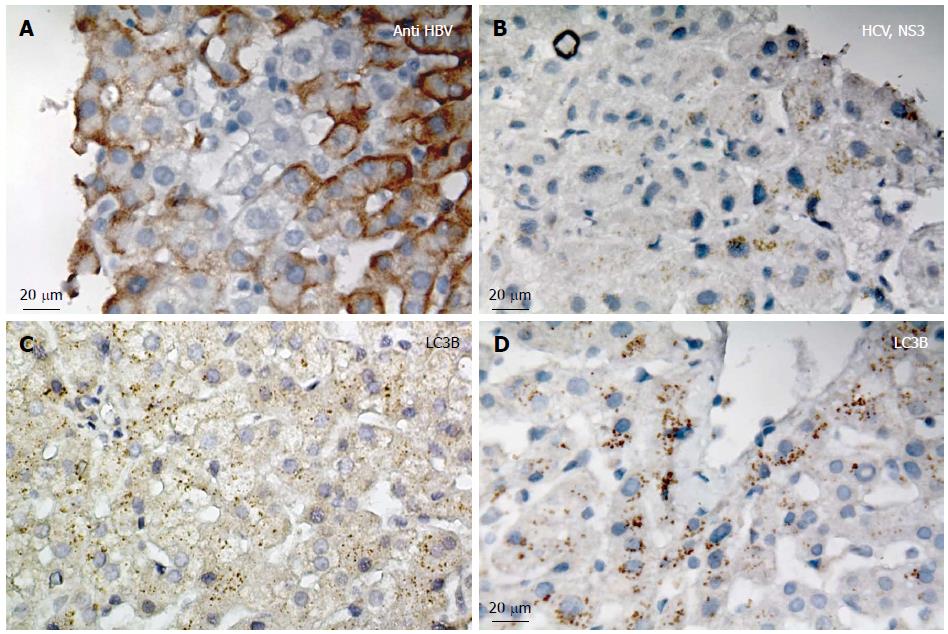
Figure 1 Confirmation of hepatitis B and C virus infection and LC3β expression in liver tissues.
A: Immunohistochemistry (IHC) confirms hepatitis B virus (HBV) infection in the liver tissue; the image is representative of IHC for HBV infection in all patients; B: IHC confirms hepatitis C virus (HCV) infection (Anti NS3 HCV) in the liver tissue; the image is representative of IHC for HCV infection in all patients; C: IHC confirms LC3β expression in HBV infected liver tissue; the image is representative of IHC for all patients; D: IHC confirms LC3β expression in HCV infected liver tissue; the image is representative of IHC for all patients.
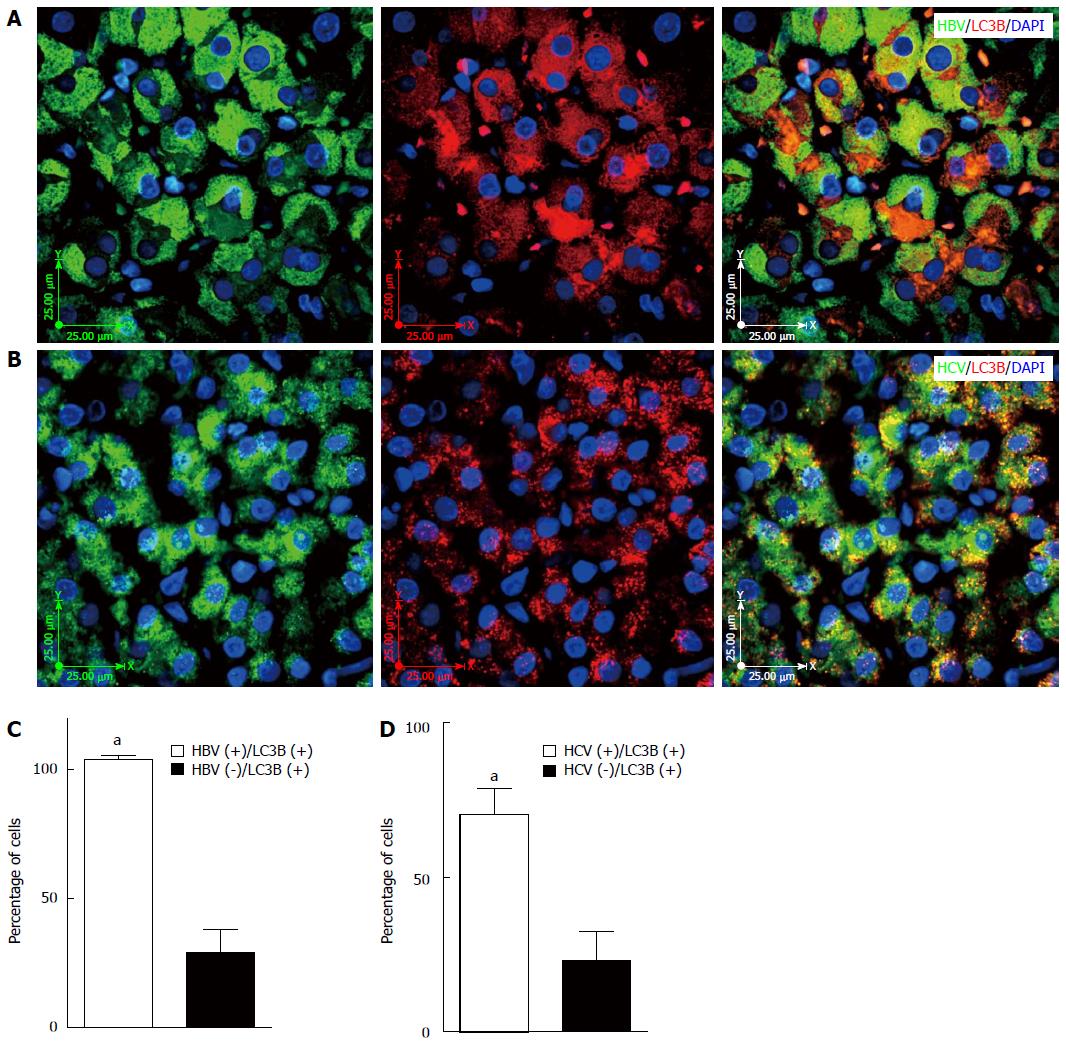
Figure 2 Hepatitis B and C virus infection induces autophagy in liver tissues.
A: Fluorescent immunohistochemistry (IHC) confirms co-localization of hepatitis B virus (HBV) and punctate LC3β in the HBV-infected liver tissue; the image is representative of fluorescence IHC for all patients; B: Fluorescencent IHC confirms co-localization of hepatitis C virus (HCV) and punctate LC3β in the HCV infected liver tissue; the image is representative of fluorescence IHC for all patients; C: HBV infection significantly (aP < 0.001 vs HBV-) induces autophagy in the infected hepatocytes compared to non-infected adjacent cells. The graph shows results of the event (HBV infection and punctuated LC3β) in at least 50 cells counted in four different microscopic fields of view from each patient’s sample. D: HCV infection significantly (aP < 0.001 vs HCV-) induces autophagy in the infected hepatocytes compared to non-infected adjacent cells. The graph shows results of the event (HCV infection and punctuated LC3β) in at least 50 cells counted in four different microscopic fields of view from each patient’s sample.
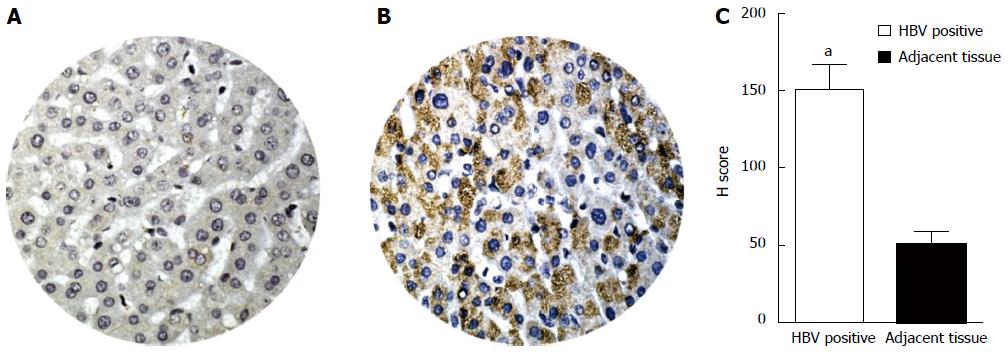
Figure 3 Comparison of LC3β expression, determined by immunohistochemistry in HBVPos and HBVNeg liver tissue microarrays.
Immunohistochemistry was performed as described in Materials and Methods. H-scores were derived from semi-quantitative assessments of both staining intensity (scale 0-3) and the percentage of positive cells (0%-100%) and, when multiplied, generate a score ranging from 0 to 300. A: Representative image of tissue core from HBVNeg liver showing low expression of LC3β (H-score of 50); B: HBVPos liver tissue showing higher expression of LC3β (H-score of 150); C: The bar graphs show expression levels (H-score) of LC3β in HBVPos and HBVNeg liver tissue microarrays. The bars represent the mean ± SEM. aP < 0.001 vs the normal HBVNeg. HBV: Hepatitis B virus; HCV: Hepatitis C virus.
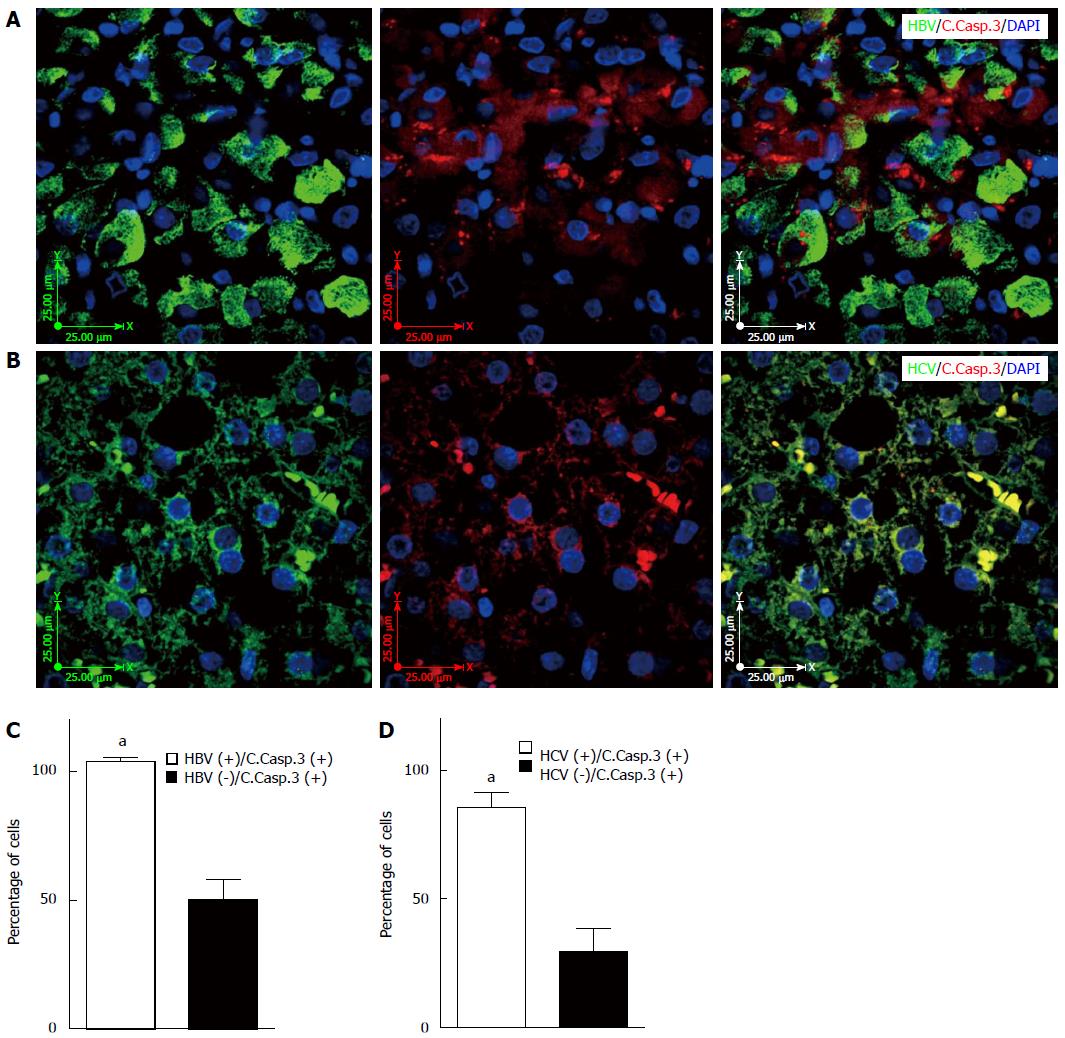
Figure 4 Hepatitis B and C virus infection induces apoptosis in the infected liver tissue.
A: Immunofluorescence double-labeling shows co-localization of hepatitis B virus (HBV) and cleaved caspase-3 in the HBV infected liver tissue; the image is representative of fluorescence immunohistochemistry (IHC) for all patients; B: Immunofluorescence double-staining shows co-localization of hepatitis C virus (HCV) and cleaved caspase-3 in the HCV infected liver tissue; the image is representative of fluorescence IHC for all patients; C: HBV infection significantly (aP < 0.001 vs HBV-) induces apoptosis in the infected hepatocytes compared to non-infected adjacent cells. The graph shows results of the event (HBV infection and cleaved caspase-3) in at least 50 cells counted in four different microscopic fields from each patient’s sample; D: HCV infection significantly (aP < 0.001 vs HCV-) induces apoptosis in the infected hepatocytes compared to non-infected adjacent cells. The graph shows results of the event (HCV infection and cleaved caspase-3) in at least 50 cells counted in four different microscopic fields from each patient’s sample.
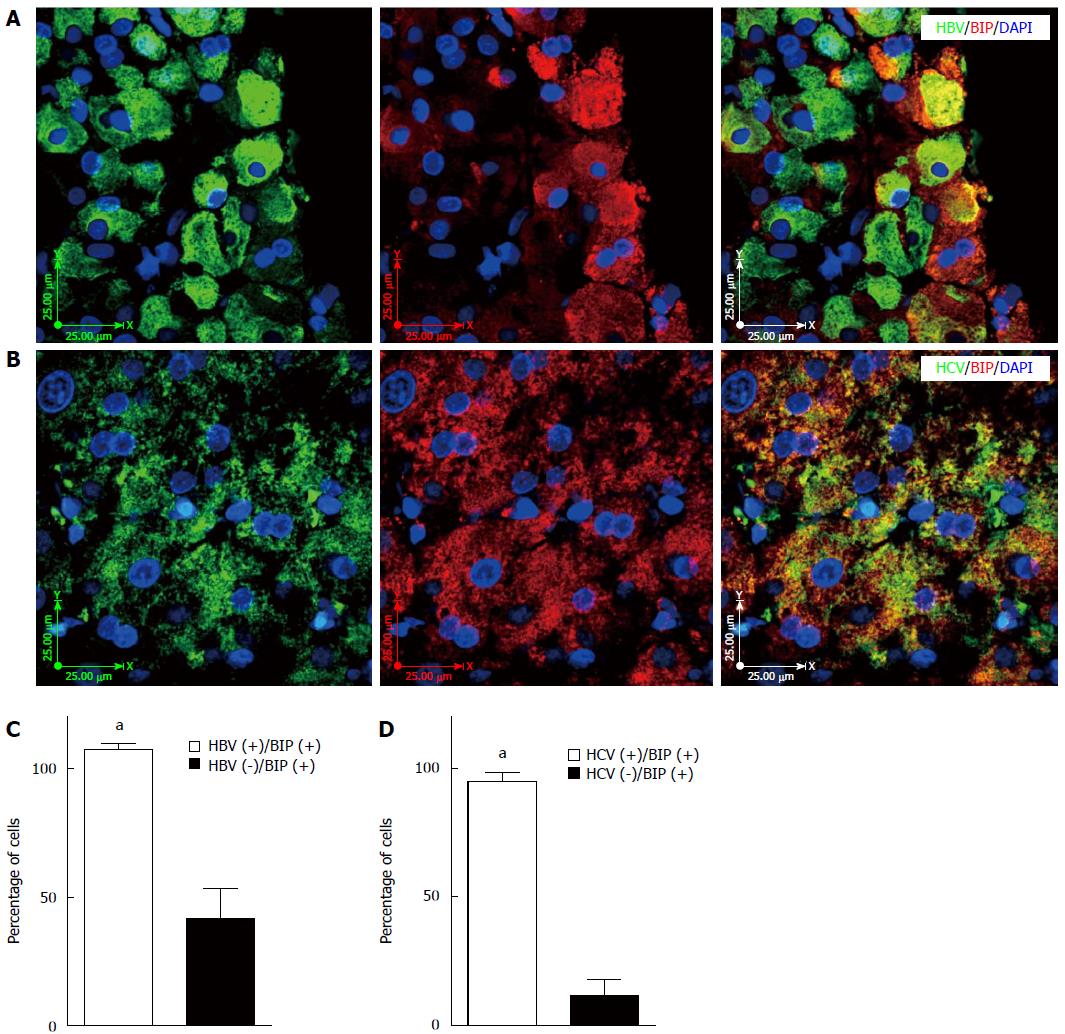
Figure 5 Hepatitis B and C virus infection induces unfolded protein response in the infected liver tissue.
A: Fluorescence immunohistochemistry (IHC) confirms co-localization of hepatitis B virus (HBV) and BIP (GRP78) expression in the HBV-infected liver tissue; the image is representative of fluorescence IHC for all patients; B: Fluorescence IHC confirms co-localization of hepatitis C virus (HCV) and BIP (GRP78) expression in the HCV-infected liver tissue; the image is representative of fluorescence IHC for all patients; C: HBV infection significantly (aP < 0.001 vs HBV-) induces UPR in the infected hepatocytes compared to non-infected adjacent cells. The graph shows results of the event,HBV infection and BIP (GRP78) expression in at least 50 cells counted in four different views of fluorescence IHC in each patient’s sample; D: HCV infection significantly (aP < 0.001 vs HCV-) induces UPR in the infected hepatocytes compared to non-infected adjacent cells. The graph shows results of the event (HCV infection and BIP (GRP78) expression) in at least 50 cells counted in four different views of fluorescence IHC in each patient’s sample. UPR: Unfolded protein response.
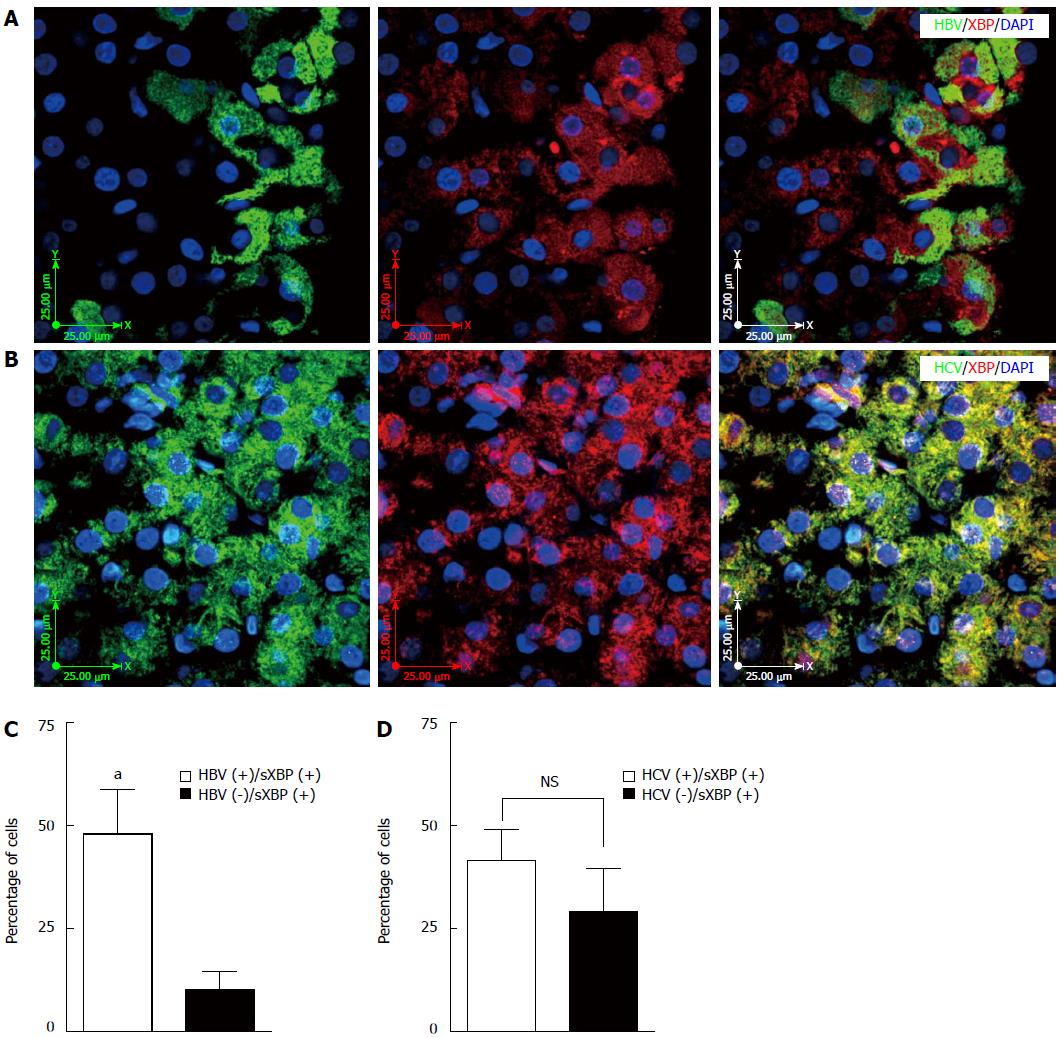
Figure 6 Hepatitis B virus infection induces XBP splicing in the infected liver tissue while hepatitis C virus infection does not induce XBP splicing.
A: Fluorescence immunohistochemistry (IHC) confirms co-localization of hepatitis B virus (HBV) and spliced XBP (sXBP) (spliced XBP localized in the nucleus) in the HBV-infected liver tissue; the image is representative of fluorescence IHC for all patients; B: Fluorescence IHC shows that co-localization of hepatitis C virus (HCV) and spliced XBP (sXBP) (spliced XBP localized in the nucleus) is not a dominant event in the HCV-infected liver tissue; the image is representative of fluorescence IHC for all patients; C: HBV infection significantly (aP < 0.001 vs HBV-) induces XBP splicing (spliced XBP localized in the nucleus) in the infected hepatocytes compared to non-infected adjacent cells. The graph shows results of the event [HBV infection and spliced XBP (sXBP) (spliced XBP localized in the nucleus)] in at least 50 cells counted in four different views of fluorescence IHC in each patient’s sample; D: HCV infection does not significantly (P > 0.05) induce XBP splicing in the infected hepatocytes compared to non-infected adjacent cells. The graph shows results of the event [HCV infection and spliced XBP (sXBP) (spliced XBP localized in the nucleus)] in at least 50 cells counted in four different views of fluorescence IHC in each patient’s sample.
- Citation: Yeganeh B, Rezaei Moghadam A, Alizadeh J, Wiechec E, Alavian SM, Hashemi M, Geramizadeh B, Samali A, Bagheri Lankarani K, Post M, Peymani P, Coombs KM, Ghavami S. Hepatitis B and C virus-induced hepatitis: Apoptosis, autophagy, and unfolded protein response. World J Gastroenterol 2015; 21(47): 13225-13239
- URL: https://www.wjgnet.com/1007-9327/full/v21/i47/13225.htm
- DOI: https://dx.doi.org/10.3748/wjg.v21.i47.13225


