Copyright
©The Author(s) 2015.
World J Gastroenterol. Dec 21, 2015; 21(47): 13225-13239
Published online Dec 21, 2015. doi: 10.3748/wjg.v21.i47.13225
Published online Dec 21, 2015. doi: 10.3748/wjg.v21.i47.13225
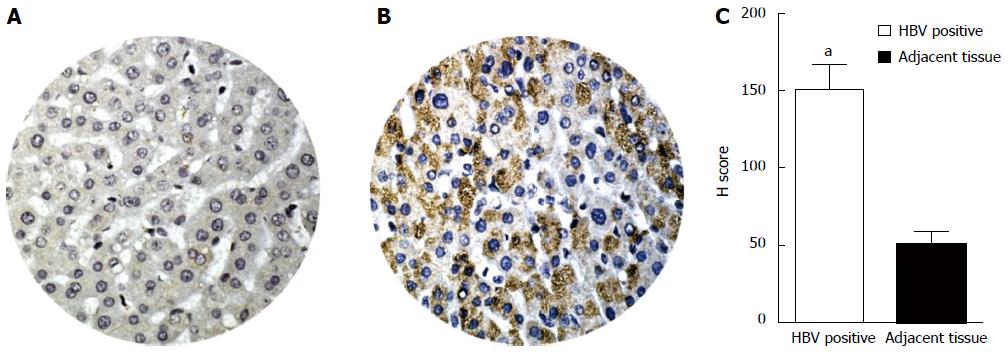
Figure 3 Comparison of LC3β expression, determined by immunohistochemistry in HBVPos and HBVNeg liver tissue microarrays.
Immunohistochemistry was performed as described in Materials and Methods. H-scores were derived from semi-quantitative assessments of both staining intensity (scale 0-3) and the percentage of positive cells (0%-100%) and, when multiplied, generate a score ranging from 0 to 300. A: Representative image of tissue core from HBVNeg liver showing low expression of LC3β (H-score of 50); B: HBVPos liver tissue showing higher expression of LC3β (H-score of 150); C: The bar graphs show expression levels (H-score) of LC3β in HBVPos and HBVNeg liver tissue microarrays. The bars represent the mean ± SEM. aP < 0.001 vs the normal HBVNeg. HBV: Hepatitis B virus; HCV: Hepatitis C virus.
- Citation: Yeganeh B, Rezaei Moghadam A, Alizadeh J, Wiechec E, Alavian SM, Hashemi M, Geramizadeh B, Samali A, Bagheri Lankarani K, Post M, Peymani P, Coombs KM, Ghavami S. Hepatitis B and C virus-induced hepatitis: Apoptosis, autophagy, and unfolded protein response. World J Gastroenterol 2015; 21(47): 13225-13239
- URL: https://www.wjgnet.com/1007-9327/full/v21/i47/13225.htm
- DOI: https://dx.doi.org/10.3748/wjg.v21.i47.13225


